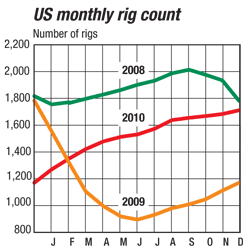
After the swan dive that US drilling took in 2009, there was nowhere to go but up. An average 1,270 rigs were running in January 2010, and as oil prices recovered, so did the rig count. By year-end some 1,700 rigs were operating, a 31% increase over the previous 12 months. The big story of 2010 was crude oil, as rising prices made mature oil plays more valuable, and the Macondo spill pushed the onshore trend further.
The states that saw the steepest declines in ’09 showed the strongest recoveries. Texas increased its average rig count to 660 for the year, nearly a 40% bump. The lion’s share of the drilling increase took place in the traditional oil fields in the Permian Basin of West Texas and the Panhandle.
Other provinces that had suffered a brutal 2009 showed significant improvement. Oklahoma posted a 32-rig increase on average, or 33%. Louisiana gained 38, for a 25% improvement, all of that in the state’s north. Offshore Louisiana saw a decline of some dozen rigs.
Pennsylvania, one of the few bright spots for drilling in 2009, continued to improve, nearly doubling its average rig count to 85. New Mexico, likewise, saw a significant gain. In other states, there was a general upward trend across the board, most areas either holding steady or picking up the pace slightly. Arkansas, however, saw a small decrease to an average 39 rigs.
| Average number of US rotary rigs in operation1 |
 |
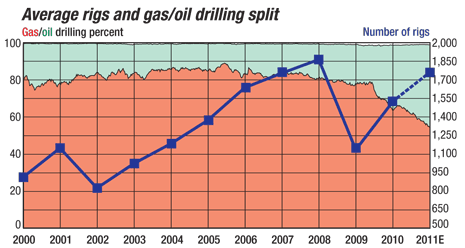
Month to month, the recovery that began in mid-2009 continued its strong and steady pace into 2011. Oil’s share of the pie, tracking oil prices, rose from just over a third of drilling activity to 45% by the end of 2010. This trend will most likely continue this year until oil accounts for over half of US rig activity. Gas drilling saw a small but significant decrease, as natural gas prices, which had been weak at the end of 2009, fell to nearly a 10-year low before recovering toward the beginning of 2011. Overall, the average Henry Hub spot price went from $3.94 in 2009 to $4.37 in 2010—a small improvement but not sufficient to stimulate increased gas drilling.
World Oil is predicting an average rig count of 1,773 for 2011, representing a 15% increase over 2010.
According to NOV Downhole’s 57th annual rig census, published last November, the number of new and refurbished rigs in the US was in balance with the number retired and dormant, so that the fleet actually saw a small decrease to 3,153 going into the fourth quarter. Some 243 rigs were added to the US total, including 131 newbuilds and 87 brought back into service. This failed to offset the 259 rigs either retired or removed from the US market. Rigs are still being manufactured and brought online, but at a slower pace than was typical the previous five years. The fleet, therefore, is remaining fairly stable even as the utilization rate climbs.
 |
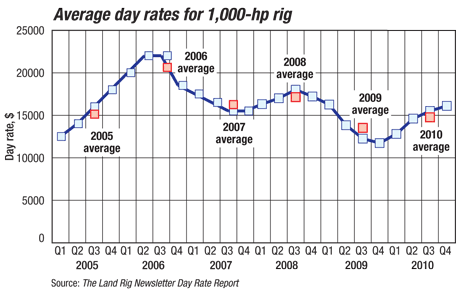
Day rates for a typical 1,000-hp rig bottomed out at $11,725 in the fourth quarter of 2009, and then climbed to an average $16,100 for the fourth quarter of last year. The average for the entire year 2010 was $14,750, an 8.4% improvement over 2009 rates, but still well below 2008’s average of $17,150. We would expect this rising trend to continue, allowing for seasonal cycles, especially as the slack in available rigs is taken up. 
The data used for our rig count, from Baker Hughes, represents only those rigs that are significant consumers of oilfield services and supplies. It does not include very small truck-mounted rigs or rigs that can operate without a permit. However, non-rotary rigs such as coiled tubing and workover rigs drilling new wells may be included. To be counted, a rig must be on location and be “actively” drilling. A rig is active from the moment the well is spudded until it reaches TD. Rigs that are in transit, rigging up, or performing workovers, completions or production testing are not counted. The Land Rig Newsletter day rates represent a spot market base rate without fuel or other add-ons.
|


