Integrating time-lapse seismic, reservoir simulation and geomechanics
Co-visualizing different models of the subsurface enables an understanding of the producing reservoirs that could not be achieved when using these models individually.
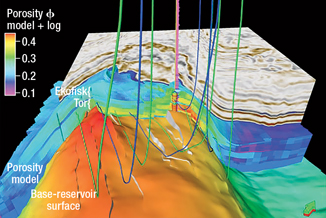
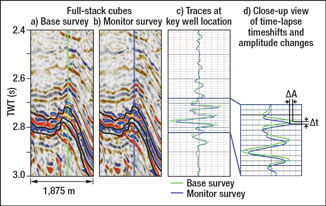
Co-visualizing different models of the subsurface enables an understanding of the producing reservoirs that could not be achieved when using these models individually.Ken Kosco, Christian Rau Schiøtt and Ole Valdemar Vejbæk, Hess; In recent years, time-lapse seismic data has been used increasingly as a reservoir management tool and as an aid in field development planning. The use of high-quality and carefully processed time-lapse seismic data, in conjunction with reservoir simulation models and production data, enables the creation of an internally consistent subsurface model that yields detailed insight into reservoir fluid flow processes and geomechanical processes. Co-visualizing such subsurface models together with reservoir geomechanical models enables an understanding of reservoir dynamics that could not be achieved when using these models individually. South Arne Field, in the Danish North Sea, is a chalk reservoir under waterflood that produces from horizontal wells stimulated via hydraulic fracturing. The highly porous crest of the reservoir is undergoing compaction. A highly repeatable time-lapse seismic survey (normalized root mean square, or NRMS, of approximately 0.1) allows reliable monitoring of reservoir production processes during five years of depletion. Time-lapse rock physics amplitude-versus-offset (AVO) inversion enables accurate monitoring of fluid pathways. By comparing time-lapse timeshifts in the overburden and predictions of reservoir compaction from reservoir geomechanical modeling, we can calibrate and validate the reservoir geomechanical model. In areas where compaction observations and predictions disagree, time-lapse seismic provides the necessary insight into how to update material properties to populate an updated reservoir geomechanical model. The information contained in time-lapse seismic can be fully extracted and used only when the reservoir simulation model, the reservoir geomechanical model and the time-lapse seismic inversion models are co-visualized and available in one software application with one set of coordinates. This allows for easy and reliable comparison of parameters describing reservoir compaction between observations from seismic data and predictions from reservoir simulation models. Critical to a successful co-visualization effort is close collaboration and open communication among all parties. SOUTH ARNE PETROLEUM GEOLOGY South Arne extends 12.5 km by 3 km, with the long axis of the double-dipping anticline trending NNW–SSE. Production started in July 1999 predominantly from horizontal wells oriented NNW–SSE along the axis of the reservoir, Fig. 1. Cumulative production up to March 2008 was 116 million bbl of 34.2°API oil and 166 Bcf of gas. On the northern shoulder of the anticline, post-depositional faults create a graben-like structure at the crest of the reservoir. The graben also strikes NNW–SSE. A second set of WNW–ESE-trending faults can be interpreted from 3D seismic data over the entire field, except in an area obscured by a gas cloud. The second set of faults contributes significantly to reservoir depletion. The oil-bearing intervals are the late Cretaceous Tor and overlying early Cretaceous Ekofisk Formations. Reservoir quality is variable, and the best reservoir quality is found on the crest of the northern flank, with a total reservoir thickness up to 65 m, split between Tor (about 40 m) and the overlying Ekofisk (about 25 m) Formations. The Ekofisk and Tor Formations are separated by the Ekofisk tight zone. Porosity values on the northern flank in the Tor range 25–46%, with an average porosity of 37%. Matrix permeability in the Tor ranges 1–10 mD, with fractures and faults contributing significantly to permeability. On the western and eastern flank of the reservoir, the chalk sequence thickens with distance from the axis of the anticline, increasing the thickness of the reservoir interval. At the same time, porosity and permeability drop significantly. Due to the low permeability in the distal part of the chalk sequence, pressure support by the water table is minimal, and water injection provides the necessary drive energy for hydrocarbon production. In the high-porosity region on the crest of the reservoir, compaction adds additional drive energy, estimated at 20% of total drive energy. Source rock is provided by the underlying late Jurassic shale sequences. The reservoir produces from horizontal wells, interleaved with horizontal water injection wells. Production is enhanced by induced vertical fractures and is further supported by water injection. Both producers and injectors are stimulated by acid frac or hydraulic frac using a proppant. The induced fractures are vertical and aligned with the direction of the horizontal wells, drilled in the direction of minimal horizontal stress, to enable a homogeneous sweep across the reservoir interval. TIMESHIFTS AND AMPLITUDE CHANGES Seismic data observations include the amplitude and the arrival time of a wavelet reflected by an interface in the subsurface. At South Arne, the interfaces between the reservoir and the overburden, as well as between the reservoir and the underburden, are strong reflectors. Figures 2a and 2b display a vertical section of the baseline survey and the monitor survey, respectively. The top- and base-reservoir reflector interpretations are indicated by black lines. Additionally, the interface between the upper (Ekofisk) reservoir and the lower (Tor) reservoir is marked.
For further analysis, traces from the 1995 baseline survey and the 2005 monitor survey are extracted and displayed in Figs. 2c and 2d. Amplitude changes ΔA and time-lapse timeshifts Δt are readily visible. The arrival times of the base-survey t1 (in green) are consistently earlier than the corresponding arrival times of the equivalent reflections in the monitor survey t2 (in blue). The observed time-lapse timeshift (Δt = t1–t2) are negative, with a maximum observed value of approximately –7 ms.
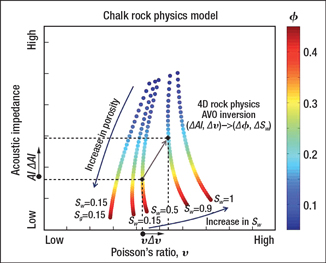
Time-lapse timeshifts have a diagnostic value in monitoring reservoir compaction. The timeshifts in the overburden can be explained by a combination of geomechanical modeling (predicting reservoir compaction as pore pressure in the reservoir is reduced) and associated overburden stretching. TIME-LAPSE AVO INVERSION In AVO inversion, we use the fact that the amplitude of a reflected wave depends on the change of elastic properties, such as acoustic impedance (AI) or Poisson’s ratio (v), across the interface. The variation of reflection coefficient with incidence angle can thus be used to create subsurface images of acoustic impedance and Poisson’s ratio using 3D AVO inversions. In time-lapse AVO inversion, the change in reflection coefficient over time can be used to determine changes in acoustic impedance (ΔAI) and Poisson’s ratio (Δv). To additionally determine changes in reservoir engineering parameters such as fluid saturation, it is necessary to obtain a calibrated rock physics model that allows translation of the observed changes in AI and v to changes in reservoir properties. At South Arne, AI is closely correlated with porosity (Φ) in the chalk sequences, and v is a sensitive fluid indicator. Note that other factors, such as depositional environment and compaction history, will also influence the seismic behavior of the chalks comprising the reservoir. Therefore, the rock physics model needs to be calibrated for each reservoir unit. The calibration is done using log data and, where available, laboratory measurements.
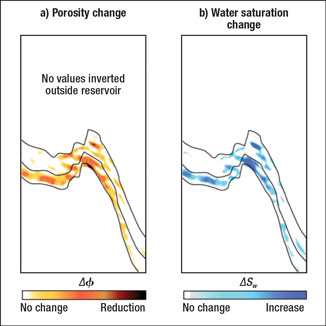
The rock physics model employed for the lower reservoir (Tor) in this study is displayed in Fig. 3. Application of the rock physics model allows the effective translation of ΔAI and Δv to changes in water saturation (ΔSw) and porosity (ΔΦ), and vice-versa. The resulting rock physics time-lapse AVO inversion images of ΔΦ and ΔSw are displayed in Figs. 4a and 4b, respectively.
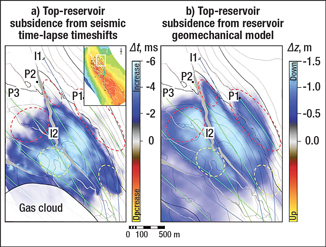
Note also that, for the shale sequences outside the reservoir, no calibrated rock physics model is available. Therefore, the overburden and underburden are masked out for the rock physics inversion. It would be of interest, however, to relate inverted changes in elastic properties in the overburden and underburden to changes in strain or porosity for geomechanical applications such as seal-integrity studies. COMPACTION MONITORING The high-porosity chalk comprising the reservoir on the South Arne Field’s northern crest makes production-induced reservoir compaction a distinct possibility, and reservoir compaction at the nearby Ekofisk and Valhall chalk fields is well established. Laboratory experiments from the upper (Ekofisk) and lower (Tor) reservoirs show the typical chalk compaction behavior: As pore pressure is reduced and mean effective stress increases, the chalk initially shows a slow (and reversible) decline in porosity. At a critical effective stress, irreversible compaction occurs as the weakly cemented grain-to-grain bonds fail and pore space collapses. High porosity in chalks causes a low critical stress at which pore space collapse starts to occur. In the lower reservoir, the critical stress can be as low as 15 MPa at an initial porosity of 45%. Replacing oil with water in the pore space additionally lowers the critical stress to 12 MPa. To predict reservoir compaction and associated porosity and permeability changes, a full-field reservoir geomechanical model was built and coupled to the reservoir simulation model. A calibrated reservoir geomechanical model assists in reliably assessing the amount of compaction drive energy, allows for a better production forecast by including stress-dependent permeabilities and allows for an assessment of the risk of well failure by differential compaction. Geomechanical simulations also need to be calibrated (i.e., matched) with data observations in the same way that reservoir simulation models can be history matched using produced water and hydrocarbon volume and observed reservoir pressure. For compaction monitoring, time-lapse seismic can provide the necessary calibration tool. In comparing time-lapse timeshifts Δt on the top-reservoir horizon with displacement Δz of the same horizon predicted from reservoir geomechanical modeling, the time-lapse timeshifts are taken as a proxy for the predicted vertical displacement. This seems a reasonable assumption, since the timeshifts are caused by the compaction-induced stretching of the overburden and an associated velocity slowdown; i.e., the seismic wave in the monitor survey travels a longer path at a slower velocity, thereby causing the observed timeshifts. However, the exact nature and means of calibrating the relationship between overburden stretching, velocity slowdown and observed timeshifts is still a field of active research and debate. The observed Δt map (Fig. 5a) and computed Δz map (Fig. 5b) broadly agree. Maximum Δt is 6 ms, and the maximum Δz is 1.5 m. This relationship (Δt/Δz = 4) between time-lapse timeshifts and vertical displacement is also in broad agreement with observations at Valhall and Ekofisk. Both maps indicate fault control of reservoir compaction, where faults clearly act as depletion barriers.
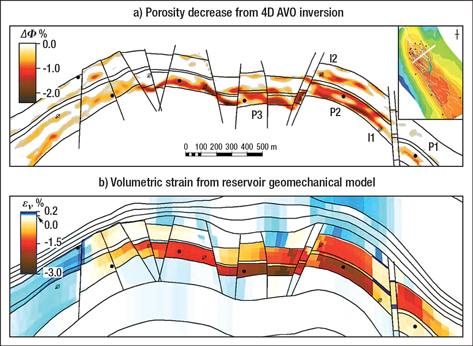
However, more interesting than the similarities are the subtle differences between the two maps. Areas where the observed compaction is stronger than predicted compaction are indicated by yellow ellipses; areas where observed compaction is less than predicted compaction are marked by red ellipses. This can be seen especially clearly for the area drained by producer P1, where compaction of up to 75 cm is predicted, but no time-lapse timeshifts are observed. These observations can be used to adjust the material properties of the reservoir geomechanical model. In areas that are seen to be compacting from seismic data (but where the simulation model does not predict compaction), either the porosity may be increased or the critical stress at which irreversible deformation occurs can be lowered. For producer P3, it would be reasonable to increase porosity in the central area marked by the yellow ellipse and to decrease porosity in the area marked by the red ellipse. Thus, the net result on production for the entire well may be left unchanged, and the history matching of production for the entire well would not be affected. The inversion for acoustic impedance or rock physics inversion to porosity can also assist in determining whether the simulator porosity model should be updated. A quantitative comparison of compaction estimates from time-lapse seismic inversions and from reservoir geomechanical modeling provides a similar picture of compaction to the picture derived from time-lapse timeshifts and vertical strain images. In Fig. 6, we compare porosity changes, inferred from time-lapse AVO, and volumetric strain (εv) from the reservoir geomechanical model. Assuming that a negative volumetric strain (i.e., a decrease in volume) is caused by reduction in porosity, the two quantities describe the same process. Porosity reduction of about 2.5% is measured by time-lapse seismic across the lower (Tor) reservoir across most of the crestal area, with predicted volumetric strain of about 3%. Discrepancies are again observed around producer P1, where time-lapse seismic observations detect only negligible porosity reduction and the reservoir geomechanical model predicts volumetric strains of –1.5%.
CONCLUSIONS Highly repeatable time-lapse seismic data was used to obtain a clearer understanding of reservoir compaction. Using time-lapse seismic in conjunction with a reservoir simulation model in the same software environment allows for rapid scanning of differences and similarities between the reservoir behavior patterns derived from time-lapse seismic and from reservoir simulation. Reconciliation of reservoir simulation models and reservoir geomechanical models with time-lapse seismic data and inversion models resulted in a well-calibrated simulation model. Such a calibrated model has a higher probability of accurately predicting future reservoir behavior and, therefore, allows for more efficient day-to-day reservoir management and for optimization of future field development. ACKNOWLEDGMENT This article was prepared from the paper “Applying time-lapse seismic to reservoir management and field development planning at South Arne, Danish North Sea” presented at the Geological Society of London’s seventh Petroleum Geology Conference held in London, March 30–April 2, 2009. The authors wish to thank the South Arne partnership of Hess, Dong Energy, Noreco and Danoil for permission to publish this article. We also want to acknowledge the work of Frédéric Bourgeois and James Minton in building and running the South Arne reservoir geomechanical model; the work of Valerie Biran, Henrik Juhl Hansen and Kjetil Westeng on rock physics modeling and rock physics AVO inversion; and the work of Paul Groombridge, Ed Palmer and Paul Ramsden on time-lapse data processing of the South Arne data set.
|
|||||||||||||||||||||||||||||||||||||||||||||
- Coiled tubing drilling’s role in the energy transition (March 2024)
- Advancing offshore decarbonization through electrification of FPSOs (March 2024)
- Subsea technology- Corrosion monitoring: From failure to success (February 2024)
- Using data to create new completion efficiencies (February 2024)
- Digital tool kit enhances real-time decision-making to improve drilling efficiency and performance (February 2024)
- E&P outside the U.S. maintains a disciplined pace (February 2024)

