Integrating converted shear-wave data with traditional P-wave data provides reservoir insights.
Robert R. Stewart, University of Houston
Analyzing both compressional PP waves (“loud” and arriving first) and converted-shear PS wavefields (“shy” and arriving later) from a multicomponent seismic survey can provide more information about subsurface structures, lithologies and their fluid saturants. This article discusses the techniques of jointly interpreting P-wave (compressive wave) data in association with converted-wave (P-to-S on reflection) seismic data—that is, having a more complete seismic conversation to locate subsurface resources. The methods include log analysis, generation of synthetic seismograms and vertical seismic profile (VSP) correlation, along with registering, picking and calculating ratios of the PP and PS sections.
Three cases of oil fields in clastic (sand-shale) environments are discussed where multicomponent seismic data was used to assist in the search for hydrocarbons: the Cambay Basin, India; the Williston Basin (Ross Lake), Saskatchewan; and the Central Plains of Alberta. In addition, two carbonate cases are considered from the Cantarell oil field in Mexico and Lousana Field, Alberta. The ratio of compressional to shear velocity values (Vp/Vs) from travel-time thickness (isochrons) is especially useful for characterizing lithologies.
WAVE INFORMATION
Many current exploration or development targets require increasingly detailed information about the subsurface. Can we remotely determine actual rock type, such as sand versus shale percentages or dolomite versus limestone? Can we improve structural imaging in complex geologies? Can we refine our porosity estimates?
P-wave seismic imaging has been enormously useful in these pursuits; the compressional wave usually arrives loud and clear. But sometimes P-wave information is ambiguous or limited. The P-to-S conversion upon reflection can supply additional information in the form of S-wave (shear wave) properties that can improve our understanding of the subsurface. The S-waves are comparatively “shy”; they arrive later, with lower amplitudes and more subtleties. However, the reward in assessing the P-S waves will include their contribution to rock type determination, fracture state and porosity estimation, and imaging in special situations.
METHODS
In a project that has multicomponent seismic data, we usually first interpret the P-wave data to the fullest extent possible. This involves the classic techniques of geological review of the area, log analysis (assuming we have well information) and editing, synthetic seismogram generation, and correlation of the synthetic seismograms with the surface seismic sections or volumes.
Having VSP data is a welcome bonus. We pick horizons of interest to create time structure maps, determine time-thicknesses between horizons, look for amplitude features and attributes, and perhaps undertake inversions. We seek geological understanding, anomalies and reservoirs.
With multicomponent data, we take logs and construct PS synthetic seismograms. If we don’t have an S-wave log, then we can estimate one using empirical Vp-to-Vs relationships, VSP velocities, a geological model, or a gross PP-to-PS section mapping function. Then, we correlate the PS synthetic seismogram to the PS section (usually in native PS time). In this way, we have a consistent geological model as represented by the well logs. Recall that the basic P-wave section is displayed in the P-wave travel time to reflectors and back to the surface. The P-S section is displayed in P-wave time to the reflectors, but in S-wave time back to the surface. So the PP and PS sections do not immediately tie in their raw, two-way travel times. To correlate the sections or volumes approximately, we might shrink the PS sections in time by some factor (say 1.5 to 4) to see if we can find a compelling match with the PP section.
The Vs model and correlations can now be refined to better register the PS sections with the PP sections. A result of this refined correlation will be a macroscopic Vp/Vs function varying in depth for each surface location. We can output the PS sections in PP time for further horizon correlations and
Vp/Vs extraction. In both PP and PS time, we can assess the PS data for all of the features that we sought in the PP data: time structures, amplitudes, anomalies, etc.
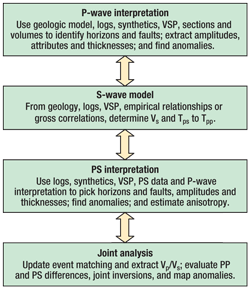
In some cases, the PS data may better resolve or indicate the target. This workflow is shown in Fig. 1. Note that if there is a strong orientation in the rock fabric, fracturing or directional stress, then the S-wave data may be made more rich (complicated) by anisotropy or S-wave splitting. The data in this article is all interpreted isotropically.
 |
|
Fig. 1. The multicomponent seismic workflow includes PP- and PS-wave interpretation plus joint analysis.
|
|
CASE HISTORIES: CLASTICS
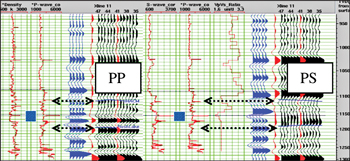
Let’s now apply the multicomponent seismic workflow to several case histories. The first example is from Husky Energy Inc.’s Ross Lake heavy oil field in Saskatchewan, Canada.1 The target is a Lower Cretaceous incised-valley channel sand at about 1,150-m depth. The high-porosity (over 30%) and high-permeability (3 D) sand can be over 90 m thick with a sizeable heavy oil zone. The well logs (from the 11-25 well), synthetic seismograms for both PP and PS, and the proximal seismic sections are shown in Fig. 2. We note the significant increase in Vs as we enter the sandstone reservoir (between the Index Horizon Above the Cantuar Marker, or IHACM, and the Rush Lake horizon). The Vp change is less pronounced and, thus, there is an accompanying drop in the Vp/Vs value. We use these observations to attempt to delineate the sand-rich areas in the clastic environment.
A 3C-3D seismic survey, using a dynamite source and vectorseis recording system, was conducted by Husky and Veritas DGC in summer 2002. Both PP and PS data sets were processed through migration. The arrows in Fig. 2 indicate time horizons (which bound the reservoir) that are picked on both the PP and PS data. The interval between them can be mapped as the time thickness or “isochron” and color coded based on thickness. Thicker areas are interpreted to be the less compactible channel sands.
 |
|
Fig. 2. A compendium of well logs (11-25 well), synthetic seismograms and proximal surface seismic sections for PP and PS waves.2 The reservoir sand interval is indicated by the blue boxes.
|
|
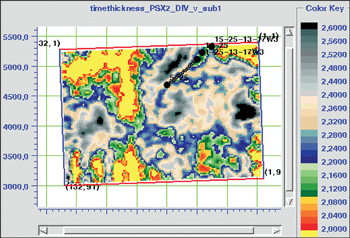
When we take the ratio of the PP and PS time thicknesses around the reservoir, we can calculate the interval Vp/Vs, Fig. 3. Relatively low Vp/Vs values indicate sand development (or more rigid rock). Both the P-wave time thickness and the Vp/Vs map indicate a good sand body stretching southwest to northeast at the top of the map, which has been confirmed by a horizontal well. We also undertook PP and PS amplitude inversions (for impedance) to further identify the reservoir. The ratio of the P and S impedances gives us another indication of the Vp/Vs value. The inversion results outlined a similar area for enhanced sand, as did the time-thickness analysis.
 |
|
Fig. 3. The Vp/Vs value determined from a ratio of the PP and PS time thicknesses (isochrons) surrounding the reservoir. The green area in the upper right has a lower Vp/Vs value and is interpreted as a sand-rich region.
|
|
Across Saskatchewan’s western border in neighboring central Alberta, Encana Corp. has been searching for sand channels in the Lower Cretaceous Mannville group. Conventional 3D seismic data has been successfully used in the area to discover hydrocarbons, but detailed delineation of reservoir sands from non-productive shales is problematic.3
Thus, Encana began 3C-3D seismic exploration, particularly to use the PS wave data to directly sense rock rigidity. A Vp/Vs map, again created from the ratio of PP and PS isochrons around the zone of interest, provided a very good indication of the sand-rich zones. We estimated the thickness of the reservoir region (isopach) by geostatistically integrating the well log horizon depths with their corresponding P-wave isochrons. We also used porosity well logs and numerous PP and PS seismic attributes, analyzed with neural net methods, to estimate the reservoir region’s porosity.
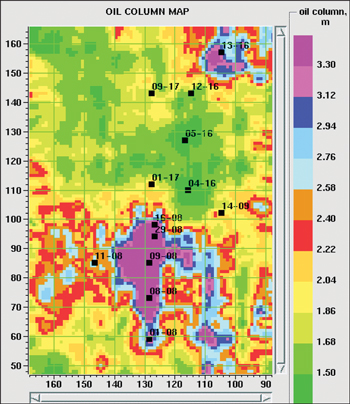
The goal was to combine all this information to create a map of oil volume. By multiplying isopach values by their sand percentages and porosity, we estimated the reservoir pore volume. By multiplying this sand porosity map by the oil saturation, we generated an oil column map.4 Figure 4 shows the estimated oil column map using oil saturation of 75% (an average from the productive-zone well logs). The reservoir area is then multiplied by the oil column map to estimate the oil reserves. With a 550,000-sq-m reservoir area and a 3.3-m average oil thickness, the hydrocarbon reserves are estimated at 11.34 million bbl of oil. This compares to the production engineering estimate of 11.406 million bbl.
 |
|
Fig. 4. This map of estimated oil column height is created by multiplying the sand reservoir thickness, determined from the PP and PS seismic volumes, by porosity and average oil saturation (75%).
|
|
We’ll now move across the Pacific Ocean to another clastic environment—that of the Cambay Basin, Gujurat state in northwest India. The Cambay Basin is an intracratonic rift graben formed during India’s northward tectonic drift after the Cretaceous breakup of Gondwanaland. The basaltic Deccan traps form the floor of the basin and are overlain by Tertiary and Quaternary sandstones, siltstones, claystones, coals and shales, some of which are major oil producers.
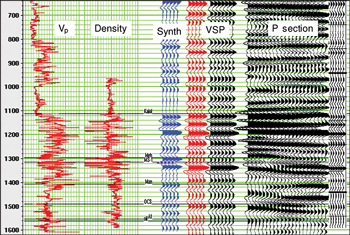
The first multicomponent seismic survey (to my knowledge) conducted in India was undertaken by ONGC and Geofizyka Toruń in the basin,5,6 comprising a number of orthogonal 2D-3C dynamite lines. The targets are thin, lenticular, oil-saturated sand bodies encased in sequences of coals, shales and silts. We first used the well logs to generate synthetic seismograms. Several VSPs were also used in the interpretation. We then correlated the P-wave data as shown in Fig. 5. Similarly, with a dipole sonic log, we generated PS synthetic seismograms and correlated them with the PS surface data. Using the correlations at specific wells, we tied all of the 2D lines into a consistent set of horizons.
 |
|
Fig. 5. Logs, PP synthetic seismograms, VSP and PP surface seismic from the Cambay Basin, India.
|
|
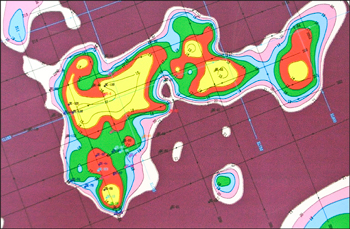
Then, from the picked horizons in the zones of interest, we generated time thicknesses. From the ratio of the PP and PS thicknesses, we generated the Vp/Vs map (Fig. 6), interpreted as an indicator of sand enrichment. The map can be used with other data to assist in further developing prospects in the area.
 |
|
Fig. 6. The Vp/Vs map as inferred from a number of 2D multicomponent seismic lines. The yellow and red areas show regions of low Vp/Vs, which are interpreted to be sand-rich.
|
|
CASE HISTORIES: CARBONATES
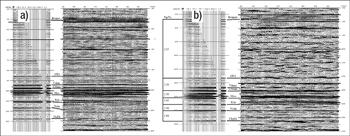
The first of the carbonate case histories concerns a dolomitic reservoir in the Late Devonian Nisku Formation of the Lousana oil field, Alberta, Canada. The reservoir is separated from the main carbonate platform to the east by an anhydrite basin.7 The problem here is to delineate the porous reservoir dolomite from the tight basinal anhydrite. Measurements on dolomite indicate that it has a somewhat lower Vp/Vs value than anhydrite and limestone.8 Again, we used PP (Fig. 7a) and PS synthetic seismograms to correlate the sections. In the Lousana case, we had no S-wave velocity information (outside of the values determined from surface seismic processing). Instead, we used different Vs values until we could match the character of the synthetic seismograms to the PS seismic data, Fig. 7b.
 |
|
Fig. 7. a) The P-wave synthetic seismogram and correlation with a surface seismic section from Lousana, Alberta. b) The converted-wave (PS) synthetic seismogram and correlation with a PS surface seismic section.
|
|
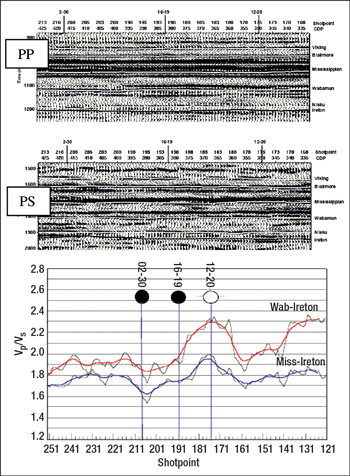
Then, we again used time-thickness (isochron) ratios to find the Vp/Vs values across the reservoir interval, Fig. 8. The higher Vp/Vs values correspond to anhydrite regions, while the lower Vp/Vs values are associated with dolomite buildup.
 |
|
Fig. 8. PP and PS seismic sections with interpreted horizons.9 The lower Vp/Vs values represent dolomitic regions.
|
|
The final case history is from one of the world’s largest offshore oil reservoirs: Cantarell Field in the Gulf of Mexico. The region has a complicated tectonic history, including major compressional and extensional episodes and the Chicxulub meteorite impact event. The reservoirs are mainly carbonate rocks: Upper Cretaceous breccias and Kimmeridgian shallow, dolomitized, ramp facies. A large 3D ocean-bottom seismometer (4C) survey was undertaken to refine the interpretation of the Akal reservoir and search for new targets.10
Chernikoff discusses the interpretation of the PP and PS data volumes.11 The process included assessing well logs, constructing Vs values, generating PP and PS synthetic seismograms, correlating VSP information and, finally, tying these results to the seismic volumes.
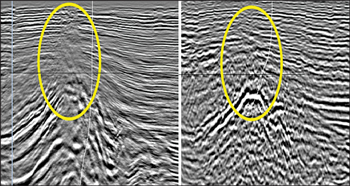
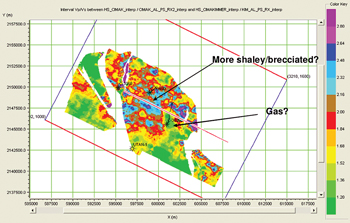
In Fig. 9, we interpret the smeared PP section above the anticlinal structure (the Akal reservoir) as resulting from a “gas cloud” or gas-saturated sedimentary column. The PS image, while of lower frequency, gives a continuous top to the reservoir. We created PP and PS time structure maps for two important horizons: the tops of the allochthonous Cretaceous and Kimmeridgian. We then found the PP and PS time thicknesses and took their ratio. The resultant map (Fig. 10) shows the effects of higher shale content and possible gas saturation.
 |
|
Fig. 9. PP and PS sections over the Akal anticlinal structure.11 Note the washed-out area (circled) on the P-wave section over the poorly defined anticlinal peak. The top of the Cretaceous is more definitive on the PS section. This is the classic signature of a “gas chimney.”
|
|
 |
|
Fig. 10. The interval Vp/Vs map between the Cretaceous and Kimmeridgian horizons in Cantarell Field, Mexico.
|
|
CONCLUSION
Multicomponent seismic data can assist in delineating clastic and carbonate reservoirs. PP and PS images (loud plus shy waves) can be interpreted jointly in structural and stratigraphic terms. Vp/Vs values computed from time-thickness ratios have proved useful in estimating rock type as well as delineating reservoirs in the five cases presented. 
ACKNOWLEDGMENTS
I am grateful to the Consortium for Research in Elastic Wave Exploration Seismology (CREWES) and its sponsors at the University of Calgary for their support and their commitment to advanced seismic methods. Thanks are also due to Pemex and Schlumberger, especially Alberto Chernikoff, for the opportunity to work with the Sihil data. My appreciation also goes to Geofizyka Toruń and ONGC for the Cambay Basin data. Husky Energy Inc. generously supported the work at Ross Lake, Saskatchewan.
LITERATURE CITED
1 Stewart, R. R., Xu, C. and N. Soubotcheva, “Exploring for sand reservoirs using multicomponent seismic analysis,” Journal of Seismic Exploration, 15, No. 2, 2007, pp. 1–25.
2 Xu, C. D. and R. R. Stewart, “Delineating a sand channel using 3C-3D seismic data: Ross Lake heavy oilfield, Saskatchewan,” CSEG Recorder, 3, September 2006, pp. 35–40.
3 Pendrel, J. et al., “Estimation and interpretation of P and S impedance volumes from simultaneous inversion of P-wave offset seismic data,” presented at the 70th Annual International Meeting, Society of Exploration Geophysicists (SEG), Calgary, Aug. 6–11, 2000, SEG Expanded Abstracts, pp. 146–149.
4 Todorov, T. I., Integration of 3C-3D Seismic Data and Well Logs for Rock Property Estimation, MSc thesis, University of Calgary, 2000.
5 Zabik, G. and M. W. Podolak, “Land 3C-2D seismic data processing: Analysis of crucial issues,” presented at the 6th International Oil Exploration Conference, Society of Petroleum Geophysicists, Kolkata, India, Jan. 9–11, 2006.
6 Lukaszewski, M., Piatek, J. and A. Przybylo, “Multicomponent seismic data interpretation cycle,” presented at the 6th International Oil Exploration Conference, Society of Petroleum Geophysicists, Kolkata, India, Jan. 9–11, 2006.
7 Miller, S. L. M., Multicomponent Seismic Data Interpretation, MSc thesis, University of Calgary, 1996.
8 Rafavich, F., Kendall, C. H. St. C. and T. P. Todd, “The relationship between acoustic properties and the petrographic character of carbonate rocks,” Geophysics, 49, 1984, pp. 1622–1636.
9 Miller, S. L. M., Lawton, D. C. and R. R. Stewart, “Interpretation and modeling of P-P and P-S seismic data from Lousana, Alberta,” CREWES Research Report, 7, No. 22, 1995, pp. 1–10.
10 Vazquez, M. G. et al., “Improved Sihil image from 4C full azimuth node data,” presented at the 75th Annual International Meeting, SEG, Houston, Nov. 6–9, 2005, SEG Expanded Abstracts, pp. 983–986.
11 Chernikoff, A., García, J., Stewart, R. and R. Xu, “Interpretation of multicomponent Sihil 3D-4C seismic survey: What have we learned?” presented at the 2nd International Oil Conference and Exhibition in Mexico, Veracruz, Mexico, June 28–30, 2007.
|
THE AUTHORS
|
 |
Robert R. Stewart is a professor of geophysics at the University of Houston, holds the Cullen Chair in exploration geophysics and is Director of the Allied Geophysical Lab. He is also President of Gennix Technology Corp., a geophysical consulting company. Stewart graduated from the University of Toronto with a BSc degree in physics and mathematics and completed a PhD degree in geophysics at MIT. He has been employed by Chevron, Arco Exploration and Production Research Centre, Veritas Software Ltd. and as a professor of geophysics at the University of Calgary, where he co-founded the CREWES project.
|
|


