Projects offshore Greenland and Brazil benefited from improved depth imaging.
Tracy Campbell, WesternGeco
The oil and gas industry has long recognized the validity of identifying subsurface features with electromagnetic (EM) tools that measure contrasts in resistivity. Recent advances in two related methods of measuring resistivity have enabled these EM tools to better complement each other and, in the process, expand an explorationist’s knowledge of the target geology, reducing pre-drill risk.
This convergence of magnetotellurics (MT) and controlled-source electromagnetics (CSEM) amounts to what could be called “electromagnetic sounding.” It holds particular promise for high-grading prospects in underexplored offshore basins, where both costs and drilling risks are high.
Recent projects completed in sparsely explored areas offshore Greenland and Brazil demonstrated the value of using marine MT (MMT) and CSEM to gain pre-drill geologic knowledge and limit risk exposure.
MMT OVERVIEW
When it comes to exploration-related marine MT, the useful spectrum of the earth’s natural EM field ranges from about 0.001 Hz to 10 kHz. However, frequencies above 1 Hz are greatly attenuated by conductive seawater, eliminating the possibility of a subsea earth response in the higher frequencies and, thus, making this the upper limit for marine magnetotellurics.
While a rock’s solid matrix generally does a poor job of conducting electricity, the various saturating fluids held within the matrix differ in conductivity. When EM waves interact with formations that are conductive, they create a time-varying response wave that propagates back to the surface. This EM signal induces a current loop, or eddy current, in the conducting layer, whose properties depend on the conducting formation’s resistivity and the source signal’s magnitude and frequency. The eddy current induces a magnetic field that propagates from the formation and can be measured by surface sensors.
The sensitivity of MMT fields to large conductive features makes them useful in studying large salt, basalt and carbonate bodies, thanks to their high resistivity contrasts with conductive surroundings. But as MMT fields attenuate more with depth, they become insensitive to resistivity contrasts of thin formations. Because MMT measurements are not sensitive to thin resistive layers, they are not suitable for evaluating potential hydrocarbon-bearing formations. The limited resolution of MMT data necessitates the use of seismic, gravity or well log data in combination with MMT to help constrain subsequent modeling through inversion.
Just such an integrated approach—involving MMT, gravity and wide-azimuth seismic data—in the Gulf of Mexico has yielded a 3D model with an improved interpretation of the base of salt compared with seismic alone, a difference in interpretation of almost 3,000 m in some areas. MMT resolution is limited to about 5–10% of its burial depth and should have a fairly large resistivity contrast with surrounding rock. It was these limitations that led to the development of the CSEM technique.
CSEM METHOD
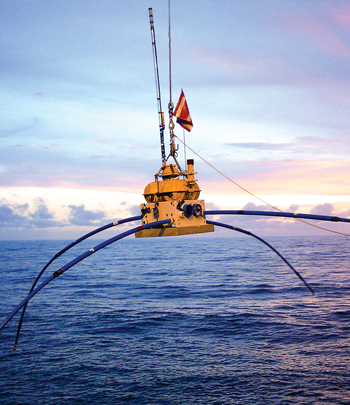
The CSEM method focuses on measuring and interpreting the response from a controlled source during a survey. Since MMT and CSEM use the same receivers (Fig. 1), MMT data is recorded with CSEM simultaneously when the source is either turned off or in a distant part of the survey area. After processing and interpretation, the MMT data then serves as a background model for CSEM interpretation or inversion.
 |
|
Fig. 1. CSEM receiver deployment.
|
|
Typically, a marine CSEM transmitter source is a long, horizontal dipole comprising two neutrally buoyant antenna cables, each ending in an electrode. The electrodes are pulled through the water behind a streamlined sensor platform, or towfish, 50-100 m above the seabed at 1.5–2.0 knots. The towfish receives a low-current, high-voltage signal from the vessel towing it. Transformers within the towfish convert that signal to a high-current, low-voltage signal. The towfish then generates a designed waveform that is transmitted to the vessel and monitored and recorded onboard.
The signal decays rapidly with distance, a phenomenon dubbed the skin effect. The typical distance for penetration of the signal into the conductor is termed skin depth. High frequencies attenuate more rapidly than low frequencies.
Detecting thin formations requires higher-frequency components than are available with MMT. Also, the coupling between the natural MMT source and the earth is not good for detecting thin resistors. The deeper a target structure is buried, the bigger it must be to be detected via MMT alone.
With CSEM, both the coupling and the frequency may be controlled so the CSEM signal is optimized to find resistive layers (possible hydrocarbon-bearing formations) in a conducting background (water-bearing formations).
The source signal can take three paths. First, when the source-receiver offset is short, the direct path through the water dominates the signal. The signal strength degrades quickly with distance.
Second, when the EM field travels to the water surface, it encounters highly resistive air, forcing the propagated wave to follow the air-water interface with little attenuation. The signal’s third portion travels through the subsurface, where the propagated waves interact with the underlying geology and generate a response field. This response signal shows up at seafloor receivers at offset distances greater than the reservoir depth. The reservoir’s presence enhances the received signal in comparison with a uniform subsurface that lacks resistive layers.
Geoscientists can identify such resistivity anomalies and thus infer geologic information by comparing the observed data with predicted models or numerically via inversion. The source, receiver and environmental information can be incorporated into a pre-survey analysis to determine whether a resistive target can be detected at a certain depth. Especially when log and seismic data provide a starting model that helps constrain the inversion, CSEM inversion is a powerful tool to help geoscientists ascertain more useful information from observed data.
GREENLAND CASE STUDY
A 2008 case study involving the use of 3D CSEM inversion to derisk prospects off Greenland demonstrates the efficacy of an integrated approach with CSEM.
A group led by Encana Corporation had sought a better way to high-grade prospects in an area offshore western Greenland. The group had mapped exploration prospects on two blocks in 350–1,800 m of water and wanted to choose the best drilling candidates armed with only mapped closures and the nearest well control 120 km away.
Encana commissioned CSEM surveys over the two blocks to resolve questions over the prospectivity of Cretaceous reservoirs at 3,000 m below the seabed. Prior to the survey, extensive 3D modeling was conducted over each prospect, using forward modeling and synthetic data inversion to optimize the survey design.
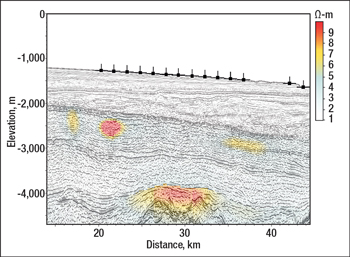
In 3D CSEM inversion, Maxwell’s equations are used to model the earth response, and the starting model is modified iteratively to produce a final model of an electrical and magnetic field response that best fits field observations. By incorporating seismic interpretations and well log data (Fig. 2), it was possible to create 3D anisotropic electrical models as a starting point for the 3D inversion.
 |
|
Fig. 2. Greenland CSEM results integrated with seismic data. Seismic images courtesy of TGS.
|
|
Developing integrated interpretations of the geologic, gravity, magnetic and seismic data yielded inversion volumes from the EM data sets that coincided with seismic volumes for each prospect. Prospects that showed high resistivity at the target level were tested to validate their inversion results. Subsequent inversions were used to test the effects of reasonable geologic variations to the starting model. The inversion results and interpretations were further validated, and each resistivity anomaly was evaluated according to its fit with geology and interpretational consistency to adjust the chance of success for each target.
This methodology enabled the clear delineation of resistive bodies on eight of the 14 prospects in the two blocks, and a highly resistive response for four out of eight prospects on one of the blocks. CSEM inversion results showed that one prospect had all the characteristics consistent with an interpretation of an oil-filled reservoir. Prior to the CSEM interpretation, the probability of a hydrocarbon charge within that target area was deemed to be no greater than 50%. The prospect was subsequently assigned a higher priority in the portfolio.
Conversely, another prospect tagged with a nominal 50% probability of hydrocarbon charge before the CSEM survey showed no sign of a resistive anomaly, and its priority ranking was lowered.
Subsequently, the Encana-led group has experienced significant progress in high-grading its prospects using CSEM inversions constrained by seismic.
BRAZIL CASE STUDY
Other underexplored offshore basins have benefited from the improvement in depth imaging that MMT and CSEM have provided.
In an effort to expand the integration of marine CSEM with other geophysical methods, in 2009 a basin study was launched in the deepwater Potiguar Basin off Brazil. While the basin is prolific onshore and has production in shallow waters, the deepwater Potiguar Basin has seen no production and little exploration.
Typically, CSEM is applied as a tool to evaluate prospects where the position and the depth of the target are known or likely. In the case of the Potiguar Basin study, the method was employed at a different exploration workflow stage. It was applied together with other exploration methods to expand the knowledge of the geology of an underexplored basin.
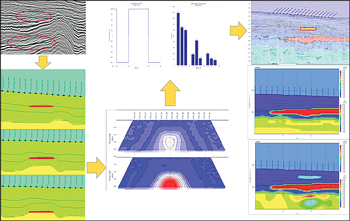
Initially, an existing 2D seismic data set underwent prestack depth migration using new tools for noise attenuation and multiple removal. The data set was interpreted to generate regional scale horizons and to provide input, along with other geological and geochemical data, for a basinwide model of the petroleum system. In addition, satellite images were processed to produce a map of sea-surface oil slicks, which, along with seismic features, was used to pinpoint targets for CSEM acquisition. The next step was to perform 1D modeling to determine which features could be detected using CSEM. Twelve targets were prioritized according to seismic characteristics, level of complexity for CSEM interpretation and areal distribution within the basin. Consequent 2.5D and 3D modeling was brought into play to investigate more complex targets, Fig. 3.
 |
|
Fig. 3. Brazil CSEM feasibility study workflow.
|
|
During the CSEM survey design, a hybrid approach was implemented between 2D and 3D layouts to cover as many targets as possible cost-effectively without losing the 3D illumination ideal for gaining information about anisotropy and delineation of target extent.
Five data sets were acquired in the deepwater Potiguar Basin, each followed by an interpretation workflow that included: normalizing observed data according to synthetic background model responses to assess data quality and indicate main data trends; undertaking 1D anisotropic inversions, constraining thickness with seismic horizons to extract horizontal and vertical background resistivities; upscaling to 2D and 3D resistivity volumes; and performing forward modeling to assess the validity of the background model against observed data.
The workflow also included conducting 2.5D anisotropic inversions. The term 2.5D signifies that the EM field is modeled in 3D but assuming a 2D geology; i.e., the resistivity is presumed to be invariant orthogonal to the source towing direction. Also part of the workflow was implementation of 3D anisotropic inversions (including inline and broadside data) and integration of seismic and other data with seismic-to-simulation software.
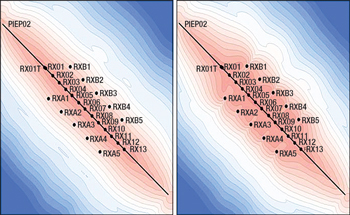
Each 3D inversion entailed using multiple frequencies to enhance inversion sensitivity and thus increase resolution, Fig. 4. The higher frequencies—sensitive to the shallower part of the model—helped resolve the resistivity distribution in the overburden, thus helping to better define shallow features. Synthetic studies, in addition to analysis of observed data with known target depths, confirmed that the inversion of data including multiple frequencies with regard to a single frequency provided much better depth resolution even without other constraints.
 |
|
Fig. 4. Modeled 3D inversion cumulative sensitivity: inline data only (left), inline and broadside data (right). Red colors correspond to higher sensitivity.
|
|
The study showed that integrating resistivity volumes obtained through 3D anisotropic inversions of the five CSEM data sets enhanced understanding of the earth model. Consequently, using this added value could allow further interpretation of the seismic data to characterize features not previously defined.
In addition, such information could be used in a workflow with other exploration tools simultaneously or iteratively to better understand a sedimentary basin.
CONCLUSIONS
Integrating EM survey data—whether MMT or CSEM—with geologic, seismic and other geophysical data offers tremendous potential for reducing dry hole risk in underexplored offshore areas. As the method moves into the mainstream, it is attracting more research and development funding. The focus of this funding includes improvements in hardware, but the step-change in technology will come from investment in software in the form of inversion algorithms and interpretation tools.
As this new approach to “electromagnetic sounding” is further validated commercially, more technology advances and a wider range of applications will follow the initially impressive results from these tools. 
ACKNOWLEDGMENTS
The author thanks Encana for allowing publication of the Greenland data and Andrea Lovatini of WesternGeco for his contribution to the article.
|
THE AUTHORS
|
 |
Tracy Campbell is the WesternGeco Electromagnetic (EM) Marketing and Sales Manager based in Gatwick, UK. He joined Schlumberger in 2004 with the acquisition of AOA Geomarine Operations (AGO). Since then, he has been WesternGeco EM Data Processing Manager in Austin, Texas, WesternGeco EM North America Sales Manager in Houston, WesternGeco EM Global Projects Manager in Houston and WesternGeco Business Development Manager in the international multiclient group. Mr. Campbell received a BS degree in physics from the University of Alberta, Edmonton, Canada.
|
|


