New EM technology uses vertical rather than horizontal electrical lines
Using a vertical dipole source and vertical receivers should increase horizontal resolution of anomalous resistors in offshore EM exploration.
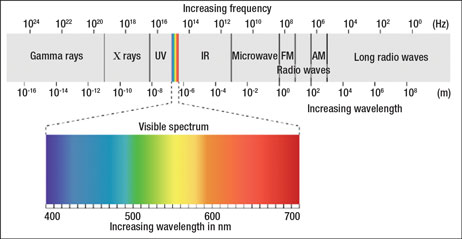
Using a vertical dipole source and vertical receivers should increase horizontal resolution of anomalous resistors in offshore EM exploration.Jon-Mattis Børven, PetroMarker AS, Stavanger, Norway; and Eirik Grude Flekkøy*, Department of Physics, University of Oslo, Norway The last 20 years have seen rapid development of electromagnetic techniques for hydrocarbon exploration, largely based on horizontal source and receiver technology. Recently, however, a vertical alternative has been explored that is based on transient rather than oscillatory signals, with vertical sources and receivers. In many circumstances of practical importance, this vertical approach may provide better resolution of hydrocarbon reservoirs. Field experience to date is encouraging. BACKGROUND ElectroMagnetic (EM) radiation is a self-propagating wave with electric and magnetic components. These components oscillate at right angles to each other and to the direction of propagation. Electromagnetic radiation can be divided into categories according to the frequency of the wave. In order of increasing frequency, these categories include radio waves, microwaves, infrared radiation, visible light, ultraviolet radiation, X-rays and gamma rays. The EM methods used in geophysical exploration operate at very low frequencies, corresponding to the very far right of Fig. 1.
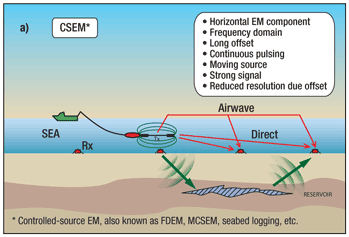
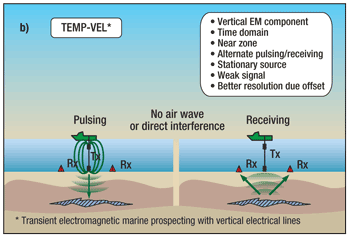
EM methods used for geophysical studies commonly seek to identify variations in electrical conductivity of the shallow earth (upper few kilometers). In a sedimentary basin, because hydrocarbon-bearing rocks are known to show increased electrical resistivity relative to water-bearing rocks, the areas that appear highly resistive may indicate the presence of hydrocarbons. EM methods for geophysical applications belong to the family of geo-electrical methods, which can be subdivided into active and passive methods according to the nature of the EM source signals. Active methods include Direct Current (DC) resistivity, Induced Polarization (IP) and Controlled Source ElectroMagnetic (CSEM) methods. In the DC method, a direct current signal is driven into the ground, and the resulting potentials created in the earth are measured. From the measurements, the electrical properties of the earth in the earth volume between the source and receiver can be obtained. The IP method is an extension of the DC method that makes an additional measurement of the ability of the ground to store electrical charge and how this charge decays when the source is turned off. CSEM, SeaBed Logging (SBL) and Remote Reservoir Resistivity Mapping use manmade sources to investigate the variation of electrical conductivity in the earth. Depending on the application, the depth range of investigation varies from tens of meters to several kilometers. The MagnetoTelluric (MT) method is a passive geo-electrical method that uses naturally occurring currents in the ionosphere as the source field to probe the earth. Since the MT source signal is confined to much lower frequencies than CSEM, this method is considered to be a lower-resolution tool compared to the other geo-electric methods. The focus is on an active method: a new vertical-based time-domain EM exploration method that the authors’ company calls Transient ElectroMagnetic Prospecting with Vertical Electrical Lines (TEMP-VEL). EM METHODS FOR HYDROCARBON EXPLORATION The marine CSEM method for subsurface investigations was developed nearly 30 years ago,1 and it has found extensive application within the offshore hydrocarbon exploration industry over the past eight years (e.g., Constable, 2006).2 Compared to the immensely dominating methods of seismic, most of the various EM techniques in the market were introduced commercially at the beginning of the 21st century and are still in rapid development. All of these methods detect contrasts in electrical conductivity, exploiting the fact that the electrical conductivity of hydrocarbon-saturated reservoirs is significantly smaller than in the surrounding sediments, which are saturated with salt water. The contrast is typically a factor 10−100. Seismic methods mainly provide structural information, and the information about the fluid content of a prospect is often very sparse. On the other hand, EM methods may provide a direct pre-drilling discrimination of whether a prospect contains hydrocarbons or not. This makes EM methods complementary to seismic, and contributes to reducing the risk of drilling dry holes and thereby reducing exploration cost. Even though CSEM originally was a generic term covering all EM methods that use manmade sources for exploration of the electrical properties of the earth, the term has become widely known as a synonym for frequency-domain EM methods. In particular, the term is used to describe the Sea Bed Logging method3 offered by ElectroMagnetic GeoServices (EMGS) and similar methods such as the methods offered by Offshore Hydrocarbon Mapping (OHM) and WesternGeco Electromagnetics. However, the time-domain Multi-Transient EM (MTEM) method owned by Petroleum Geo-Services (PGS) and the TEMP-VEL method described here are, strictly speaking, also CSEM methods. Although somewhat inaccurate, we will here use the term CSEM, as it is currently used in the industry, to represent SBL-type frequency-domain EM methods. HOW THE NEW VERTICAL METHOD WORKS There are now several EM exploration techniques available in the market. The SeaBed Logging (SBL) method, shown in Fig. 2a, is the most common example, and, for the last decade, SBL and similar methods have been used extensively for hydrocarbon exploration worldwide. These methods operate in the frequency domain, and use Horizontal Electric Dipole (HED) sources that transmit a low-frequency EM signal containing several frequency components. The source is towed over arrays of horizontal dipole receivers located on the seabed, while the transmitted signal diffuses outward both into the overlying water column and into the seabed. The transmitted electric field enters the highly resistive hydrocarbon layer and is guided along the layer, while EM energy constantly leaks from the layer and back to the seabed. Receivers located at a suitable offset (distance between transmitter and receiver) range record the amplitude and phase of the horizontal electric field components. The appropriate offset range is typically 6−10 km. The new vertical EM exploration method has been developed over the past few years by PetroMarker. The company was founded in 2005 specifically with the new method in mind, which has been in commercial use for hydrocarbon exploration since 2007. The method has been verified on known fields, as well as employed to test prospects, some of which will be drilled this fall. The method operates in the time domain and uses stationary Vertical Electric Dipole (VED) sources that transmit a transient electromagnetic signal. When the source is turned on (Fig. 2b, left side), a DC field diffuses outward both into the seawater and into the subsurface. After a while, the source is turned off, inducing a secondary electromagnetic field that diffuses from the subsurface and back to the receivers (Fig. 2b, right side), which record the vertical electric field component. The receivers are located at an offset range suitable for the method, typically 500−1,500 m.
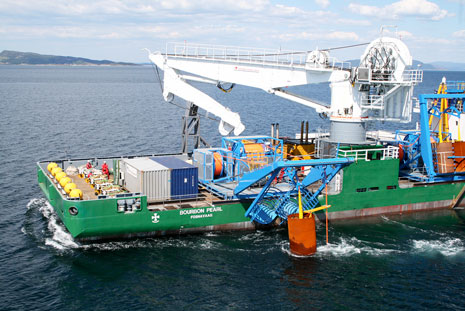
Spatial resolution. The short offsets used by the new vertical method to obtain contrasting measurements above corresponding hydrocarbon-filled and water-filled structures are possible because it is a transient method. The receivers record the induced-EM response from the subsurface when the source is turned off, as opposed to CSEM methods, which transmit and record simultaneously. At short offsets, CSEM measurements are contaminated by the so-called “direct wave,” which is EM energy that diffuses directly to the receivers through the seawater without entering the subsurface. The new method records the direct wave decay in the initial part of the response, while the subsurface induction signals reach the receivers at later times. Since CSEM methods use oscillating signals, they will penetrate a certain distance, or skin depth, in a given medium, according to the EM diffusion constant (or diffusivity) of the medium. The diffusivity is inversely proportional to the electrical conductivity of the medium, so that the penetration length is larger for the more resistive sediments than for the conductive seawater. Therefore the subsurface signals used to obtain a contrast between CSEM measurements will dominate beyond a certain offset, which is typically 2−5 times the depth from the seabed to the reservoir.3,4 In fact, in the absence of induced polarization effects,5,6 the offset used in the new vertical method could be zero. The fact that polarization effects exist but fall off quickly with offset leads to the typical minimum offset indicated above. The weak signal levels due to the rapid decay with time of the vertical electrical field component (Ez ~ t-5/2)—and typically recorded at long offsets—limits the practical maximum offsets. Such offsets are usually smaller than, or of the same order as, the depth to the target. The limited offsets give the new vertical method improved spatial resolution over long-offset CSEM methods, since the signal is affected by a smaller underground volume. The underground volume that is influenced by the transmitted EM field is roughly a half-sphere. A fixed-offset transmitter-receiver system, with the transmitter located in the center of the half-sphere, is mainly influenced by the part of the EM field that is directly below the system. A horizontal displacement of the transmitter-receiver system over a distance equal to the target depth will make a large difference in the measurements of the new vertical method, because the underground volume that influences the measurements changes significantly. A corresponding displacement for CSEM methods results in a much smaller change in the measurement, because the offsets are longer. The potential to resolve targets of a small horizontal extent is therefore greater with the new vertical technology. The airwave. The so-called “airwave,” which is EM energy traveling up through the water, through the air and back down to the seabed where it is recorded by the receiver, is another common problem for CSEM methods. The airwave is present in the CSEM measurements at all offsets, and it dominates the measurements at longer offsets than around 10 km. Advanced processing is applied to reduce the influence of the airwave in CSEM data. Conversely, for the vertical method, the airwave is a virtually nonexistent problem. During transmission of the EM field, the airwave exists, but, when the transmitter is turned off, the airwave disappears within microseconds and is therefore not a problem for the vertical method. Signal-to-noise ratio. A challenge common to all EM technologies is to obtain a sufficient signal-to-noise ratio. While the new vertical method requires the measurements of weaker fields (in some cases, below 10 nV in the averaged signal), the method benefits from stationary transmitters and the screening of atmospheric noise. The latter is a result of the boundary condition at the sea-air interface, which prevents currents from passing through the sea surface to the nonconductive air. For this reason, atmospheric noise in the vertical EM field component, like that due to solar wind or Schumann resonances, will not pass to the sea. Such noise is therefore absent in vertical-based measurements. Practical measurements in both horizontal and vertical techniques typically span four orders of magnitude from the strong initial signal to the late (or distant) signal, where noise dominates the measurements. Source technology. One of the drawbacks of the vertical method is the intrinsic small amplitude of the vertical EM field component compared to the amplitude of the horizontal component. At late times (typically > 1 s after the source is turned off), the horizontal response from a purely horizontal dipole is 2−3 orders of magnitude stronger than the vertical response from a vertical dipole.7 In order to meet this challenge, PetroMarker has developed a powerful source technology. Each system has a capacity of 2,500 A, and consists of the pulse generator and a VED antenna. The antenna consists of two large electrodes connected to the vessel by heavy cables, Fig. 3.
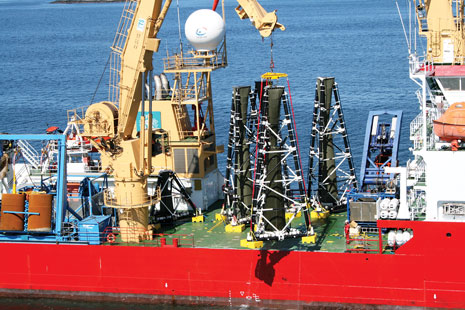
The EM field is generated by sending a DC current through the lower electrode, which sits on the seabed during signal transmission, through the conductive seawater and back to the upper electrode. This electrode is lowered 30−50 m below the sea surface to minimize the influence on the EM field of the conductive hull of the survey vessel, while maximizing the transmitter dipole moment (the product of output current and the distance between the dipole electrodes), which is directly proportional to the strength of the transmitted EM field. The pulse generator systems can be pooled to obtain higher output current. For the time being, two such systems are used together, giving a total output of 5,000 A. The source dipole transmits a square pulse signal, and the pulses are separated by silent periods (pauses/response periods) in which the induced response from the underground is measured. The source signal consists of a series of pulses, each with a typical duration of 2−8 s, with polarities that alternate in a predetermined pattern. The time series of corresponding pulses and responses are averaged according to the polarities of the pulses. The averaging procedure, known as “stacking,” removes any DC components of external noise and, in fact, the pulse sequence is designed to also remove the linear and quadratic in-time external noise. In addition to stacking, the data are averaged in bins of sizes that increase exponentially with time, so that the averaging is more extensive for the weak signal at late times of the response when the noise becomes more significant.8 Historically, keeping sources and receivers sufficiently vertical has been an issue for this technology, because tilted sources and receivers can heavily distort the data. A vertical transmitter is obtained by using Ultra-Short BaseLine (USBL) acoustic positioning. A transponder is attached to the lower pulse electrode, and its position is measured by averaging positional data from the transponder. The upper pulse electrode is also equipped with a transponder, which is used to position the vessel directly above the stationary lower electrode, such that verticality is achieved. Receiver technology. Keeping the receivers vertical has also been a challenge. The strength of the recorded signal roughly depends linearly on the length of the receiver dipole antenna, such that a long antenna gives a strong recorded signal. However, a long antenna is also subject to oscillatory electrical noise and tilt when exposed to a strong sea current. These challenges have motivated the design of a tripod-shaped receiver, Fig. 4. This receiver consists of a rigid composite structure with a tube of canvas shielding the receiver antenna from the sea current. The verticality of the receiver antenna is achieved to within 0.1° through the action of gravity, even if the tripod structure is tilted.
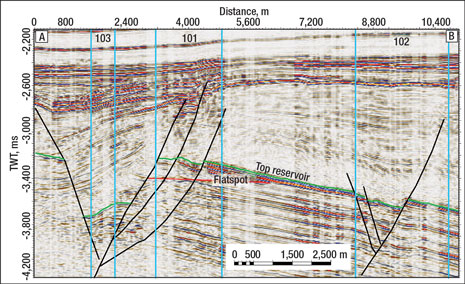
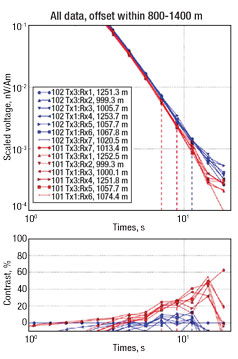
The tripod receivers have dipole antenna lengths of 10−20 m. Each tripod receiver consists of a top unit with electrodes and a bottom unit with low-noise electronics (recording unit, data storage, batteries and bottom electrodes), in addition to the rigid tripod structure with dead weights on each of its three legs. The portable transmitter antenna is positioned at various offsets to the receivers, where it is stationary while pulsing. The tripods have no physical connection to the sea surface, so data is downloaded after recovery of the tripod, or downloaded subsea by attaching an ROV to the tripod base. The downloaded data is properly quality controlled onboard the vessel before transmittal to the onshore geophysics and geology center, where the data are analyzed and interpreted. CASE STUDY During late summer 2008, the new vertical method was used for a survey of the Luva gas discovery in the Norwegian Sea by Discover Petroleum AS, in collaboration with StatoilHydro and Royal Dutch Shell.9 This challenging field was deliberately chosen for a proof-of-concept survey because it has low-resistivity contrast between the hydrocarbon-filled reservoir and the overlying shales. Instead of acquiring data using a conventional line-survey strategy, data from three different areas were collected, Fig. 5. One of the locations was above the center of the hydrocarbon accumulation (area 101), and two locations were in the water zone outside the accumulation (areas 102 and 103). In areas 101 and 102, a group of seven receivers, positioned in a predefined pattern, gave rise to data with offsets in the range of 500−1,250 m, using three different transmitter positions. In area 103, two receivers were located next to each other at 750-m offsets, using one single transmitter position. It was later discovered that area 102 was located in the proximity of a nearby prospect.
Figure 6 shows the comparison of ensemble-averaged response curves from above the hydrocarbon accumulation (red curves) and the water-filled part of the reservoir (blue curves). A clear signature of hydrocarbons appears already in the ensemble-averaged data, with a contrast of 30−50% between data from above the hydrocarbon-filled and the water-filled parts of the reservoir. This is an important result, as the Luva discovery has a fairly weak resistivity contrast between the overlying shales (1−7 Ωm) and the hydrocarbon accumulation (~ 20 Ωm). It is evident that the new vertical method is sensitive enough to identify targets with low resistivity contrasts, such as Luva.
In an earlier test, the high-contrast reservoir at Troll Field was clearly detected using this technology in 2007, in spite of the fact that the noise level of the receiver technology then used was improved by more than one order of magnitude a year later in 2008. CONCLUSION This new EM method is a time-domain marine EM exploration tool that uses vertical sources and receivers. The use of the vertical component of the EM field enables improved horizontal resolution compared to conventional EM methods, which are based on horizontal sources and receivers. This vertical component is also sensitive to deep resistive layers. Because the method operates in the time domain and is vertically based, it avoids interferences by atmospheric noise, the direct wave and the airwave in the underground response.
ACKNOWLEDGMENT The authors thank Erik Mårten Blixt and Discover Petroleum for their permission to use Figs. 5 and 6. LITERATURE CITED 1 Cox, C. S., “On the electrical conductivity of the oceanic lithosphere,” in Physics of the Earth and Planetary Interiors, Vol. 25, 1981, pp. 196−201. * Mr. Flekkøy now works primarily with PetroMarker, and with the University of Oslo, Norway, part-time.
|
|||||||||||||||||||||||||||||
- Quantum computing and subsurface prediction (January 2024)
- Machine learning-assisted induced seismicity characterization of the Ellenburger formation, Midland basin (August 2023)
- What's new in exploration (March 2023)
- Seismic and its contribution to the energy transition (January 2023)
- What's New in Exploration: Rocks can save or kill the planet (July 2022)
- Processing of a large offshore 3DVSP DAS survey in a producing well (June 2022)
- Applying ultra-deep LWD resistivity technology successfully in a SAGD operation (May 2019)
- Adoption of wireless intelligent completions advances (May 2019)
- Majors double down as takeaway crunch eases (April 2019)
- What’s new in well logging and formation evaluation (April 2019)
- Qualification of a 20,000-psi subsea BOP: A collaborative approach (February 2019)
- ConocoPhillips’ Greg Leveille sees rapid trajectory of technical advancement continuing (February 2019)

