Supervised automated lidar mapping of Khuff Formation carbonate outcrops in Oman enabled estimation of heterogeneity related to rock-type partitioning.
Erwin W. Adams, Shell; Jerome A. Bellian* and Reuben Reyes, University of Texas at Austin
Carbonate formations in the Middle East of Permian-Triassic age, often collectively called the Khuff Formation, are among the region’s most prolific reservoirs. The best-known example is the world’s largest gas field, the South Pars and North Dome gas condensate field in the Persian Gulf, which is estimated to have over 1,300 Tcf of gas initially in place.1 On a field scale, Khuff-type carbonate strata are strongly layered and can be correlated over distances more than 10 km. Nevertheless, within the layers, significant reservoir property partitioning is present.
Intricate property partitioning is common in carbonate fields because, in addition to sedimentary processes, biological and chemical processes play an important role in shaping the initial depositional heterogeneity. Diagenetic processes, which are commonly the major control on reservoir quality, introduce another level of complexity by destroying or enhancing the primary depositional porosity and permeability. Beneficially, in Khuff carbonate formations, the initial depositional architecture guides diagenetic fluid pathways and thus strongly impacts reservoir performance prediction.2 The diagenetic overprint and reorganization of porosity is directly linked to the original sedimentary heterogeneity attributed to primary depositional texture, fabric and mineralogy. As such, specific combinations of geologic processes result in a characteristic set of pore types, each with specific flow properties that characterize rock types.
Interwell-scale reservoir heterogeneities related to rock-type partitioning typically cannot be resolved by current subsurface imaging techniques. Wellbores offer limited spatial information, and sub-kilometer-scale lateral resolution can only be approached with very high-resolution seismic data. Carbonate reservoir characterization is prone to difficulty because of non-diagnostic log and seismic responses. With all the cutting-edge technology currently in use within the industry, one of the most reliable sources for interwell geological information on carbonate heterogeneities still comes from outcrops. Outcrops allow us to examine geological variability firsthand at all scales, up to that of the outcrops themselves. An efficient way of delivering quantitative outcrop data is by conducting digital outcrop modeling.
To achieve this, digital outcrop modeling integrates geological data that is spatially positioned and recorded with surveying and digital mapping techniques such as GPS and lidar (light detection and ranging). To assess rock-type partitioning and reduce uncertainties in Khuff-type reservoir static models, digital outcrop modeling was used on Khuff-analogous exposures in Oman. A method of supervised-automated feature extraction from lidar data was developed and tested to identify outcrop-based rock types. In this study, laser reflectivity or intensity was used to discriminate fine- from coarse-crystalline dolostones correlative with mud- vs. grain-rich textures. Thus, the digital approach delivered high-resolution geocellular models delineating rock-type distribution at an interwell scale.
DIGITAL OUTCROP MODELING
Since the late 1990s, various surveying and digital mapping techniques have been used to take outcrop data into the digital realm. These techniques have advanced the generally acknowledged call for quantification of volumetric and geometric properties of carbonate depositional systems and their diagenetic overprint from outcrops. High-resolution GPS and terrestrial scanning lidar are now standard tools in outcrop-based geological studies, and they solve the difficulty in capturing outcrop-based geometric features in a reliable and accurate manner.
In essence, outcrop-based geologic features are spatially recorded with digital mapping and surveying techniques at scales ranging from centimeters (hand specimen observations) to kilometers (mountain range observations). A Digital Outcrop Model (DOM) is defined by integration of interpreted outcrop observations with spatial attributes linked to high-resolution 3D point clouds that are derived from lidar-scanned outcrop faces.3 Commonly, a Digital Elevation Model (DEM) and high-resolution satellite imagery are incorporated and used as a reference.
Several studies have demonstrated the utility of integrating digital technologies for field mapping in carbonate strata.3–5 Workflows and software for data integration and visualization are being developed,6,7 as lidar data can be difficult to handle due to large file sizes and because large volumes must be viewed at one time to fully realize their benefits. Interpreting lidar data is still mostly done manually by digitizing bed boundaries in much the same way digital seismic data was, and frequently still is, interpreted. Fully automated techniques analyzing lidar point clouds to extract, for example, bed boundaries or fractures are being developed but are not commercially available.8,9
The Oman project’s objective was to enhance our ability to directly incorporate digital field observations into a reservoir modeling workflow. To this end, a method of supervised-automated feature extraction using lidar was developed and tested to identify outcrop-based rock types.
STUDY AREA AND GEOLOGIC SETTING
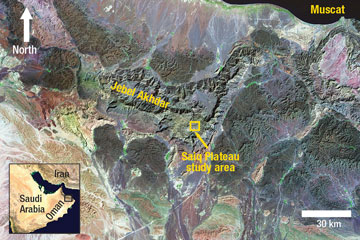
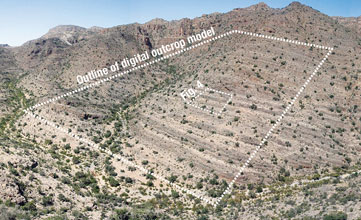
DOM techniques were used within Khuff-type carbonates of the Akhdar Group composed of the Permian Saiq and the Triassic Mahil Formations exposed on Jebel Akhdar in Oman, Fig. 1. Jebel Akhdar defines the central part of the Oman Mountains and is recognized as an anticlinal structure related to the orogeny associated with the collision of the Arabian and Eurasian plates. The southernmost part of Jebel Akhdar, the Saiq Plateau, provides a reservoir-scale study object measuring 15 km east-west and 5 km north-south. The Permian-Triassic succession is complete and about 700 m thick, of which the Permian comprises 600 m. Outcrops are nearly 90% exposed with minor scree and limited vegetation covering recessive units, but uncovered exposures can usually be found, Fig. 2. The well-layered carbonate strata have low structural northward dips of 10–15°. The 700-m-thick succession is completely dolomitized except for the lower 120 m, which is still limestone.
 |
|
Fig. 1. Landsat satellite image of North Oman showing Jebel Akhdar, including the Saiq Plateau study area.
|
|
 |
|
Fig. 2. Photograph of the study area illustrating typical layered strata. The view is northwest. Height of the outcrop is about 200 m around an elevation of 2,100 m.
|
|
LIDAR DATA ACQUISITION AND PROCESSING
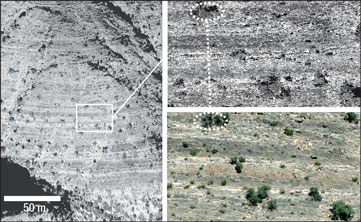
Lidar combines a laser transit and an electronic distance-measuring device capable of scanning large features—in this case, geologic outcrops—at a rate of thousands of individual x, y and z points per second. The terrestrial scanning lidar system (Optech Inc., ILRIS-3D instrument) we used additionally recorded reflected laser energy or laser intensity in the approximately 1,000-nm wavelength at each sample point collected. A sequence of scans is merged together to construct a 3D laser point cloud of the outcrop. Multiple scans taken from numerous locations maximize the point cloud detail for accurate 3D digital reconstruction, Fig. 3.
 |
|
Fig. 3. Lidar images and detailed photograph illustrating the resolution and accuracy of terrestrial scanning lidar.
|
|
Laser intensity reflected from the rock face is sensitive to surface roughness, moisture, material character (such as target color), range (distance from scanner to target), and angle of incidence of the laser beam to the target. Auto-correction built into the lidar unit does not take all of these into account, nor does it fully utilize the range of data actually collected. In natural areas, like outcrops, the angle of incidence of the laser to the target is highly variable and results in laser intensity data that cannot be easily calibrated to material properties. Processing techniques developed for this project at the University of Texas at Austin’s Bureau of Economic Geology (BEG) reprocess for each scan location from the instrument’s raw output to correct for variable angle of incidence and range to calibrate for inconsistent intensity returns. This correction makes the laser intensity values more reliable as a proxy for rock type.
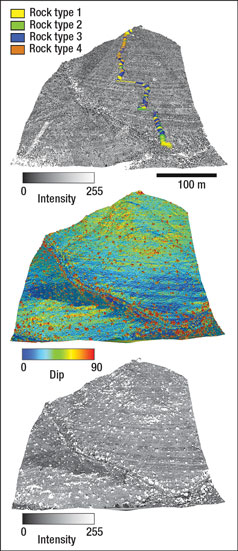
To explore the relationship between laser intensity and rock type, accurate spatial ground-truthing is essential. In order to achieve this, Real-Time Kinematic Global Positioning Systems (RTK GPSs) were integrated to geo-reference lidar scans and to record outcrop observations on rock type by measuring digital stratigraphic sections, Fig. 4. RTK GPS is also used to trace stratal contacts with which surfaces are created that are subsequently used for building model grids.
 |
|
Fig. 4. Digital outcrop model (top) and triangulated surfaces with dip and intensity as displayed properties.
|
|
Vegetation extraction is a final lidar-processing step. Triangulated surfaces were constructed from the lidar point clouds. Beneficially, areas with vegetation comprise high dips with a range of 70–90°, while the steepest rock cliff exposures have dips up to 75°. All points creating triangles with dips higher than 75° are omitted from the lidar data. The final products are vegetation free, reprocessed and corrected lidar point clouds, Fig. 4.
ROCK-TYPE CALIBRATION
On the basis of the reprocessed and corrected lidar data, a method of supervised-automated feature extraction using lidar intensity could be developed to identify outcrop-based rock types. From the complete Khuff-type carbonate succession exposed on the Saiq Plateau, Jebel Akhdar, Oman, we selected and measured a 175-m-thick interval of Permian age that formed roughly the middle part of the total section, Fig. 2. Although the studied interval is completely dolomitized, well-preserved precursor sedimentary fabrics can be recognized in these dolostones, Fig. 5. The carbonate rock succession is recognized at the base by shallow lagoonal and restricted environments of deposition followed by deeper-water and higher-energy open-marine carbonate sand shoals. Four outcrop-based rock types have been defined (Table 1), with fine crystalline dolomudstones-wackestones and large crystalline dolograinstones as end members, Fig. 5. The mud-dominated rock types (types 1 and 2) originate from the shallow and restricted environments of deposition, whereas grain-dominated rock types (types 3 and 4) make up the high-energy facies. On the exposures, each outcrop-based rock type exhibits a different color, roughness, inclination of weathering profile, and average bedding thickness. For example, the mud-dominated rock types express lighter colors and thinner beds than the grain-dominated rock types.
.jpg) |
|
Fig. 5. End-member rock types.
|
|
The RTK GPS’s digital stratigraphic section recorded a rock-type log, Fig. 4. Along this pseudo-well, nearest-neighbor lidar points were assigned a corresponding rock type numerical value.
A plot of intensity against cumulative frequency illustrates that lidar intensity data can be used to discriminate between light-colored, fine-crystalline dolostones and darker, coarse-crystalline dolostones, Fig. 6. It is apparent that dolomite crystal size, following precursor sedimentary fabrics, was responsive to the laser frequency used by the lidar instrument (about 1,000 nm). In other words, lidar intensity can be used to discriminate between originally mud-rich and grain-rich textures in this outcrop location.
.gif) |
|
Fig. 6. Calibration of rock type against lidar intensity.
|
|
A plot of dolostone crystal size (Table 1) vs. intensity illustrates this split between mud-rich and grain-rich textures, Fig. 7. Fine-crystalline dolomites responded with a higher laser reflectivity, and coarse-crystalline dolomites responded with a lower reflected intensity. This corresponded well to the visible light contrast in rock type even though the lidar instrument operates outside the human-visible wavelength range (about 380–750 nm). The relationship between intensity and outcrop-based rock types using crystal size enabled geocellular outcrop models to be constrained.
.gif) |
|
Fig. 7. Calibration of crystal size against lidar intensity.
|
|
| TABLE 1. Summary of rock types |
 |
GEOCELLULAR OUTCROP MODELS
In addition to using a terrestrial scanning lidar system to scan outcrop faces, RTK GPS was used to record stratal contacts and a pseudo-well. All data were assimilated and visualized to create a DOM.3,4 The next step was to construct a geocellular outcrop model delineating rock-type partitioning. The manually RTK GPS-traced stratal contact points were used to create lower and upper bounding surfaces of the model grid. Grid cells are 10 x 10 m horizontally, while cell dimensions are constrained vertically by intervals of equal rock type. Consequently, the rock-type log was used to construct a layer-based rock-type model, Fig. 8.
.jpg) |
|
Fig. 8. Geocellular outcrop models.
|
|
The reprocessed and corrected lidar data set was upscaled into the model grid and distributed in all dimensions by using variography, resulting in a geocellular outcrop model populated with intensity. This increased the known cells within the DOM by two orders of magnitude. Finally, intensity-crystal size trends (Fig. 7) can be used for constructing a geocellular outcrop model populated with intensity-based crystal size.
The intensity-based rock-type and crystal-size models can be used, in turn, to constrain porosity and permeability models, which is the ultimate goal. Well-established rock-type classifications for dolostones and their permeability transforms using intraparticle porosity are used to constrain permeability.10 As stated above, well-preserved precursor sedimentary fabrics can be recognized in the dolomotized interval under study. Early dolomitization, occurring shortly after deposition, commonly creates such fabric-preserved dolostones.10 While in this case the remaining porosity has been filled by late diagenetic cements, reasonable estimates from subsurface reservoirs’ thin sections can be used for intraparticle porosity values. Vuggy porosity, not affecting permeability, is added after applying the permeability transforms. The final porosity and permeability models (Fig. 8) give a numerical indication of lateral variability and reservoir property partitioning within typical Khuff-type carbonate strata, and thus reduce uncertainties in equivalent static reservoir models. In addition, the final models can be used to test the effect of lateral heterogeneity on dynamic behavior.
CONCLUSIONS
The overall objective of this project was to capture and integrate field observations from a Khuff-type carbonate outcrop digitally, efficiently and accurately to reduce uncertainties and improve modeling and reservoir characterization for subsurface assets. Stratal contacts and stratigraphic sections were spatially positioned with high-resolution GPS. High-resolution 3D point clouds derived from lidar-scanned outcrop faces were incorporated with GPS data to create a digital outcrop model. A new method of supervised-automated feature extraction using a DOM was developed and tested to identify outcrop-based rock types. In this study, lidar reflection intensity was used to discriminate fine- from coarse-crystalline dolostones correlative with mud- vs. grain-rich textures. The digital approach resulted in high-resolution geocellular models that delineate rock-type distribution at an interwell and subseismic scale. These results can be used to reduce uncertainties in static reservoir models and to test dynamic behavior. The unique combination of data types made it possible to assess reservoir quality at multiple scales and preserved observations spatially for future reference. Interpretations of how these data affect reservoir quality may change with time, but these quantitative data will not. 
* Mr. Bellian now works for Chevron Energy Technology Company.
ACKNOWLEDGMENT
This article was prepared from an abstract presented at the AAPG Annual Convention & Exhibition held in Denver, June 7–10, 2009. Contributions come from Issa Quseimi and Rashid Hinai, Petroleum Development Oman; Paul Milroy, Michael Pöppelreiter, Joachim Amthor, Archanaa Kailasam and Arjanne Immens, Shell; Bastian Köhrer and Michael Zeller, University of Tübingen, Germany.
LITERATURE CITED
1 Aali, J., Rahimpour-Bonab, H. and M. Reza Kamali, “Geochemistry and origin of the world’s largest gas field from Persian Gulf, Iran,” Journal of Petroleum Science and Engineering, 50, 2006, pp. 161–175.
2 Insalaco, E. et al., “Upper Dalan Member and Kangan Formation between the Zagros Mountains and offshore Fars, Iran: Depositional system, biostratigraphy and stratigraphic architecture,” GeoArabia, 11, 2006, pp. 75–176.
3 Bellian, J. A., Kerans, C. and D. C. Jennette, “Digital outcrop models: Application of terrestrial scanning lidar technology in stratigraphic modeling,” Journal of Sedimentary Research, 75, 2005, pp. 166–176.
4 Adams, E. W. et al., “Digital characterization of thrombolite-stromatolite reef distribution in a carbonate ramp system (terminal Proterozoic, Nama Group, Namibia),” American Association of Petroleum Geologists Bulletin, 89, 2005, pp. 1293–1318.
5 Phelps, R. M., Kerans, C., Scott, S. Z., Janson, X. and J. A. Bellian, “Three-dimensional modelling and sequence stratigraphy of a carbonate ramp-to-shelf transition, Permian Upper San Andres Formation,” Sedimentology, 55, 2008, pp. 1777–1813.
6 Redfern, J., Hodgetts, D. and I. Fabuel Perez, “Digital analysis brings renaissance for petroleum geology outcrop studies in North Africa,” First Break, 25, 2007, pp. 81–87.
7 Verwer, K., Adams, E. W. and J. A. M. Kenter, “Digital outcrop models: Technology and applications,” First Break, 25, 2007, pp. 57–63.
8 Bellian, J. A., Beck, R. and C. Kerans, “Analysis of hyperspectral and lidar data: Remote optical mineralogy and fracture identification,” Geosphere, 3, 2007, pp. 491–500.
9 Viseur, S., Richet, R., Borgomano, J. and E. W. Adams, “Semi-automated detections of geological features from digital outcrop models (The Gresse-en-Vercors Cliff, France),” presented at the 69th EAGE Conference & Exhibition, London, UK, June 11–14, 2007.
10 Lucia, F. J., Carbonate Reservoir Characterization, 2nd Ed., Springer-Verlag, Berlin Heidelberg, 2007, p. 336.
|
THE AUTHORS
|
|

|
Ross Schweitzer is a Drilling Engineer for Devon Energy working in the Barnett Shale near Oklahoma City. He previously worked as an intern with Range Resources. Mr. Schweitzer holds a BS degree in civil and environmental engineering and an MS degree in petroleum engineering from West Virginia University.
|
|
|

|
Jerome Bellian is a Stratigrapher at Chevron Energy Technology Company who focuses on integration of imaging techniques to subsurface hydrocarbon reservoirs. He received his PhD in geology from the Jackson School of Geosciences in 2009 and his MSc and BA degrees from Miami University in Oxford, Ohio. Before joining Chevron, Dr. Bellian worked for nine years as a researcher at the University of Texas at Austin’s Bureau of Economic Geology in the Reservoir Characterization Research Laboratory.
|
|

|
Reuben Reyes is a Senior Operating Systems and Visualization Specialist at the University of Texas at Austin’s Bureau of Economic Geology. He writes specialized computer programs for large data models on high-end visualization systems and super-computer clusters. His applications are used as digital tools for scientific and geological information. His interests are in geometric characterization and 3D visualization of complex data sets.
|
|


.jpg)
.gif)
.gif)

.jpg)


