Newbuilds continue to enter the US fleet, as rig-building programs initiated several years ago keep producing new units.
Steve Berkman and Tory Stokes, NOV Downhole
The economic reversal that has occurred over the past year has depressed the demand for rigs, causing drilling activity to plummet. According to the 56th annual NOV Downhole’s rig census (previously known as the ReedHycalog rig census), overall fleet growth has slowed somewhat over the last year, but newly manufactured units are still being brought to market at a steady pace, even as most rig owners are struggling to find work.
NOV Downhole works closely with several companies to compile a complete representation of the global rig market. RigData and ODS-Petrodata provide information to help summarize the US land and global offshore mobile rig fleets. Nickle’s Energy Group and NOV Downhole personnel in Calgary provide information for the Canadian figures. Estimates for the international land rig fleet are collected by NOV Downhole regional managers and submitted for this article.
CENSUS HIGHLIGHTS
Key statistics from the 2009 census include the following:
• The US rig fleet had a net gain of 93 rigs this year, increasing the total available by another 3%, to 3,169 rigs. This net increase is the result of 311 rig additions and 218 rig deletions during the past year, Fig. 1.
• Newly manufactured rigs, at 237 units, were the largest addition to the US fleet again in 2009.
• A number of rigs, 164 units, were removed from active service over the past year.
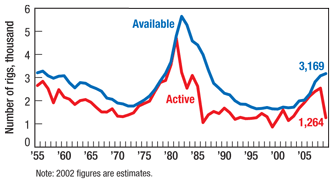
• The total number of US rigs meeting the census definition of “active” dropped by 50% this year, down to 1,264, versus 2,541 last year.
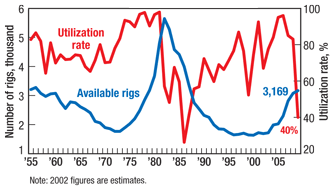
• US rig utilization fell significantly, down to 40% from 83% in 2008, Fig. 2.
• The total number of US rig owners dropped by only one this year to 320.
• Drilling contractors own 86% of all drilling rigs, with operators owning the remaining 14%.
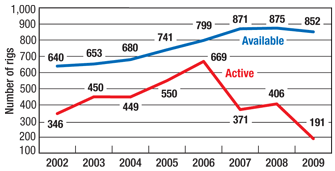
• The Canadian available rig fleet declined to 852 units, down from a recent high of 875 last year.
• Canadian rig activity dropped by 53%, with active rigs at 191 versus 406 in 2008.
• The global offshore mobile available fleet expanded by another 4% this year with a net gain of 30 available rigs, due to newbuilds.
• Global offshore mobile activity was down about 4%, with utilization declining to 81% from 88%.
• Outside the US and Canada, the international rig fleet grew 4% to 4,462 rigs.
• International fleet utilization dropped to 84% from just over 92% a year ago.
 |
|
Fig. 1. US available vs. active rigs, 1955–2009.
|
|
 |
|
Fig. 2. US available rigs vs. utilization, 1955–2009.
|
|
U.S. RIG AVAILABILITY
Newbuilds have been the primary way owners have maintained their fleets over the past several years, although there are usually some refurbished and reactivated units added as well. With the assistance of RigData, census takers reported that the US fleet added 311 rigs overall over the past year, down from 347 units gained in 2008. The 311 rigs added to the fleet more than offset reductions. Fleet additions fall into one of four categories, Table 1:
• Newly manufactured rigs
• Rigs brought back into service
• Rigs moved into the country
• Rigs assembled from parts.
Rapid fleet expansion has occurred due to newly manufactured units for the past four years, and they are still coming online at a vigorous pace. This is the primary reason for expansion of the available fleet. Another 237 units were built from scratch this year, up from the 202 added in 2008. This brings the total number of newbuilds added over the past four years to 1,026, about a third of the total US fleet. Of the 237 newly manufactured units, 231 were land rigs, three were floating and two were bottom supported.
The number of US rigs brought back into service dropped this year to just 36 units versus 101 that were reactivated in the 2008 census. The abundance of newbuilds is generally satisfying the reduced need for rigs and, therefore, refurbishments are seldom required. Note that each of these reactivations had been counted in previous census tabulations, but had been subsequently removed due to becoming inactive or inoperable. When required, these rigs were refurbished or reactivated and they reentered the available fleet.
Thirty rigs were brought into the US from other countries over the past year, versus 13 last year. Almost all of these came from Canada, where the drilling market is also suffering.
Just eight rigs assembled from parts were brought into the fleet this year. This compares to 31 units last year and 71 the year before. An increasing percentage of rigs added to the fleet were newbuilds rather than reactivations or refurbished from components.
U.S. RIG ATTRITION ACCELERATES
Rigs are removed from service when it is no longer cost-effective to operate the equipment or if the majority of the machinery on the unit becomes obsolete. Rigs can also move out of the US to other lucrative markets. All of these rigs are tracked in the annual census. This year’s total deletions numbered 218, a significant increase from last year’s 88 units. Deletions to the fleet were reported in three categories, Table 1:
• Rigs removed from service
• Rigs moved out of the country
• Destroyed rigs.
| TABLE 1. Changes in the available US fleet |
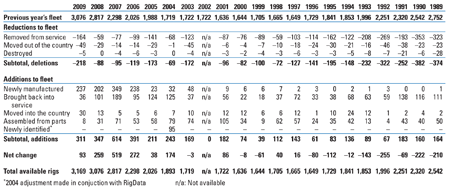 |
Rigs removed from service continues to be the largest category of deletions, increasing to 164 units this year, versus just 59 in 2008. The number of rigs removed from service had been diminishing for the past few years, but jumped this year due to lower demand and the strong new fleet that has been built. Our census-counting rules exclude rigs from the available count that have been stacked for a significant amount of time, require a large capital expenditure to be operable, or have been auctioned for parts or cannibalized to keep other rigs running.
In this year’s US count, 49 rigs moved out of the US, an increase from the 29 rigs moving out last year. Considering that 30 rigs moved into the country for the 2009 census there was a net decline of 19 units resulting from rig moves. It has been a continuing trend over the past five years that more rigs are leaving the US than are entering.
Rigs that were destroyed comprise the last category for deletions. Unfortunately, the US suffered from an active hurricane season during the past year that caused irreparable damage to several rigs. Out of the five destroyed rigs, four were reported as being decommissioned due to hurricane damage.
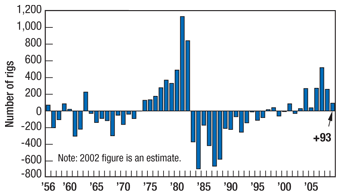
Total rig additions numbered 311, while deletions totaled 218. The net change in the fleet over the past year was a 93-unit increase, showing a slight boost in rig availability, Fig. 3.
 |
|
Fig. 3. US change in available rigs, 1956–2009.
|
|
CANADIAN FLEET SHRINKS AFTER YEARS OF GAINS
The Canadian fleet began contracting in size after several years of expansion. Like in the US, newly manufactured rigs continue to come online in Canada, Table 2. However, considerably lower rig demand caused the overall Canadian available count to fall by 23 units this year. Newbuilds totaled 29 this year, compared to last year’s 47. This was the primary way rigs were added to the fleet, with the exception of a few that were brought back into service or moved into the country. Additions came to 36 units overall. There were no rigs recognized as assembled from parts.
| TABLE 2. Changes to the Canadian rig fleet |
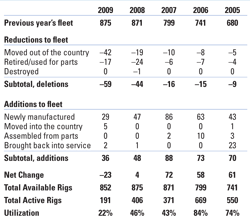 |
The primary cause of the Canadian fleet decline this year was to rigs that moved out of the country. A considerable number, 42, left Canada over the past year, versus 19 last year. Another 17 were retired or used for parts. Fortunately, no units were reported as destroyed over the past year. Deletions numbered a total of 59 units. Subtracting these 36 additions from the 59 deletions left a net reduction of 23 rigs and an available count of 852, a drop of 3%.
GLOBAL OFFSHORE MOBILE FLEET CONTINUES TO EXPAND
The global offshore mobile rig fleet experienced additional growth this year predominantly due to rig building. With the exception of one reactivation, all of the 44 rigs that entered the fleet this year were newly manufactured, compared to 28 in 2008, Table 3. ODS-Petrodata estimates that about 54 units are scheduled for delivery by the time the 2010 census period rolls around next spring, although some inevitably will not meet that timetable. No new rigs entering the fleet this year were described as assembled from parts.
| TABLE 3. Changes to the global offshoremobile fleet |
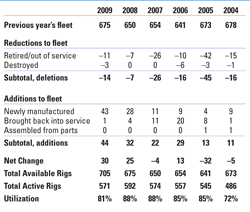 |
Overall reductions to the global offshore mobile fleet numbered 14 for this census, an increase from seven units last year. Eleven of these were considered retired and were removed from service. Most of these out-of-service rigs have been categorized as “cold-stacked.” They have not worked for more than five years and do not have upcoming contracts. Occasionally, these rigs will be put back into service, but generally it would take a significant capital expenditure to do so. Therefore these drilling units cannot be counted as “available” by census rules.
There were three rigs that were noted as hurricane casualties and counted in the destroyed category. Note that platform and inland barges, being more difficult to track, are not included in the global mobile offshore numbers.
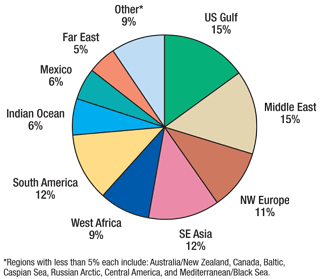
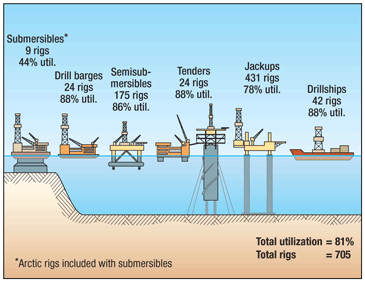
Overall, the net increase in global offshore mobile units was 30, bringing the available count up another 4%, to 705. The worldwide offshore fleet is widely distributed, with the US and Middle East dominating, followed by Southeast Asia and South America, Fig. 4. The makeup of the fleet by rig type is shown in Fig. 5.
 |
|
Fig. 4. Mobile offshore fleet by region, 2009.
|
|
 |
|
Fig. 5. Makeup of the global offshore mobile fleet, 2009.
|
|
U.S. ACTIVITY PLUMMETS
The 2009 active rig count dropped significantly this year, due to dire market conditions. After a year of positive growth and record oil prices, the recession took hold, greatly affecting US rig activity for 2009. The active rig count dropped by half to 1,264 this year after being at 2,541 in 2008. Not only has the US count not been this low since the year 2000 when it was 1,215, but the decline was also the second steepest in the 56-year history of the census.
The methodology used to count active rigs for the NOV Downhole census is different from that used in other active rig counts that are reported weekly (see sidebar at end). This census counts a rig as active if it has “turned to the right” at any time during a defined 45-day period. For 2009, this was between May 6 and June 19. Note that this means the NOV Downhole statistic will always be higher than other reported weekly rig counts, because a longer time period is used to monitor activity.
Rig utilization, the supply and demand balance of rigs, shows the ratio of active to available rigs and is an often-quoted industry statistic. Due to the depressed activity level, utilization dropped drastically and was down to just 40%, compared with 83% last year. Utilization has not been this low since the late 1980s.
There were 1,905 available rigs that were not working during the annual census period. These units were classified according to the length of time they had been idle. It is possible that some rigs may have been under contract and awaiting the start of their project, or being moved to the next drilling location. Rigs stacked less than one year numbered 1,719; one to two years, 114; and two to three years, 72. Aging rules of the census state that any rig stacked for longer than three years will be removed from the available fleet, although most rigs tend to be decommissioned before their stacked classification targets them for deletion. Rigs removed from the fleet for this reason fall into the category removed from service.
Another figure often quoted in the census is that of full-year utilization, which is the total percentage of available rigs that drilled sometime during the past year. Adding the 1,719 rigs stacked less than one year to the 1,264 active units in the census provides this number. This full-year utilization figure indicates that rig owners put 2,983, or 94.1%, of available rigs to work during the past year. This statistic certainly reflects back to 2008 when the activity level was brisk and rig demand was high.
Every US region examined by the census showed decreased rig activity for 2009. Comparing this year’s numbers to last, the regional breakdown is shown in Table 4. Again, the ArkLaTex region showed the highest overall number of active rigs at 257 units, although this was a 236-unit drop from the previous year.
| TABLE 4. US regional census results |
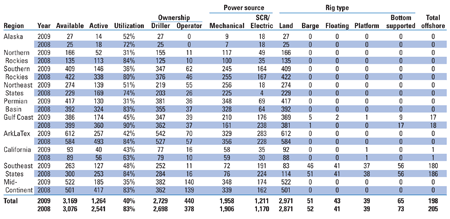 |
Utilization by region shows consistent results, with all regions indicating significant declines in this ratio. These low levels indicate that every region has excess rig capacity. This utilization year’s figures for each region are as follows:
• Alaska, 52%
• Northern Rockies, 31%
• Southern Rockies, 36%
• Northeast States, 51%
• Permian Basin, 31%
• Gulf Coast, 45%
• ArkLaTex, 42%
• California, 43%
• Southeast States, 48%
• Mid-Continent, 35%.
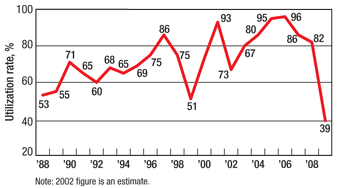
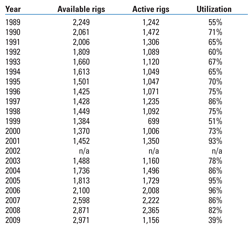
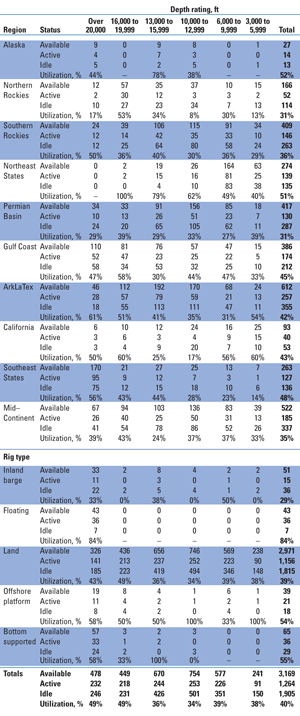
Examining US land and offshore rigs independently, gross utilization for land rigs was down 43 percentage points to 39%, from 82% in 2008, Fig. 6 and Table 5. The US marine fleet also suffered this year, with offshore utilization falling to 55% after being 82% last year. Demand varies greatly, however, by rig type. Floating rigs remain in greatest demand, with 84% utilization at census time. Rigs showing the lowest utilization are the inland barge units, with this ratio at just 29%. The total US rig fleet was also analyzed by depth capacity, which revealed that units in every depth range experienced a utilization downturn, Table 6.
 |
|
Fig. 6. US land rig utilization, 1988–2009.
|
|
| TABLE 5. US land rigs, number and utilization |
 |
| TABLE 6. US rig utilization by depth capacity |
 |
CANADIAN ACTIVITY BACKSLIDES
After beginning a gradual rebound in 2008, Canada experienced a considerable decline in rig activity for 2009. Last year, activity was inching up, but during this year’s spring census period of May 6 to June 19, it has taken a harsh fall of 53%. Active rigs are now just 191 units, versus 406 during the last census count. Canadian utilization figures indicate that this depressed market may struggle for several more years before experiencing prosperous times again. Utilization is now at the lowest level that the census has measured, just 22%, compared with last year’s 46%, Fig. 7.
 |
|
Fig. 7. Canada available vs. active rigs, 2002–2009.
|
|
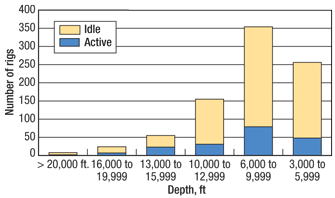
The bulk of the Canadian available and active fleet resides in the 6,000 to 9,999-ft range. Fleet availability and activity by depth capacity show that utilization is now highest in the 13,000 to 15,999-ft range (42%) and lowest in the 3,000 to 5,999-ft range (19%), Fig. 8.
 |
|
Fig. 8. Canadian rigs by depth capacity, 2009.
|
|
INTERNATIONAL LAND RIG UTILIZATION SOFTENS
While not as severely affected as North America, the international markets did reflect lower activity. The rig fleet increased by 165 units, or 4%, to 4,462. Most areas reported an increase in their available rig fleets, except Latin America and Asia, which had slight declines.
Utilization rates, comparing the past three years, are shown in Table 7 for the primary international regions. Every area reported a decrease in utilization, with the overall percentage dropping from 92% in 2008 to 84% for this year’s census period. Africa had the lowest utilization rate at 70%, typically influenced by spots with security issues that keep some rigs inactive. As mentioned in previous years, it has been observed that some international areas have large numbers of available rigs, but these units typically use older technology and may not be universally mobile or marketable. Also, in some cases, available rigs are actually under contract awaiting a project start, and are realistically unavailable for other work.
| TABLE 7. International utilization |
 |
GLOBAL OFFSHORE MOBILE FLEET DIPS
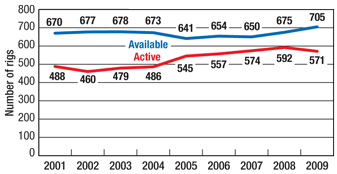
The global offshore mobile fleet experienced a 4% decline in activity during the 2009 census period. Total working rigs numbered 571 units during the spring 45-day active period (May 6 to June 19), down from 592 in 2008. This count includes all offshore mobile units with the exception of platform and inland barge rigs. With both available rigs increasing and active rigs on the decline, utilization slipped to 81% this year from last year’s level of 88%, Fig. 9.
 |
|
Fig. 9. Global offshore mobile available vs. active rigs, 2001–2009.
|
|
OTHER U.S. INDUSTRY TRENDS
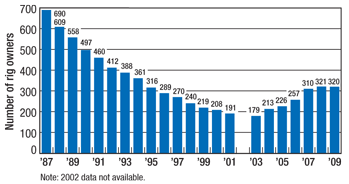
The market strength in recent years had prompted new companies to form. Since 2004, the census has counted more new companies entering the fleet than leaving and the number of rig owners has risen. This year, however, a leveling off was noted in the number of rig owners. Although several newly established companies were included in the 2009 census, some drilling companies also ceased operations, and a net decrease of one company was tabulated. Today, the industry is at 320 owners versus 321 owners last year, Fig. 10.
 |
|
Fig. 10. US rig owners, 1987–2009.
|
|
The census tracks the ownership of rigs by type of owner, with considerably more rigs always being owned by drilling contractors versus operators. This remains the case in 2009, but the number of operator-owned rigs is continuing to rise. This year’s census counted 51 operators versus 43 in 2008. Operators now own about 14% of the overall US fleet, up from 12% in 2008.
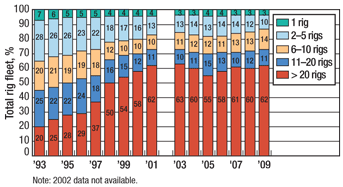
In this industry, one way that strong companies tend to increase their rig holdings is by merging with or acquiring their weaker competitors. Census statistics have been examining US rig ownership since 1993 and have tracked it by fleet size to determine the existing trends. In the 1990s, a major tendency toward consolidation surfaced. In the past several years, there have been more slight fluctuations in this area, with the largest companies continuing to own in the range of 60% of the fleet. This year, owners with more than 20 rigs in their fleets possess about 62% of all drilling rigs, Fig. 11.
 |
|
Fig. 11. US rig ownership by fleet size, 1993–2009.
|
|
CONTRACTORS WORRIED ABOUT RIG RATES
Drilling contractors are surveyed each year regarding their opinions of the industry. Through an optional survey, respondents share information about their company’s current business and their future projections. These professionals continue to provide interesting input that sheds light on their viewpoints and concerns. Contractors are asked to rank some key issues of importance and estimate a number of changes to their business, both past and anticipated. Forty-nine contractors participated in this year’s survey, representing about 14% of all US rig owners and about 10% of Canadian owners. These companies were a wide mix in both size and regional area represented.
For the past 19 years, respondents have been asked to rank a set of issues by importance to their business. “Rig rates” is often the top concern of contractors, and this year is certainly no different. With rig activity in the doldrums, competition for work is fierce and owners are feeling the pain. What did vary for 2009 was the secondary concern of contractors, which is now “government regulations.” With a new administration in place, there is apprehension about change in store for the industry over the next several years. A third concern for 2009 was “insurance costs.” Anxiety about “escalating premiums” as an issue actually tied with “crew availability” this year, as both are problem areas for the industry.
According to survey data, land rig rates in actual dollars have averaged $12,051/day during the period May–June of this year. Labor rates for contractors have actually decreased this year, by 8% on average. Maintenance expenses also fell for 2009, down 24%. These operating expenses likely slid due to a larger portion of the fleet being newbuilds, as well as the drop in overall use of the fleet.
Contractors responding to our survey indicated that their rig activity has been down on average 52% since this time last year. This is consistent with the decreased level of rig activity shown in the 2009 census results. When asked what they see as the future of the drilling contracting industry during the next two years, it isn’t surprising that, after experiencing such a steep downturn, many rig owners are feeling pessimistic this year. Companies seem to be mixed in their views for the future, with some contractors anticipating slow improvement, while others are discouraged and uneasy about the direction the market will take. Overall, contractors’ expectations vary widely, but the average is a modest climb of 3% over the coming year.
When contractors were asked at what level oil and gas prices needed to be to have a positive effect on their business, they estimated on average $76.20/bbl for oil, and $5.90/Mcf for gas. For oil, at the time of the survey, the price would have needed to increase about $10/bbl to be helpful to these companies. Natural gas would have had to jump by about $2.50/Mcf to put contractors in a more comfortable position. The good news is oil in the $70-plus range. However, with gas inventory levels high, it may take a little while before $5 or $6/Mcf gas arrives.
CONTRACTORS SIT TIGHT AND WAIT
Many contractors are wary enough about the current market to not plan for major changes over the next several years. When asked to describe their companies’ plans for the next five years, the largest percentage, 43%, of survey respondents reported no plans for change. About 18% tell us they are interested in diversifying into other businesses. Another 16% are planning to add to their fleets over the next half decade, while 14% are seeking merger partners and 8% plan to downsize over the next several years. International opportunities are being explored by 10% of survey respondents. Finally, 4% were uncertain about their future plans at the time of the survey.
U.S. FORECAST FOR 2010
Stagnation will define the industry during the 2010 census period. Despite the current economic situation, some new rig rollouts will undoubtedly occur over the next year, since contracts are already in place and construction has begun on many new units. Even with this momentum, the number of new rigs added will be fewer than over the last several years. It is anticipated that the US available count will remain at about the same level, since older rigs taken out of service will offset these additions. Active count forecasts for 2010 indicate that some improvement may be ahead for the second half of the year due to climbing gas prices, but not in time to help census figures for next year. 
ACKNOWLEDGMENT
The following are recognized for their contributions to this year’s rig census: Michael Wayne (RigData); Tom Kellock (ODS–Petrodata); Joline Argue (Nickle’s Energy Group); Wade Dannhaus, Leonora Compton, Kosay El Rayez, Robin MacMillan, Stephanie Martin, Doug Smith and Mark Tooley (NOV Downhole).
CENSUS GROUND RULES
• Company sales regions were used for the geographical breakdown shown in Table 4 and the accompanying map.
• Contractor-owned rigs are those belonging to companies whose primary business is offering drilling contracting services.
• To be considered active, a rig must be drilling at least one day during the 45-day period the census is taken.
• Only workable rotary rigs are included; cable tool rigs are excluded.
• To be considered available, a rig must be able to go to work without requiring a significant capital expenditure.
• Rotary rigs stacked for an extended period of time, typically three years or longer, are not counted as available.
• A rig must be capable of, and normally employed for, drilling deeper than 3,000 feet. Therefore, some shallow drilling rigs (mostly in the US Northeast) are excluded, but this is necessary to ensure well-servicing rigs are not counted.
• Electric rigs include all those that transmit power from prime movers to electrically driven equipment.
• Inland barges include barge-mounted rigs that may be moved from one location to another via canal, bayou or river and drill in sheltered inland waters. Offshore rigs include stationary platform units (both self-contained and tender-supported), bottom-supported mobile units, and floating rigs (both drillships and semisubmersibles).
|
THE AUTHORS
|
 |
Steve Berkman has been the Director of Strategic Marketing for NOV Downhole since January 2009. Prior to that he had been Marketing Manager for ReedHycalog since July 2004. Berkman has served as Regional Sales Manager in Latin America. He began with ReedHycalog over 27 years ago, starting as a Design Engineer in 1982. Berkman has been all over the world in various engineering and sales positions. He received a BS in mechanical engineering from the University of Texas in 1981.
|
|
 |
Tory A. Stokes is a consultant for NOV Downhole, after being employed by ReedHycalog as Senior Marketing Analyst for eight years. She graduated with a BS degree in applied mathematics from Texas A&M University in 1985, and earned an MBA from the University of Houston in 1993.
|
|


