Always remember the basics with log responses. This tutorial reminds us that, despite evolutionary improvements, log responses are often misunderstood.
W. A. Gilchrist, Jr. and Noel Atzmiller, Baker Hughes Inc.
Compensated Neutron (CN) logs have been around for many years and used successfully for many petrophysical applications. Although the basic design and general response characteristics of these instruments have remained relatively constant over the years, service companies have refined the response characterizations and have updated their hardware, providing evolutionary improvements. Unfortunately, the general understanding among earth scientists of how CN instruments work and how to make the best use of the log data appears to have lagged, or perhaps even worsened, in recent years.
Many petrophysicists, geologists and petroleum engineers believe that various CN instruments are essentially the same, because they have oversimplified the underlying physical basis of the measurement, and have misunderstood the correct use and interpretation of the data. After a brief introduction to neutron tool physics, we will attempt to illustrate some of the pitfalls and present ways of avoiding them. This article discusses several obstacles to understanding and interpreting neutron logs and proposes some techniques for avoiding problems. There is a full-length paper on which this article is based.1
BASIC NEUTRON LOG PHYSICS
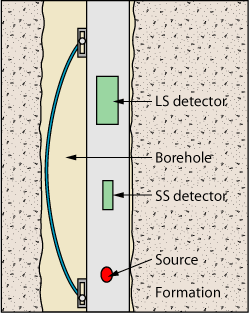
A typical CN tool, as illustrated in Fig. 1, consists of a neutron source and two detectors displaced a few tens of centimeters along the axis of the tool. The tool is usually run decentralized as shown, and the formation porosity is determined from the ratio of counts in the two detectors.
 |
|
Fig. 1. A typical two-detector CN tool decentralized in a borehole. Formation porosity is determined from the ratio of counts in the two detectors.
|
|
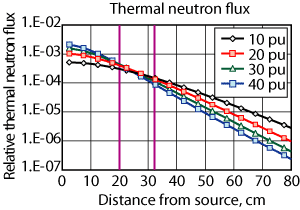
To better understand how these tools work, it is instructive to examine a hypothetical experiment. The flux of thermal neutrons as a function of distance from an americium-beryllium (Am-Be) neutron source, embedded in a series of homogeneous limestone formations, can be determined with numerical modeling. Figure 2 shows the thermal neutron flux vs. distance from the source for formations of 10%, 20%, 30% and 40% porosity. The figure clearly shows three regions, a near region where the flux increases with porosity, a far region where the flux declines with porosity, and a crossover region where the flux has little relationship to porosity.
 |
|
Fig. 2. Thermal neutron flux as a function of distance from an Am-Be source embedded in limestone. Three distinct regions can be seen.
|
|
On this semi-logarithmic plot, the flux in the far region decreases linearly with the spacing, and the slope of the lines depends on the porosity. For a given formation, the ratio of count rates from two detectors placed in this far region would uniquely determine the slope and thus the porosity. Some CN tools use californium-252 (Cf-252) sources, which produce somewhat lower-energy neutrons. Regardless, modeling results for Cf-252 would show essentially the same behavior.
This specific character is due to the physical processes involved. Nuclei with masses such as hydrogen, which are similar to that of the neutron, are quick in slowing down the neutron to a thermal state; thus, hydrogen plays a very strong role. Pore space filled with either water or liquid hydrocarbons contains a significant amount of hydrogen; this is why neutron tools are sensitive to liquid-filled porosity. After the neutrons reach thermal equilibrium, they diffuse through the formation until they are captured. This process explains why thermal neutron tools are sensitive to thermal neutron absorbers. Of course, there is more to consider than just Hydrogen Index (HI) and Sigma (∑—this will be discussed subsequently).
The primary response standard for almost all CN tools is a set of limestone formations on the campus of the University of Houston (UH). Most service companies use a combination of measurements in the UH formations and data acquired in their own laboratories, along with numerical simulations, to determine the basic response and develop environmental corrections for their tools.
The response of any specific CN tool depends on the design details of that tool. The source type and placement, the detector types, sizes and spacings, as well as other tool parameters all have an impact on the tool response. For example, using helium-3 proportional detectors, the gas pressure has a strong affect on sensitivity.
MORE THAN HYDROGEN INDEX AND SIGMA
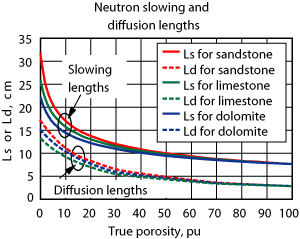
There is a tendency to oversimplify the physics of the CN measurement. Many neutron porosity measurements use HI to explain the tool response. Although it is true that hydrogen plays a very important role in slowing fast neutrons, HI alone cannot adequately explain tool response. The nuclear macro-parameters of slowing-down length, Ls, and diffusion length, Ld, which are described in detail in the literature,2,3 give a much more complete picture. The problem with using HI alone can be seen in Fig. 3.
 |
|
Fig. 3. Slowing-down and diffusion lengths in sandstone, limestone and dolomite for neutrons from an Am-Be source. At zero porosity, the nuclear macro-parameters Ls and Ld, as well as the CN responses, are quite different, but the HI has the same value, zero, for all three types of rock.
|
|
The nuclear macro-parameters, Ls and Ld, are shown for a full range of freshwater-filled porosities in three different formation mineralogies. At low porosities, Ls and Ld are very dissimilar for the different types of rock. At zero porosity, HI is zero regardless of the rock type, but a CN reading in each of these cases would be quite different. Obviously, there are other things to consider besides HI. The real danger of thinking of neutron response solely in terms of HI is the idea that all formations with the same amount of hydrogen should read the same neutron porosity value. This is not true. The situation is complicated even more when a formation has an elevated thermal neutron capture cross-section, ∑. Small concentrations of highly absorptive elements can elevate ∑ significantly without changing the HI. We can still use the macro-parameters Ls and Ld, as Ld is dependent on ∑ and reflects the change. Some specific problems with variations in ∑ will be discussed in the section on environmental corrections.
NEUTRON LOGS ARE NOT ALL CREATED EQUAL
This statement does not mean that one tool is necessarily better than another; they are just different. All wireline CN tools are characterized and calibrated for a specific set of conditions—a freshwater-filled 8-in. borehole in a limestone formation. Under these conditions, all CN tools, from any service company, should read the same. As LWD tools are designed for specific borehole sizes, the 8-in. borehole requirement is dropped in favor of the specific hole size for each collar dimension. Still, with a freshwater-filled borehole of the specified dimension in a limestone formation, the LWD-CN tools should all read the same.
In any other condition, however, different tools do not necessarily read the same. To confirm this statement, one need only look into the chart books offered by the various service companies, or read a few published papers.4–7 Valant-Spaight et al. directly illustrate the point. They describe a three-detector tool that allows three ratios and three porosity curves to be generated. A well log plot in the paper presents all three curves, and they can be seen to agree in clean formations and disagree significantly in shales. If different CN porosity curves from the same vendor cannot be made to agree under all conditions, it is unreasonable to expect that values produced by different service companies would agree in all environments.
ENVIRONMENTAL CORRECTIONS
Service companies expend a considerable amount of effort defining corrections for various environmental effects on CN measurements. The list of routinely available corrections is quite long, and questions about new drilling fluids or unusual borehole conditions continue to be raised from time to time. Like the basic porosity response, the environmental corrections are different for different tool designs. It would seem obvious that log data from one service company should be corrected using the correction charts or algorithms provided by that company. Unfortunately, this is not always the case. Software packages do not always contain all of the corrections for a specific instrument. In addition, a quality assessment of uncorrected data is frequently based on a vague recollection of a correction from an old chart book.
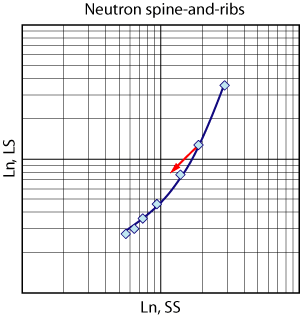
Most environmental effects on CN logs cause the data from different tools to move in the same direction, but probably not by the same amount. An enlarged borehole, for example, makes almost any neutron log read too high. On the other hand, high borehole salinity might cause one tool to read too low and another to read too high. At first glance, it is not easy to understand how this can happen. If we think solely in terms of HI and ∑, the effects should be about the same on any tool. Figure 4 illustrates how the same environmental condition can have a different impact on instruments of different designs.
 |
|
Fig. 4. A CN spine-and-ribs plot. The red arrow represents some arbitrary environmental effect that reduces both the short-spaced (SS) and long-spaced (LS) count rate. If the slope of this arrow is 1, the ratio is unchanged, and no correction is needed.
|
|
This plot shows relative long-spaced (LS) and short-spaced (SS) count rates for different porosities plotted on logarithmic scales. Lower porosities plot toward the upper right, and higher porosities plot toward the lower left. This type of plot is not the traditional way of looking at CN data, but it helps illustrate a point. The red arrow represents the effect of some arbitrary environmental condition that reduces both the LS and SS counts. If the slope of this displacement vector is 1, the SS/LS ratio is unchanged, and no correction is needed. On the other hand, if the slope is less than 1, the SS/LS ratio is lower, and the apparent porosity is too low. Similarly, if the slope is greater than 1, the ratio is higher, and the apparent porosity is too high. A small change in the design parameters of a specific instrument can change the angle of this displacement vector for a given environmental condition, resulting in a change in the required correction.
The borehole salinity effect is a case in point. A few years ago, we introduced a new instrument for which we had paid particular attention to reducing borehole salinity effects. Compared to its predecessor, the correction was not only smaller, but it was in the opposite direction. Both tools had been characterized using extensive laboratory and modeling data, yet the corrections were different.
The previous example illustrates the fact that the impact of environmental conditions on CN logs might not always conform to simplistic expectations based on HI, ∑ or count rate. It is critically important to use the environmental corrections appropriate for the instrument used to collect the data.
MNEMONICS/CURVE NAMES
Another obstacle encountered in the use of CN logs is a lack of complete understanding of what various curve mnemonics mean. Mnemonics for formation evaluation tools are different for each service company. It is best to work with the service provider to be sure you understand what curves you are viewing, as this is not always obvious.
The uncorrected limestone porosity index curve from Atlas CN tools is called CN. If any corrections have been applied, the result is called CNC. Corrections that have been applied are typically listed in the log header or history file associated with the data. Depending on the type of data file, additional letters may be added to the CNC name yielding CNCSS, CNCLS or CNCDL. It is important when archiving log data to keep log and header information together. If there is any doubt, it is best to start over with the uncorrected data and redo the environmental corrections. Another Atlas curve name that you might see is CNCF. This designates the Field Normalized curve.
FIELD NORMALIZED NEUTRON CURVES
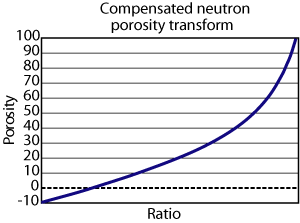
When the first CN logs were being introduced, they were characterized with ratio-to-porosity transforms that went through a water point corresponding to 100% porosity. A typical porosity transform is illustrated in Fig. 5.
 |
|
Fig. 5. A typical CN ratio-to-porosity transform. Notice how the slope increases at higher porosities. This slope change amplifies statistical uncertainties at higher porosity readings such as in shales.
|
|
Historically, laboratory data would have been used to determine the shape of these transforms. The data set might have included four or five limestone formations with porosities ranging from near zero up to about 40% porosity, along with a large water tank for the 100% point. Today, numerical simulations make it possible to produce a data set with as many values as desired over this entire range.
Notice how the transform in Fig. 6 increases in slope as the ratio and the porosity approach the water point. Remember that these higher ratios come from lower count rates which have inherently poorer statistical precision than at lower porosity values. The increased slope of the transform at high porosities magnifies the statistical uncertainty, causing the precision in the porosity curve to appear even worse. This characteristic can cause CN porosity logs to appear very statistical in shales.
 |
|
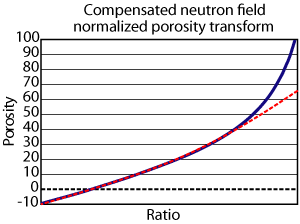
Fig. 6. The field normalized neutron porosity transform is shown in red. The response is identical up to about 36% and remains linear above that point.
|
|
The earliest CN logs were compared to earlier neutron or gamma-ray/neutron logs recorded with various single-detector or sidewall tools. For various reasons, these older logs did not have this highly statistical appearance in very high porosities, and the early CN logs looked significantly different.
There is tremendous pressure in the industry to make new measurements look like their predecessors. This is evidenced by the number of new services that are introduced with optional outputs that emulate the response of an older device. One such emulation resulted in a modified porosity transform for early CN tools that reduced the porosity reading and, consequently, the apparent statistical uncertainty in higher-porosity formations. The transform was essentially the same up to about 36% porosity but was altered above that point. A transform for this type of modified output, or field normalized curve, is illustrated as the red dotted line in Fig. 6.
The response of the field normalized curve, CNCF, is identical to the standard transform up to about 36% porosity for this case, and is linear above that point. The exact point at which the modified or normalized transforms deviate from the standard equations is slightly different for quartz sandstone or dolomite, and is also slightly different for different instrument designs.
Historically, the modified or normalized CN curves have been well accepted, and many older logs present this type of curve. In many cases, as more modern tools replaced older ones, the modified or normalized curves were included as optional outputs, usually with identifiable curve names.
Visually, the difference between the modified or normalized curves and the standard ones is cosmetic and only comes into play above the range of porosities of most reservoir rocks. The curves are useful for visual comparison with older logs. It is probably best, however, to use the standard curves for computer-processed log analysis where crossplots of density and neutron data are used to infer both porosity and mineralogy.
The most critical issue is being sure you know what curve you are viewing. For Atlas, the curve name includes the mnemonic, CNCF. Ask the service company representative about data from other providers.
STATISTICAL PRECISION
All nuclear logs are subject to counting statistics. Although the average count rate over a long period of time might be quite stable, the time at which the next event will occur cannot be determined exactly.
There are several ways of improving the precision, and thus the repeatability, of CN logs. Some log data is recorded on a basis of a series of depth interrupts. Data might, for example, be recorded every half-foot or every quarter-foot. In this situation, simply logging more slowly allows the instruments to record more counts per interrupt and improve the precision. This simple solution is all too often overlooked.
Another alternative is to use filtering. A weighted average of data from several adjacent depth interrupts improves precision. This improvement in repeatability can come at the cost of a loss of bed resolution, but if the sampling rate is higher than the physical resolution of the tool, filtering can provide improved precision with no real loss in bed resolution.
Some logs are recorded vs. time. Data might be recorded every second, or in the case of LWD data, every few seconds. Data recorded in this way is usually re-sampled and put on depth for display and analysis. If the time base is short enough so that data from one or more time interrupts is used for each depth level, the resulting log has essentially the same characteristics as the depth-based data discussed above. It is possible, however, to have a sampling time long enough that an individual time-based sample covers more than one depth. In this case, the precision is determined by the sampling time rather than the logging speed, or rate of penetration. This situation can also cause a loss of bed resolution.
RESOLUTION AND DEPTH OF INVESTIGATION
The depth of investigation and vertical resolution, or in the case of highly deviated wells, the resolution along the borehole, of neutron logs are functions of many factors. To a first approximation, we might consider the source-to-detector spacing to be the primary determining factor of the depth of investigation and resolution of a particular tool. CN tools complicate the issue somewhat because the ratio is derived from two detectors with different spacings. In fact, the different resolutions of the SS and LS detectors can cause “horns” at bed boundaries. To avoid such artifacts, a depth filter is usually applied to the SS count rate to make its resolution match that of the LS detector before the ratio is taken. This produces an overall resolution for the ratio-derived porosity similar to the LS detector, yielding a base resolution that is 18 to 24 in. for a typical CN tool.
Under the right circumstances, it is possible, using enhanced-resolution processing,8,9 to sharpen the resolution back to a point close to that of the SS detector. The resolution might be sharpened to the range of 12 to 18 in. This procedure works for any two similar measurements that have different resolutions, but only under the right conditions. CN instruments use two detectors to correct the apparent measurement for various environmental effects. As long as the environmental conditions change more slowly than the formation bedding, the enhanced resolution processing can work.
There is another factor that must be considered with regard to the resolution and depth of investigation of CN tools. Thinking back to the ideas presented in the section on hydrogen index, it is obvious that the size of the neutron cloud produced by the source in the tool depends on the characteristic lengths Ls and Ld. This means that the depth of investigation, and to some degree the resolution, depends on the formation parameters. In low-porosity formations, the neutrons travel farther, creating a larger cloud resulting in a deeper depth of investigation. In high porosity formations, the neutrons are slowed closer to the source, producing a smaller neutron cloud and a shallower depth of investigation.
SAMPLING RATE
The concepts of statistical precision and resolution should be considered in deciding what sampling rate to choose for data acquisition or processing. In general, a sampling rate that produces more than two samples within the base resolution of the device does not add any additional information. For CN tools even with enhanced resolution processing, this sampling rate is about two samples per foot. Sampling at a higher rate does not actually add any additional information and does not improve resolution. Data that is recorded at a higher sampling rate, however, can easily be resampled to a lower sampling rate, and data recorded at four or even eight samples per foot are commonly produced.
The statistical precision of such high-sample-rate data appears worse than lower-sample-rate data recorded with the same or a similar device. This is because fewer counts are recorded in the shorter time between sampling interrupts. For this reason, care should be exercised when comparing the precision of log data recorded and presented at different sampling rates.
A fair comparison can only be achieved by resampling the data to the same rate. In addition, it is important to resample so no data are lost. A few years ago, a client was complaining about the apparent precision of a nuclear measurement compared with data from a neighboring well. An examination of the data showed that one log had been recorded at two samples per foot, while the other had been recorded at four samples per foot. So they “resampled” by throwing away every other sample!
Selection of the sampling rate can be very important for log data recorded vs. time. Sampling rate and logging speed must be considered together, as time-base data are normally resampled and placed on depth for further analysis. It is necessary to select a sampling time that is long enough for adequate statistical precision but short enough so the sampling time does not limit resolution. Loss of resolution can result if the combination of logging speed and sampling rate result in samples that are large compared to the base resolution of the device. Generally speaking, a longer sampling time can be used with slower logging speed.
These choices are fairly straightforward for wireline logs where the logging speed can be easily controlled. For LWD data, however, the ROP is controlled by the drilling operation. If a high ROP is expected, shorter sampling times should be used. Shorter sampling time produces poorer precision, but these samples can be filtered to improve precision.
CONCLUSIONS
Although CN logs have been around for many years, there is still a lack of understanding among earth scientists of how the instruments work and how best to make use of the log data. Several obstacles to understanding and interpreting neutron logs have been considered, and some techniques for avoiding problems have been proposed.
We tend to oversimplify the physics of the CN measurement by thinking only in terms of HI and ∑. Although these factors are important, they are not the only ones affecting the response, and different tools can respond to different conditions in different ways.
The variety of wireline and LWD CN measurements available in the industry are not all created equal. The response of a specific device in non-standard conditions might be quite different from other tools. Thinking that all CN measurements are the same can cause problems.
A single CN tool can produce a number of curves, and it is very important to understand what the curve names mean. Are you looking at an uncorrected limestone porosity index or at a curve that has had various corrections applied? Has the curve been filtered or has it been altered in some way? Know what data you are looking at and what data to use for a specific application.
The interrelated issues of statistical precision, resolution and data sampling rate must be considered. Slower logging speed almost always results in improved precision and repeatability, but we
cannot always make this choice on this basis alone. Choices of sampling rate and filtering can have an impact on both precision and resolution, but a higher sampling rate does not always translate into higher resolution. Data recorded on a time base presents an additional complication here. It is necessary to consider the time sampling rate along with the logging speed or expected drilling rate to achieve the desired resolution and precision.
Perhaps the most important conclusion that can be drawn is that operating company personnel should work with appropriate service company representatives to better understand CN logs and how to make the best use of their data.
LITERATURE CITED
1 Gilchrist, W. A., Jr., “Compensated neutron log response issues—A tutorial,” Paper S presented at the 49th SPWLA Annual Logging Symposium, 2008.
2 Tittle, C. W., “Prediction of CN response using neutron macroparameters,” Nuclear Geophysics, 2, No. 95, 1988.
3 Ellis, D. V., Case, C. R. and J. M. Chiaramonte, “Porosity from neutron logs I: Measurement,” Petrophysics, 44, No. 6, 2003, pp. 383−395.
4 Arnold, D. M. and H. D. Smith, Jr., “Experimental determination of environmental corrections for a dual-spaced neutron porosity log,” paper VV presented at the 22nd SPWLA Annual Logging Symposium, 1981.
5 Gilchrist, W. A., Jr., et al., “Improved environmental corrections for CN logs,” SPE 15540 presented at the 61st SPE Annual Technical Conference and Exhibition, 1986.
6 Mickael, M. W., et al., “A new compensated thermal neutron tool for porosity measurement,” paper I presented at the 35th SPWLA Annual Logging Symposium, 1994.
7 Valant-Spaight, B., Han, W., Guo, W., and W. Schultz, “Field examples with a slim LWD density/neutron instrument containing a californium 252 neutron source and three neutron detectors,” paper CCC presented at the 47th SPWLA Annual Logging Symposium, 2006.
8 Galford, J. E., Flaum, C, Gilchrist, W. A., Jr. and S. W. Duckett, “Enhanced resolution processing of CN logs,” SPE 15541 presented at the 61st SPE Annual Technical Conference and Exhibition, 1986.
9 Galford, J. E., Flaum, C., Gilchrist, W. A., Jr. and S. W. Duckett, “Enhanced resolution processing of CN Logs,” SPE Formation Evaluation, 4, No. 2, 1989, pp. 131−137.
ADDITIONAL BIBLIOGRAPHY
API, 1959, RP 33, Recommended Practice for Standard Calibration and Form for Nuclear Logs, API.
Alger, R. P., Locke, S., Nagel, W. A., and Sherman, H., 1971, The dualspacing neutron log – CNL, paper SPE 3565 in 46th Annual Fall
Meeting: Society of Petroleum Engineers.
Allen, L. S., Mills, W. R., Desai, K. P., and Caldwell, R. L., 1972, Some features of dual-spaced neutron porosity logging, paper P in 13th Annual Logging Symposium Transactions: Society of Professional Well Log Analysts.
Bush, R. E. and Mardock, E. S., 1950, Some preliminary investigations of quantitative interpretations of radioactivity logs, TP 2780 in Transactions AIME, Vol. 189.
Ellis, D. V., Case, C. R., and Chiaramonte, J. M., 2004, Porosity from neutron logs II: Interpretation: Petrophysics, vol. 45, no. 1, p. 73-86.
Lawson, B. L., Hoyer, W. A., and Pickett, G. R., editors, 1978, SPWLA Reprint Volume Gamma Ray, Neutron and Density Logging. Society of Professional Well Log Analysts, Houston, Texas.
Tittman, J., Sherman, H., Nagel, W. A., and Alger, R. P., 1966, The sidewall epithermal neutron porosity log: Journal of Petroleum Technology, Transactions AIME Vol. 237.
Wilson, B.F. and Wichmann, P. A., 1974, The CN log and the effects of environment, paper SPE-5118 in 49th Annual Fall Meeting: Society of Petroleum Engineers.
|
THE AUTHORS
|
| |
Allen Gilchrist is a geoscientist staff advisor at Baker INTEQ. He manages the Nuclear Center of Excellence in the Strategic Technology and Advanced Research Group of the Baker Hughes Houston Technology Center. He started his career in the oilfield service industry in 1977, after earning his PhD in physics from Texas A&M University. After serving for almost 10 years as a field engineer, synergetic engineer and development engineer for another company, Allen joined Dresser Atlas (now Baker Atlas) in 1987. His work at Atlas, and now at INTEQ, has been primarily in nuclear tool development. Allen is the author of three academic publications, 21 professional technical papers, and eight other articles. He also holds six patents.
|
|
| |
Noel Atzmiller is the senior technical writer in the Baker Atlas Marketing and Business Development Group. Noel began his 26-year career as a technical writer in the petrochemical engineering and construction industry. Since that time he has produced many types of documents for other industries including natural gas transmission, IT and oil/gas. Noel has also authored several articles for corporate and trade journal publications.
|
|
| |
|


