Comparison of more traditional 2D SRME and a 3D GSMP algorithm showed that the latter could remove complex 3D multiples that were previously a barrier to detailed seismic interpretation.
Bruce Webb, Njål Flesjå and Ole Edward Kristiansen, WesternGeco; Annibale Ferrari Vignati, Eni E&P; and Hans Andreas Aronsen, StatoilHydro
This article discusses the basic principles behind the Surface-Related Multiple Elimination (SRME) technique and demonstrates its effect on newly acquired data in August 2008 for Eni and partners in the PL122/159C licenses in the Norwegian Sea. The use of 3D SRME to attenuate multiples in a relatively shallow water-bottom environment is examined. In addition, a 2D SRME is compared with the newer 3D General Surface Multiple Prediction (GSMP) method.
AREA CHARACTERISTICS
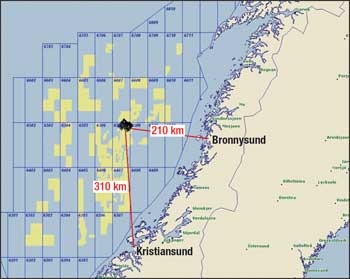
The PL122/159C survey is located in the Norwegian Sea between Norne Field to the northeast and Heidrun Field to the southeast, Fig. 1.
 |
|
Fig. 1. Map of the Norwegian Sea; PL122/159C survey is overlaid.
|
|
The PL122/159C survey in the Norwegian Sea comprises an area of 762 km2 and was acquired for exploration purposes during July to August 2008. Following the design and planning proposal performed by Eni, the survey was acquired, using Q-Marine acquisition technology with 3.125-m receiver spacing. The sources and streamers were towed at shallow depths of 5 m and 7 m, respectively. Ten cables of 4,400-m length were deployed at a separation of 75 m. The acquisition was designed to achieve zero streamer feathering in order to establish a good baseline for future time-lapse surveys. The marine currents were very low in this area, which helped to achieve this goal.
MULTIPLE REFLECTIONS:THE NEED FOR 3D ALGORITHMS
Surface-related multiples are generated on seismic data through the primary wavefield, being replicated and reversed at a strong reflecting interface. There are many multiple regimes set up during towed marine streamer acquisition, the most dominant of which are usually formed in the water column. Discussion will be limited to these. Water-bottom generators of multiples are the interfaces between the air/water and water/seabed.
 |
|
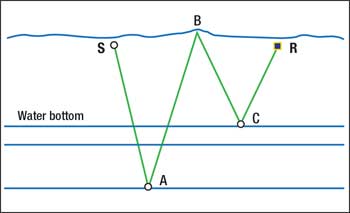
Fig. 2. The component parts of path taken by first-order multiple.
|
|
SRME is acknowledged as a powerful data-driven method of predicting and attenuating multiples from seismic data and is performed in two phases. The first phase involves creating a multiple model. The second phase involves adaptively subtracting the multiple model from the input data, applying filters derived using a least-squares approach. The basic principle of the technique is based on the fact that multiple reflections can be constructed from a number of primary reflections convolved together, and that the recorded seismic data contains all the information required to estimate (or predict) the multiples. This concept is illustrated in Fig. 2 as follows:
- The multiple ray path recorded between source S and receiver R is shown in green.
- The seismic ray that leaves the shot at point S is reflected from a primary reflector at point A.
- The ray is transmitted to surface where it strikes the air-water interface at point B.
- The ray is then reflected downward to the seabed where it is further reflected at point C and finally reaches the receiver at point R.
Hence, the multiple ray can be considered as composed of two primary paths: SAB and BCR. Point B is known as the Downward Reflection Point (DRP). To calculate the multiple model for this simple example using SRME, a source and receiver needs to have been located at position B so that both components of the ray path (upcoming and downgoing) are present in the data set. Convolving traces SAB and BCR provides an estimate of the multiple trace.
To predict multiples using this method, shots and receivers at coincident locations are required. This is not possible in the marine environment due to efficiency and operational reasons. For a 2D implementation of SRME, this harmonization of the shots and receivers can be achieved during processing through interpolation. In addition, the method requires the water-bottom reflection to be recorded and available at zero offset. Extrapolation to zero offset of the data is therefore performed prior to multiple prediction to achieve this requirement.
In practice, it is not known exactly which traces need to be convolved to form the multiple, so all traces are convolved and the multiple model is formed by stacking the convolved traces. For the 3D implementation of SRME, however, the situation is more complex, because the multiples are generated with 3D ray paths that can fall anywhere within a 3D spatial aperture. This is dictated by the complexity of the geology, hence reconstructing traces is much more difficult. For further details, please see Moore and Dragoset (2008).
When the seabed geology has no 3D component, the water bottom multiples lie within the plane of the sail-line direction and can be predicted and attenuated through 2D multiple attenuation schemes, which only require information from single subsurface lines. If the water bottom is complex, irregular or with dip in the crossline direction, the multiples will fall laterally outside the plane of the acquisition sail-line direction and can only be accurately predicted using a 3D approach.
Any irregularities of the water bottom can lead to 3D ray paths. Three-dimensional diffractions can be generated by relatively small irregularities in the seabed and produce multiple diffraction curves in 3D space that cannot be modeled using the 2D assumptions. These anomalies in the seabed are very common offshore Norway and are related to deposits of debris from the ice age in the shallow seismic section. The acquisition is defined in a 3D sense with inlines along the sail-line direction and crosslines perpendicular to the cable spread.
 |
|
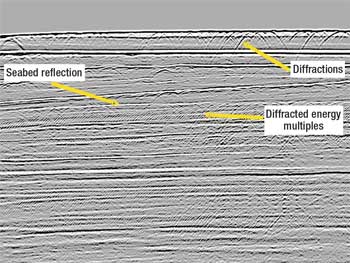
Fig. 3. Inline seismic section with seabed multiple and diffracted energy multiples.
|
|
In the PL122/159C data volume, 3D diffractions are present throughout the whole area. Figure 3 illustrates how this energy appears on a seismic section in the inline direction. The same diffractions have a strong crossline component. This is the reason why 3D demultiple techniques are needed and have been applied following what also was planned by the operator in terms of demultiple approach. Even though most of the multiples in flat-water environments are removed using 2D SRME algorithms, 3D diffracted multiples will remain. It is only a 3D modeling approach that is able to predict and remove them effectively.
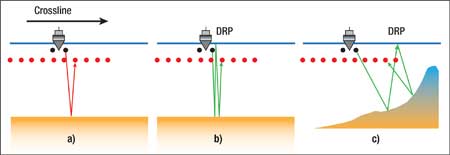
Figure 4a shows a front view of a 10-streamer marine seismic survey line demonstrating the relative positions of the seismic sources and detectors. The primary reflection from the water bottom is shown by the ray drawn in red. Figure 4b shows the ray path of the first-order multiple from the flat water bottom, in green; the multiple ray path is in roughly the same plane as the sail-line direction and can be estimated and removed using 2D demultiple techniques. Figure 4c shows the multiple ray paths in the presence of a complex 3D dipping water bottom. The Downward Reflection Point (DRP) of the first-order multiple now lies outside the plane of the sail-line direction, and accurate multiple prediction requires information from other cables and adjacent swaths of data to accurately predict the multiple energy.
 |
|
Fig. 4. Schematics showing 2D and 3D multiple ray paths: a) primary ray path shown in red, b) 2D multiple ray path, c) 3D multiple ray path. The position of the downward reflection point for the multiple is annotated.
|
|
The multiple prediction method, 3D General Surface Multiple Prediction (3D GSMP), used by WesternGeco enables a high-quality 3D multiple prediction for surveys acquired in areas of complex geology and with irregular seismic acquisition geometry. An important feature of this method is its ability to predict multiples at true azimuth, using the true ray path of the multiple through the water layer. The sensitivity of multiple prediction to azimuth and other issues relating to 3D SRME are discussed by Moore and Bisley (2005). Unlike other implementations of 3D SRME, there is no requirement to regularize, extrapolate to zero offset, or equalize the shot and receiver sampling intervals through interpolation prior to 3D GSMP.
PRE–DEMULTIPLE PROCESSING
As previously mentioned, the acquisition was designed with a 3.125-m receiver sampling. This was maintained during the initial stages of data processing to attenuate noise introduced during acquisition; shot domain processing was performed at a 2-ms sample rate. The subsequent data processing at 3.125-m trace interval also included receiver motion correction, attenuation of swell-induced cable noise and waterborne noise. Shot-by-shot designature using calibrated marine source minimized wavelet distortion arising from variations in source characteristics. Digital group forming—incorporating a digital anti-alias filter to 12.5-m trace interval and temporal resample to 4-ms, direct arrival removal in the tau-p domain—was performed prior to 3D GSMP processing.
THE NEED FOR 3D MULTIPLE ATTENUATION
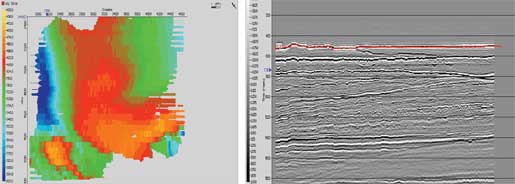
The water-bottom two-way-time map shown in Fig. 5 illustrates the variations of the water-bottom depth. It should be noted that there is a small variation in water-bottom depth across the survey giving a two-way reflection time variation of 200 ms across the survey area. This gives rise to complex multiple reflections and strong multiple diffraction energy. The primary target zone is between 2.5 and 3 sec. and is overlaid by strong multiple reflections.
 |
|
Fig. 5. a) Water-bottom Two-Way-Time (TWT) map illustrating water-bottom complexity. Color indicates TWT relative to average water-bottom TWT across the survey. b) Crossline section from 3D volume. Windowed to show crossline complexity of water-bottom topography.
|
|
 |
|
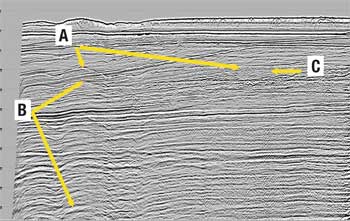
Fig. 6. Inline seismic section. The classes of multiple are indicated by letters and arrows: A—the first water-bottom bounce; B—multiple bounces throughout the section; C—diffracted multiples.
|
|
Figure 6 shows an inline section through the 3D volume. It can be noted that the water-bottom topography does not vary much in this section. The seismic image is masked by strong multiple energy, which was classified into three main categories:
A) The first water-bottom multiple at twice the two-way-time of the water bottom
B) Subsequent higher-order multiple reflections from the water bottom
C) Multiple of diffracted energy.
On inspection, it can be seen that the main multiple energy within the seismic section is the diffracted energy that can only be attenuated using 3D algorithms honoring the acquisition configuration.
3D GSMP RESULTS AND COMPARISONS WITH 2D SRME
The results from 3D GSMP were compared against 2D SRME multiple attenuation. Prior to 2D SRME, the data were interpolated to give a symmetrical shot-and-receiver spacing of 18.75 m. The data were also extrapolated to zero offset to provide a water-bottom reflection at zero offset, which is a requirement of 2D SRME. Prior to 3D GSMP, no interpolation and no extrapolation to zero offset were needed. Figure 7 shows stack sections of the same line with the application of 2D SRME or 3D GSMP.
 |
|
Fig. 7. a) Inline before demultiple. b) Inline after 2D SRME. c) Inline after 3D GSMP. Note the level of diffracted energy that has been removed. The two arrows show how the algorithm has successfully removed the diffracted energy that 2D SRME had not modeled.
|
|
The 2D SRME results shown in Fig. 7b reveal that the water-bottom multiple energy has been attenuated by the 2D approach; however, the diffracted multiples have only been partially attenuated. The 2D scheme has been unable to model this form of energy, which obscures the image at the reservoir level. The 3D GSMP results in Fig. 7c shows that the algorithm has successfully removed both the water-bottom multiple and the diffracted multiple energy. However, some diffracted energy remained within a specific area for which a more aggressive adaptive subtraction would be needed. For obvious logistic reasons, the parameters were universally applied throughout the survey; it was then decided to target this specific area using a common-offset-domain median filter to attenuate.
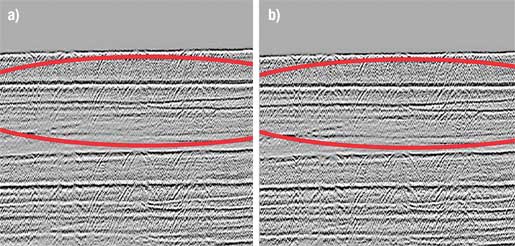
Figure 8 shows the difference plots after the application of either 2D SRME or 3D GSMP. The effect of these demultiple techniques on diffracted multiples shows that even on a fairly flat water bottom such as this, 3D multiple effects are still present and cannot be dismissed in the data processing strategy. Figure 9 highlights the improvements of 3D GSMP on Common MidPoint (CMP) gathers, particularly on the near offsets where some remnant multiples are left after 2D demultiple techniques.
 |
|
Fig. 8. a) Difference plot from an inline after 2D SRME. b) Difference plot from an inline after 3D GSMP. Note the improved removal of multiple diffraction energy.
|
|
 |
|
Fig. 9. a) CMPs before demultiple. b) CMPs after 2D SRME + tau-p mute and Radon. c) CMP after 3D GSMP + tau-p mute and Radon.
|
|
SUMMARY
Multiple attenuation can be very challenging in relatively shallow and flat water-bottom areas where typically the whole seismic section can be obscured by complex multiple energy. The 3D GSMP algorithm can successfully attenuate complex 3D multiples that were previously a barrier to detailed seismic interpretation. The need for 3D multiple prediction was confirmed by the analysis of both 2D SRME and 3D SRME trials. 
ACKNOWLEDGEMENTS
The authors thank PL122 licensees Eni Norge, Dong E&P Norge and StatoilHydro Petroleum and the PL159C licensees StatoilHydro Petroleum and E.On Ruhrgas Norge for permission to publish this article.
BIBLIOGRAPHY
For a more detailed description of SRME and the 3D GSMP technique, please contact the authors.
Moore, I, R. and R. Bisley, “3D surface-related multiple prediction (SMP): A case history,” The Leading Edge, 24, 2005, pp. 270−274.
Moore, I. and W. H. Dragoset, “General Surface Multiple Prediction (GSMP) – A flexible 3D SRME algorithm,” EAGE Expanded Abstracts, Rome, 2008.
Moore, I. and W. H. Dragoset, “General surface multiple prediction: A flexible 3D SRME algorithm.” First Break, 26, 2008.
|
THE AUTHORS
|
| |
Bruce Webb is the Q Project Facilitator for WesternGeco based in Gatwick, UK. Prior to this he worked as a Data Processing Technical Supervisor in Moscow and a Project Leader in Pau, France, among other roles. Bruce joined WesternGeco in July 1998 after gaining his Diplôme d’Etudes Supérieures Spécialisées in geophysics from the université Pierre et Marie Curie, Paris.
|
|
| |
Njål Flesjå is a Staff Geophysicist for WesternGeco based in Stavanger, Norway. Njål joined GECO back in 1979 as a Geophysical Assistant and has since taken on roles as a Processing Supervisor and Group Leader, among others.
|
|
| |
Ole Edvard Kristiansen is a Processing Supervisor for WesternGeco based in Stavanger, Norway.
|
|
| |
Hans Andreas Aronsen is a Seismic Specialist for StatoilHydro in Norway.
|
|
| |
|


