Current running practices can introduce gross errors that must
be taken into account when drilling in areas that have small,
tightly defined targets, such as in relief well drilling.
Chris Henderson, Weatherford Drilling Services, Beijing
Traditionally, there is a cone of error associated with directional surveys taken while drilling with any given survey tool to account for the inherent resolution within and accuracy of the tool. However, there are many other, more significant errors that are recognized to exist by certain sectors of the industry, but not generally accepted and accounted for in practice.
This article does not propose any one solution, or endorse any commercial product. However, when collision prevention and accurate wellbore placement are required, the errors discussed herein should be borne in mind.
REAL HOLE CURVATURE BETWEEN SURVEYS
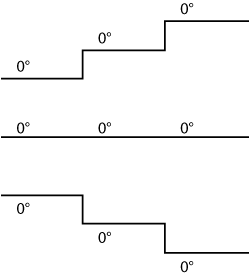
Suppose a man was deprived of sensory input, apart from knowing the inclination of his foot. While walking, this man would be unable to tell if he was walking along a flat surface, walking up stairs or walking down stairs, as long as the surface on which his foot rested was always horizontal, Fig. 1.
 |
|
Fig. 1. Graphical illustration of error inherent in the “minimum curvature” method in MWD.
|
|
The same can be said for directional surveying. It is highly erroneous to assume a constant curve (as with the “minimum curvature” method), when the actual well path is very seldom constant. Failing to describe the well path between surveys can lead to potentially catastrophic errors.
Assuming a steerable motor is in the hole, and the surveys are reported as in Table 1, the natural assumption is that the TVD has not changed. However, if the motor BHA was dropping angle at a rate of 1° per 100 ft and a slide of 15 ft per stand was being conducted to compensate for this, the real situation would be as shown in Table 2. This equates to an error of 0.7 ft per 93 ft of drilled hole, or a little over 7.5 ft per 1,000 ft.
| TABLE 1. Hypothetical survey reported from a steerable motor |
 |
|
| TABLE 1. Actual situation behind hypothetical survey data |
 |
|
The same situation occurs when drilling with the new generation of rotary steerable systems; typically the strength of deflection is changed at a depth between survey stations, so a compound curvature is produced between surveys.
So far there is no officially recognized solution to this problem. However, one method is the use of a “virtual” or “synthetic” survey to reconcile the survey with reality. Even though there is no proof that the inserted survey is correct, it at least gives a more accurate result than the current practice of just recording the survey points.
Another way to better describe the wellbore is with the use of dynamic or “on the fly” surveys. Some types of MWD tools can produce an ongoing survey while in drill-ahead mode. As this data is normally from a single-axis sensor, it is not considered useful as a definitive survey, but is often used by directional drillers to spot trends while drilling ahead. However, this data could be harnessed to describe the wellbore and tied onto the official surveys.
For simplicity, a simple build section is considered here. However there will be similar errors in northings and eastings when the well is changing azimuth, and/or when the well path calls for a compound change in inclination and azimuth.
If the wellbore were to be modeled before drilling, using these “virtual” surveys, a more accurate well path could be described to estimate hole tortuosity. Similar, a more accurate picture could be built up using traditional torque-and-drag models to predict loads on equipment and drilling mechanics scenarios.
BENT SUB EFFECT
When drilling with a steerable motor BHA, the MWD tool is not coincidental with the axis of the hole due to the effect of the bent housing, which tends to offset the tubulars slightly.
This is recognized in low-angle kickoffs and compensated for by performing a “cluster shot” - a series of four surveys taken at the same depth, but with the pipe turned about 90° apart. By vector addition of the four surveys, a bias can be calculated for any particular tool face. By knowing the tool face when the survey is taken, the resulting survey can be corrected accordingly.
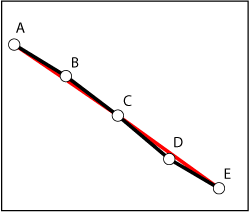
For example, the four MWD surveys given in Table 3 are represented graphically in Fig. 2. The vector addition of these points is (A to E) divided by 4.
| TABLE 3. Example MWD cluster shot |
 |
|
 |
|
Fig. 2. Graphical representation of an MWD cluster shot.
|
|
Mathematically this can be expressed as:
- X1 = Incl. 1 x sin Azi. 1 (Shot 1)
- Y1 = Incl. 1 x cos Azi. 1 (Shot 1)
- X2 = Incl. 2 x sin Azi. 2 (Shot 2)
- Y2 = Incl. 2 x cos Azi. 2 (Shot 2)
- X3 = Incl. 3 x sin Azi. 3 (Shot 3)
- Y3 = Incl. 3 x cos Azi. 3 (Shot 3)
- X4 = Incl. 4 x sin Azi. 4 (Shot 4)
- Y4 = Incl. 4 x cos Azi. 4 (Shot 4)
- X = (X1 + X2 + X3 + X4) / 4
- Y = (Y1 + Y2 +Y3 + Y4) / 4.
These values give us a final compensated survey of:
Final inclination =  Eq. 1 Eq. 1
Final azimuth = arctan (X / Y) Eq. 2
If Y < 0, 180° must be added to the final azimuth. If X and Y are both zero, then the well is vertical.
The actual tool face angles do not factor into the final calculation, but should be recorded to ensure that the tool faces are spaced sufficiently to give a meaningful spread in the recorded surveys.
In the example of Table 3, the final compensated survey has an inclination of 56.08° and an azimuth of 124.76°. The difference between this calculation and taking a survey at an arbitrary tool face is obvious.
By taking a cluster shot for every 10° of inclination, a bias can be built into the surveys to compensate for the axial misalignment from the steerable motor bent housing assembly.
Some operators choose to “sag correct” the directional surveys in order to account for the misalignment of the MWD tool axis due to the placement of stabilizers, Fig. 3. This correction does not take into account the effect of the angular position of the bent housing tool face, and so only partially corrects the inclination measurement.
 |
|
Fig. 3. “Sag correction” is sometimes used to partially account for the misalignment of the MWD tool axis due to the placement of stabilizers.
|
|
STRETCH DUE TO PIPE WEIGHT
A string of drilling tubulars will stretch due to its own weight. As long as the modulus of elasticity is the same and the elastic limit of the pipe is not exceeded, the grade of pipe should have no effect on the strain (stretch) for a given stress (weight applied). Buoyancy does not affect modulus of elasticity, although it clearly affects the stress (weight) on joints of pipe higher in the hole. However, buoyancy relative to the weight in air may be considered as having a piston effect on the tubulars.
To calculate the total length change, the stretch of different sections should be calculated and added. The stretch of each section is calculated by:

where Loriginal is the original pipe length, Wave is the average weight on any given joint (equal to half the total weight of the pipe),  is the modulus of elasticity and Acs is the cross-sectional area of the pipe. The latter is calculated by: is the modulus of elasticity and Acs is the cross-sectional area of the pipe. The latter is calculated by:

For example, for 5,000 ft of drill pipe weighing 19.5 lb/ft, the total weight is:
5,000 ft x 19.5 lb/ft = 97,500 lb.
The average weight is half of this value, or 48,750 lb, and the cross-sectional area is 5.58 in.2 Assuming a modulus of elasticity for steel of 30 million psi, the total length change is:

If the same length of drill pipe included 500 ft of HeavyWeight Drill Pipe (HWDP, 50 lb/ft) and 100 ft of 8-in. drill collars (150 lb/ft), the total weight would be 137,500 lb for an average weight of 68,750 lb, and the new length change would be 2.05 ft.
There is also a piston effect to take into account. Pressure differential acts on cross-sectional areas, causing a section to shorten or lengthen according to the equation:

where Fdiff is the differential force, calculated as the product of the hydrostatic pressure on the inside of the pipe and its internal area minus the product of the hydrostatic pressure on the outside of the pipe and the external area, or

TEMPERATURE EFFECTS
Since the wellbore is always at a temperature above ambient, thermal expansion of the pipe will take place in the hole.
From engineering tables, the expansion of steel is equal to the original length times the expansion coefficient times temperature change. A typical expansion coefficient for steel is 13 million.
By using the above equation, an average elongation would seem to be 0.86 in. per 100 ft of pipe per 100°F temperature increase.
So the total expansion due to thermal effect, in feet, will be:

where temperature change ΔT (in °F) is calculated as the difference between the MWD temperature at survey depth - which we can assume constant since the tool is in circulating mode - and the ambient temperature, which is the temperature on deck when the pipe is measured.
STRETCH DUE TO HYDRAULICS AND BUOYANCY
According to the free-point-when-stuck formulae accepted by the industry, the free point of pipe is:

where Fpull is the pull force on the pipe, CFP is the free point constant, defined as the cross-sectional area Acs times 2,500, and pipe stretch ΔL is in inches.
In a drilling situation, the pull force on the pipe can be equated to the buoyant weight of the BHA (times the cosine of inclination in a tangent section).
Solving Eq. 8 for stretch gives:

Therefore, in a drilling situation the pipe stretch is:

where LBHA is the length from the top of the BHA to the surface and WBHA, buoy is the buoyant weight of the BHA.
Breaking down the three sections of hole:
- La is the length of pipe to the kickoff point
- Lb can be estimated as the length of build section times the cosine of the tangent divided by 2
- Lc is the length of pipe in the tangent multiplied by the cosine of the tangent angle.
Therefore, the correction to be made to survey depth is:

As Acs is known for both drill pipe and HWDP, they can both be modeled.
Under the forces involved, and the smaller lengths of the BHA, it can be assumed that the BHA component stretch is negligible. It should be noted that the above calculations ignore friction factors and unusual hole conditions.
AXIAL MISALIGNMENT OF PIPE IN THE WELLBORE
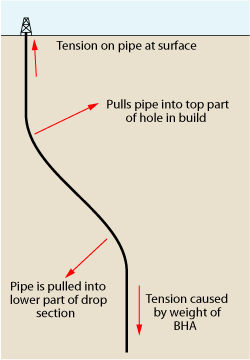
When taking a survey, the drillstring is in tension, so the drill pipe is pulled against the hole wall in build sections (on the high side of the hole) and in drop-off sections (on the low side of the hole).
Across a theoretical tangent section, the pipe will either be pulled diagonally across the hole or lie flat along the bottom of the hole if there is no drop-off section, Fig. 4.
 |
|
Fig. 4. Across a tangent section, drill pipe is pulled diagonally across the hole between the build section and the drop-off section.
|
|
The radius of curvature during build sections is:

where Δbuild is the rate of build, and the arc length of the build section is:
where  is the difference between the two inclinations (before and after the build section). is the difference between the two inclinations (before and after the build section).
The length of the arc can be equated to the course length between surveys. By finding the difference in inclination, an initial theoretical radius of curvature can be calculated. By then substituting this theoretical radius of curvature minus the borehole radius into Eq. 13, a correction factor can be derived that can be applied to the course length.
To offer an example, going from 0° inclination to 0.98° inclination with a 17½-in. borehole, this method estimates an arc length correction of 0.49 ft in 514.60 ft of MD, which yields a corrected length of 515.09 ft. To extrapolate, the correction is 0.95 ft per 1,000 ft of drilled hole. The radius of curvature is 30,115 ft.
DEPTH CORRECTION FOR RELIEF WELL DRILLING
One of the most exacting applications in directional drilling is relief well drilling. I have personally been involved in two successful relief well operations in recent years, both of which involved the use of magnetic ranging tools.
However, if the above MWD/LWD corrections were conducted in conjunction with the ranging tools on these wells, it is likely that time and money could have been saved in intersecting the target well.
If magnetic ranging tools are run on wireline, another set of depth corrections comes into play. It is well-known that at the end of logging runs there are records of both “loggers’ depth” and “drillers’ depth.” When the tool is a magnetic ranging tool, depth becomes even cloudier.
On a wireline logging run in Indonesia a little over 2 years ago, by applying the calculations above to the drilling BHA, and by applying the correction for axial misalignment in the wellbore to the wireline depth data, the difference between logging and drilling depth was reduced from a little over 36 ft to just under 3 ft in a well of 13,900-ft total depth. This total correction represents an error reduction from 0.26% to 0.02% of the total depth.
The one wildcard in the depth corrections for wireline is correction for cable stretch, as data on the cable is not readily available. (For more information on wireline depth error, see “Are wells perforated on depth today?” in World Oil, January 2008, pp. 61-63.)
By analyzing the target well data in terms of surveys, BHA components and MWD logs (temperature, etc.), a more accurate file can be generated on the final wellbore position at which intersection must take place. By then applying the same logic and analysis models to the relief well, the wellbore can be positioned closer to the target well before the expensive ranging tools are deployed.
There will always be a cone of error around any actual well position, but by applying the above corrections, this position can more accurately be determined for purposes of relief well operation. The use of mathematical models will never (and should never, due to the number of variables involved) replace the tools in the field; however, using these models balanced with good sense and judgment can save a great deal of time to accomplish a successful intersection.
CONCLUSION
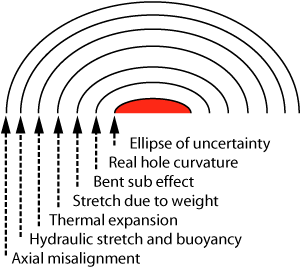
Though each of the corrections discussed here may seem small when taken individually, their cumulative effect can be quite significant, Fig. 5.
 |
|
Fig. 5. Summation of potential survey errors.
|
|
Service companies have invested lots of time, effort and financial resources in the accuracy and precision of their MWD tools, but current running practices can introduce gross errors that put all of this precision to waste.
I am not aware of any company or commercial product that handles these errors at present, but suggest that there is a need to take these errors into account when drilling in areas that have small, tightly defined targets.
As a proof, I suggest that operators consider “retro-correcting” surveys in areas where the geology has been a surprise. The only factor that cannot be calculated after the drilling phase is the bent sub effect, because that needs to be done in “real time” while drilling the well. Perhaps it was not the formation that moved after all, but errors in the surveying practice. 
Editor’s note: Readers interested in more information should contact the Wellbore Positioning Technical Section of the Society of Petroleum Engineers at technicalsections@spe.org.
|
THE AUTHOR
|
| |
Chris Henderson is the Directional Drilling Coordinator for Weatherford Drilling Services in Beijing. He has over 39 years of experience in the oil industry, of which he has spent 26 years directly involved with directional drilling, and has worked for both an operator (Royal Dutch Shell) and various service companies. He has Shell Round One and Round Two drilling certificates and holds a BSc in mechanical engineering from Salford University in England. Contact: christopher.henderson@ap.weatherford.com.
|
|
|


