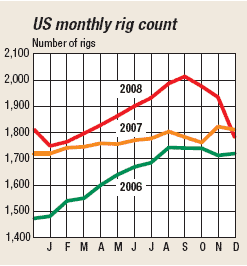
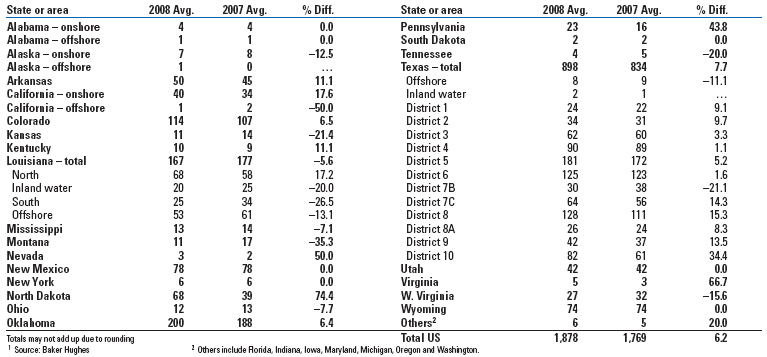
Last year started out with 1,749 rigs in the US, peaked in September with 2,014 rigs and finished the year with 1,782 rigs, giving an average of 1,878, which is a 6.2% increase for 2008. Looking at the monthly rig count, a sharp dropoff was seen beginning in December and continued into January, with rigs falling to 1,574 at the start of 2009. Last year we forecast an average of 1,854 for 2008, so we were off by 24. The rig count for 2008 grew the most in Texas, with a 64-rig jump to 844. North Dakota saw the largest percentage increase over 2007, running 74.4% more rigs in 2008. Over the past two years, US rig growth has slowed, and it appears to be at an end in 2009. Looking ahead, we are predicting the rig count to decrease 21.5%, to an average of 1,478 rigs by the end of 2009.

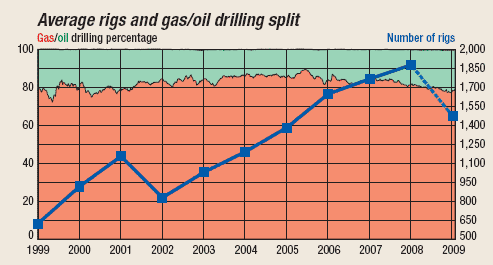
Directional drilling of gas wells fell off toward the end of 2008, averaging 80.2% in the first half of the year and 78.5% in the second half, averaging 79.3% for the year. The gas/oil drilling split has remained stable over the past few years. However, the percentage of gas wells drilled fell in 2008, with the percentage of oil wells reaching its highest level since 2001.
TABLE 1. Summary of acid tunneling jobs performed to date
Click table to enlarge |
 |
|
According to the October ReedHycalog rig census, the total number of US rigs increased by 259 in 2008, boosting the total fleet by another 9% to 3,076 rigs. Utilization dropped to 61% from 85% in 2007, using Baker Hughes (BH) or Smith International’s rig counts. RigData’s 2008 yearly average rig counts yield a higher utilization rate of 75%. Obviously rig-counting methods vary widely, and we understand that BH and Smith are conservative counts. Utilizations rates are expected to continue to decrease again in 2009 due to stagnant rig activity and World Oil’s 1,478-rig-count forecast, the first year-to-year decrease in six years. Utilization by region had mixed results, with seven regions registering declines, two regions showing slight increases, and one remaining steady. The Northeast region and California saw the largest decline.


According to ODS-Petrodata, floating rig utilization in the Gulf of Mexico held steady at about 98%, with about 34 rigs running. Jackup utilization in the GOM jumped up to 80% in the first part of the year, reversing the downward slope it has taken since 2004. However, utilization fell to 70% in the second half, with about 50 rigs running. Despite a steep dropoff of rigs in other areas, we expect activity in the GOM to hold steady in 2009 as long-term deepwater projects continue.
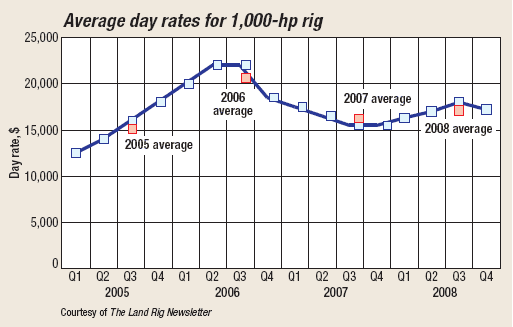
According to The Land Rig Newsletter (LRNL), day rates for a typical 1,000-hp rig in the South Central US region increased to an average of $17,125, an increase of 5.4% from the 2007 average of $16,250. Day rates peaked for the year in the third quarter at $18,000; they could continue their downward trend into 2009 as utilization drops further.
These numbers, from Baker Hughes, represent only those rigs that are significant consumers of oilfield services and supplies. It does not include very small truck-mounted rigs or rigs that can operate without a permit. However, non-rotary rigs such as coiled tubing and workover rigs drilling new wells may be included. To be counted, a rig must be on location and be “actively” drilling. A rig is active from the moment the well is spudded until it reaches TD. Rigs that are in transit, rigging up, performing workovers, completions or production testing are not counted. LRNL day rates represent a spot market base rate without fuel or other add-ons.
|


