Two wells had improved production after timed-explosive dilation.
Igor Skakovsky, Sigor Corp.; and Marcela G. Torres, Pemex
During 2005 and 2006, a test of a new well completion and stimulation device was conducted in two wells in the Paleocanal Chincontepec, which is divided into several operating fields. The purpose of the tests was to seek well productivity improvement by increasing the test wells’ rock formation permeability and drainage areas.
The principle applied is based on shock wave interaction, where shock waves of consecutive explosive loads (stages) are super-positioned upon each other. The resulting pressure-wave overlap is controlled by time delay between each stage. Time delay between each stage varies and depends on many factors including, but not limited to, a rock’s physical properties. Depending on the application, a tool may contain two to five stages. When designed properly, it will create multiple macro-fractures, dilating rock away from the wellbore, and connect macro-fractures to the dilated areas. From experience, dilation is observed at a large distance from the wellbore, but the challenge is to connect macro-fractures to all dilated areas. One of the newest developments in the new tool is the calculated time delay between stages.
DILATION THEORY
Dilation is permanent deformation produced in rocks that have been subjected to non-uniform dynamic stress. The main effect is an increase in the rock’s permeability by increasing porosity through a series of micro-fractures, which remain stable over time.
Gun powders or other solid propellants are not capable of dilating rock because gas pressure, P, builds at a relatively slow speed (static loading), where peak amplitude does not exceed 50 MPa. Some propellants have been tested at maximum pressure of 83 MPa, but usually no more than two, bi-directional fractures are created. Physical properties of bedrock are not homogeneous and vary in strength through its stratigraphic height, so fracturing begins where gas finds weak points.
As the initial fractures propagate (by Lame’s problem), gas is consumed faster than propellants can generate it. As a result, no additional fractures can be created. Gas consumption will continue until pressure decreases and fracture growth stops (Lame’s law for radial stress distribution). For simplicity, the mathematical expression assumes that bedrock has no initial stress:

where r is an arbitrary distance from the center of a cavity (wellbore) and rcav is the wellbore radius.
According to Obert,1 with static loading the area of rock dispersion is limited to rd, where  is the bedrock strength): is the bedrock strength):

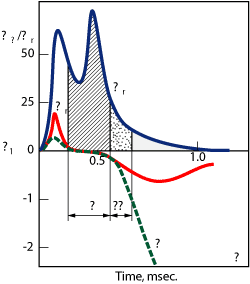
In contrast, dynamic loading (Fig. 1), with the same amplitude (high explosives with shock wave super-positioning) applied to the same surface, creates irreversible changes in rock properties beginning at 3–5% of the rock’s strength limit:

where k, kfi and m are experimental factors, sr is the maximum principal stress, d is an arbitrary distance from the center of a charge to the point where the maximum principal stress was measured, mch is the mass of the charge and I is the explosion’s index of symmetry.
 |
|
Fig. 1. The dynamic stress state (two-stage device), shows the prolonged, properly timed and delayed detonation, where, in a short period of time, rock relaxation occurs with initiation of rock dilation u = z (dotted line); differential stress grows rapidly with dilation, z, and it is most effective at -1.0.
|
|
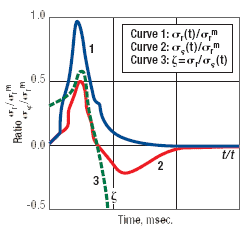
Applying the same rules to a single explosive charge or to multiple charges with no proper timing, results are different. See the yield chart from a single charge, Fig. 2.

 |
|
Fig. 2. The stress state by a single charge detonation of a common explosive falls off quickly.
|
|
The value of the shear-stress relaxation modulus, , varies from 0.34 to 0.58 with an average value of 0.4. This is slightly higher than its value under effective normal stress; in other words, the rock is in an elastic state and is not dilated by use of a single high-explosive charge or multiple charges, when the proper time delay between charges is absent. , varies from 0.34 to 0.58 with an average value of 0.4. This is slightly higher than its value under effective normal stress; in other words, the rock is in an elastic state and is not dilated by use of a single high-explosive charge or multiple charges, when the proper time delay between charges is absent.

where v is Poisson’s ratio.2,3
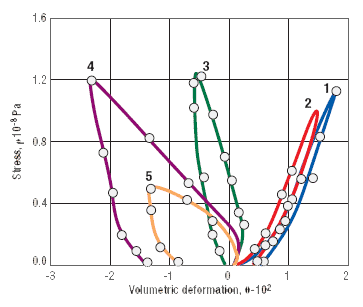
In Fig. 3, showing the decline of compressive deformation at its zero values, the rock’s dilation,  , begins to grow with a negative sign and will be most effective at -1.0. , begins to grow with a negative sign and will be most effective at -1.0.
 |
|
Fig. 3. Volumetric deformation in sandstone varies with strength from 85.5 to 106 MPa. Curves 1–3 represent dilation initiated where z values equal 1, 0.165 and -0.05, respectively; curves 4 and 5 represent dilation progression with increases in z values of -1.25 and -2.35, respectively.
|
|
Appropriate application of the exact amount of explosives and detonation timing is the key to optimizing this stimulation technique. The residual positive effects of using the device will likely last longer than four years.
CASE STUDIES
To carry out the test, the Pemex personnel, along with representatives from GIMSA and Sigor Corp., selected well candidates from Agua Fria (AF), Coapechaca (COA) and Tajin Fields in Paleocanal Chicontepec. Selection was made from field location, pressure data, rock formation, historic production intervals and the physical rock properties of a core sample from well COA-502.
Wells were selected and laboratory studies were completed from the one core sample on the assumption that Sand 90 properties would be close to Sand 60 properties in the two selected wells. Tests included core analysis for geomechanical properties, simulations and calculations. Diagnoses gave results for the core sample (74% sand and 26% shale), allowing explosives type, detonation sequence and timing to be chosen.
Wells AF-569 and COA-875 were selected for a test of the new device, SWTorpedo, in new productive intervals that had never been treated. Estimation of rock properties for both wells had to be made.
Sandstone formation permeability in Paleocanal Chicontepec is very low, and production drive is related to gas expansion. The deposit’s original pressure is very near the bubble point, which has led to an accelerated production decline of the field. The field also has a biconvex oil distribution and poor continual stratification (disconnected sand bodies).
The COA-875 well has continuity in its main markers. It has an extensive sand section, which favors better porosity and permeability from larger grains. The field was producing from Sand 70 prior to the test and had low pressure; Sand 60, which was never treated or produced, presented an opportunity for the completion/stimulation test. The sand’s permeability in COA-875 was 0.2 mD before the test. A neighboring well, COA-877, was pressure tested and registered 208 kg/cm3 (2,959 psi) at 1,605 m for Sand 60.
For well AF-569, the gamma ray log showed channel sequences and lobes. Stratification of Sand 80 and Sand 60 proved a degree of lateral correlation between AF-549 and AF-569, and showed improved properties and thickness toward well AF-549. The physical property analysis of Sand 80 showed moderate values of porosity and permeability.
The net thickness of Sand 60 in this well is 15 m with estimated permeability of 0.1 mD, but the oil volume in the sand requires fracturing to produce the necessary yield. The test of the new device was recommended for Sand 60.
Pressure for AF-569 was taken in 2003 and found to be 210 kg/cm2 (2,981 psi) at 1,658 m for Sand 60, when the lower producing interval was not plugged.
TEST DEVELOPMENT
The Sand 60 interval selected in AF-569 was from 1,635 to 1,658 m and for COA-875 was from 1,675 to 1,695 m. No neighboring wells produce from Sand 60 for production comparison. In addition, there were no core samples from the sand, so core analysis from Sand 90 in COA-502 was used to design the stimulation device.
Five devices were designed, two for COA-875 and three for AF-569. Each device had an average length of 2.5 m and an external diameter of 90 mm (3½ in.). For COA-875, the first device would be placed at 1,688 m and the second at 1,679 m. For AF-569, the first device would be placed at 1,652 m, the second at 1,644.5 m and the third device at 1,637 m.
To carry out the test, the well must be prepared before detonation. The production tubing must be removed; the entire interval must be perforated with 13 to 20 shots per meter; and the well must be loaded with diesel fuel. This is then topped with water/brine, and the total fluid level must remain 30 m below ground level to prevent any fluid spills. Then, devices can be placed and detonated.
To prepare the wells for testing, it is necessary to pull out the puncher and decompress the well, controlling it with low-density fluid (0.88 g/cc). The BOP’s third valve must be changed by installing an “H” valve, and then the 27⁄8-in. production tubing can be pulled. The previous production interval can then be isolated with a retainer and K-1 cement.
After replacing the low-density fluid with diesel, the BOP can be changed back and a frac stack installed before testing the assembly at 4,000 psi.
Using coiled tubing, the chosen interval is perforated by a 2½-in. perforator with 20 shots per meter at 60° and checked for pressure. Neither of the wells showed pressure, so the nest step was to wait for the detonation test.
TEST SEQUENCE
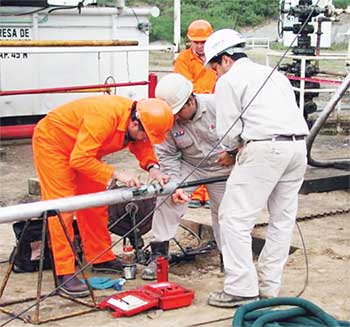
The device consists of an aluminum cylinder 2.44 m (8½ ft) long and 90 mm (3½ in.) in diameter with an average of 12 lb of PentaErythritol TetraNitrate (PETN) explosive placed within the cylinder, Fig. 4. Once the device is ready, the tool head is attached, a wire passed through it, the electrical detonator connected and a detonation cord secured.
 |
|
Fig. 4. The tool is armed once the electrical wire and detonator are connected.
|
|
Before conveying the tool into the wellbore, it is connected to the wireline, and then a crane suspends it below the surface. While the tool is suspended, bags filled with dry sand are attached to protect the casing and wireline, and to localize the detonation.
Once the tool is detonated, the aluminum tool head, which holds the device at the desired interval, is recovered. It is the only part that is usually recovered. The head undergoes physical deformation after the tool is detonated. It is designed to cushion the detonation by shrinking in length and expanding slightly in diameter. The dilation deformation area reaches outward about 8 m (27 ft) from the wellbore.
AGUA FRIA-569
Between Dec. 4 and 6, 2005, as a part of the preparation of AF-569, the well was controlled with KCl brine at 1.03-g/cc density. The valve body was replaced, and then the brine was displaced with diesel on Dec. 7.
On Dec. 19, two devices were fired, at 1,652 m and 1,644.5 m in Sand 60. After the second shot, a wireline unit began retrieving the tool head. It was retrieved too quickly, and the head became trapped in the 5-in. casing. The crew proceeded to calibrate, to verify the resistance depth and to confirm that the depth range was free. Then, they were able to continue with the third shot and complete the test. Because resistance was above the top of the perforated area at 1,632 m, detonation of the third device was suspended.
On Dec. 20, head recovery began at 1,644 m. Two days later, the well was induced with nitrogen by Coiled Tubing (CT) in an attempt to move the trapped part. After induction, the well flowed, producing 300 bopd with 12 kg/cm2 of pressure on a 4-mm choke, in spite of the trapped part. On Dec. 26, the well was controlled using KCl brine for 72 hr to build up pressure, Table 1.
| TABLE 1. Production record from well Agua Fria-569 after testing the device. |
 |
|
On Jan. 2, 2006, a CT unit was installed to recover the head. Finally on Jan. 11, the obstruction was eliminated. However, the well did not flow. The well was opened and induced with CT and nitrogen over the next two months with limited effect. Gauge runs in the hole showed some restriction and impression blocks indicated some metal in the hole.
An injection test was performed on March 21 with Pi = 320 psi, Prupt = 1,881 psi and Pmax = 8,680 psi. The well was full in 20 min., was opened but did not flow; then it was closed. After a pneumatic pump was installed, the well was successfully put online on April 25. Initial production was 211 bopd from 1,635–1,685 m (Sand 60) and 1,695–1,718 (Sand 90), which was previously scheduled for abandonment.
COAPECHACA-875
On Dec. 13, 2005, as a part of the well preparation, COA-875 was controlled with low-density fluid, 30 m below the ground level. On Dec. 16, after installing the valve body, the fluid was replaced with diesel fuel at 25 m below the ground and stimulation was deferred to await results from the AF-569 test.
On Dec. 22, two devices were shot in Sand 60 at 1,688 m and 1,679 m, as planned. During detonation of the second tool, a pressure increase on the surface manometer registered 7 kg/cm2, which dropped to zero in a few moments. With the well almost full of fluid, no flow was noticed.
The next day, the well was induced using CT with nitrogen. Oil flow began immediately, accumulating 8 m3 (50.4 bbl) of oil in two hours. Nitrogen was released, and the pressure dropped to zero. On Dec. 30, the BOP was removed, the valve body placed and flow equipment lowered into the well.
During January 2006, a third device was scheduled to be run in the well, but its delivery was delayed by customs. With expected delivery falling outside the original program dates, the operation was cancelled.
Another CT nitrogen induction was done on Feb. 2. The well flowed until Feb. 10 through a 5-mm choke, registering an average wellhead pressure of 16 kg/cm2. On Feb. 11, the well was controlled with KCl and monitoring equipment was installed for 72 hr.
The well was not flowing according to the program’s schedule. So, after working on the well for a month, Pemex decided to start the hydraulic fracture on March 5 in Sand 60 from 1,675 to 1,695 m, opening a 4-mm choke at 1,400-psi initial pressure until pressure dropped to zero. The well was induced with nitrogen, but did not flow. On March 13, the well was opened and started flowing through a 4-mm choke, recovering 24 bopd with 60 psi of pressure.
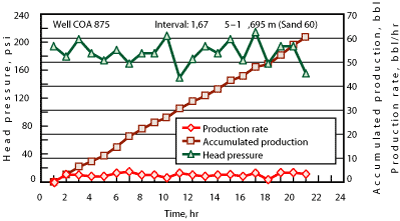
After the conversion to a mechanical pump on March 26, initial production from both operating intervals, Sand 60 (1,675–1,695 m) and Sand 90 (1,720–1,765 m), yielded 175 bopd, Fig. 5.
 |
|
Fig. 5. After testing the device, the production history from COA-875 shows consistent pressures and steady production.
|
|
TEST RESULTS
For the AF-569 well, before the test, a comparative analysis of hydraulic fracturing and completion/stimulation with the new device was performed on two-dimensional Pipesim software. For this case, the value of the permeability of the well stimulated with the device is double that of the hydro-fractured case; the pressure level was estimated at 200 kg/cm2. Sensitivity for the fracturing case was prepared using three chokes (4.6 to 8 mm) and three fracture lengths: 50, 100 and 150 m. The simulator program cannot set exact parameters for completion/stimulation with the new device, since the drainage area produced is modified by a network of the fractures that are not in a simple, flat, bi-directional orientation, and drainage area would be equal to an outer area of an ellipse. There is no direct comparison to hydraulic fracture.
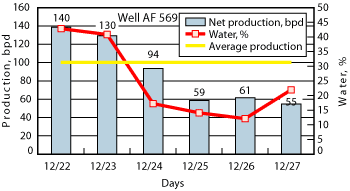
Because data is usually taken after nitrogen induction, on Dec. 22, AF-569 was induced with CT and nitrogen with an increase in production (300 bopd), with 12 kg/cm2 pressure on a 4-mm choke. On Dec. 23, the well registered 28 kg/cm2 in the head with oil production of 40 m3 (252 bpd) without a choke. The well was connected to the tank, applying a 4-mm choke to reduce the flow from 40 m3 to an average of 7 m3 (44 bopd).
The well stabilized at 11 m3 (69 bopd) until Dec. 26, 2005. The well flowed with 4-mm choke for five days with an average production of 90 bopd, a pressure of 11 kg/cm2 and a 25% watercut, Fig. 6. The original permeability of Sand 60 in AF-569 was estimated to be 0.1 mD.
For COA-875, simulation comparative analysis was performed in the same way with a similar conclusion. The physical data for both simulations is such that initial production after using the new tool is similar to the scenario of a small hydraulic fracture (50-m fracture length with a 4-mm choke).
 |
|
Fig. 6. Production from AF-569 fluctuated after CT nitrogen induction on Dec. 22, 2005.
|
|
 |
|
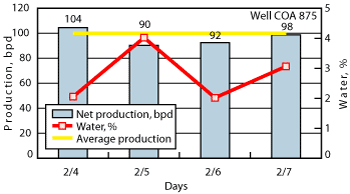
Fig. 7. Production from COA-875 after stimulation and dilation with the new device was fairly steady.
|
|
Similar results were obtained after nitrogen induction was completed on Feb. 2, 2006. The well flowed from a 5-mm choke over four days, with an average oil production of 96 bopd, 16-kg/cm2 pressure and a 2% watercut, Fig. 7.
On Feb. 11, a 72-hr continuous production measurement was conducted. The measurements showed an average recorded pressure of 13 kg/cm2 with production of 60 bopd and stable average watercut of 5%. The choke was set at 5 mm and the accumulated gas averaged 21 m3/m3 (120 ft3/bbl) of fluid. The laboratory analysis of a fluid sample confirms that oil originating from Sand 60 maintains the field’s average characteristics with density of 0.9144 g/cc and 1.8% water.
On Feb. 25, maximum pressure increased to 89 kg/cm2 and maximum temperature was 78.44°C. The original permeability of Sand 60 in COA-875 was estimated to be 0.2 mD, and after final evaluation, the test pressure was 123 kg/cm2 and permeability became 1.34 mD.
CONCLUSIONS
Pressures predicted by the simulation and the expected pressure of 80 kg/cm2 are lower than the well’s actual pressure after performing the test; well pressure was 123 kg/cm2. Both wells flowed after completion/stimulation with the new device, which indicates that the technology improves the initial fluid flow (probably by increasing the rock’s permeability and enlarging the drainage area).
For future technology tests and practical application, operational procedures, including well control fluids, must be improved to guarantee successful application. A detailed operational procedure must be generated and strictly implemented, so that recementation does not occur.
Because of the strategic importance of the Paleocanal Chicontepec and the Integral Assets Poza Rica for Pemex, we continue to search for technological solutions that will improve field and well productivity and help Pemex reach the desired production level from individual wells, according to the business plan. Therefore, it is necessary to continue tests of the new device in the other wells and in other fields. 
LITERATURE CITED
1 Obert, L., “Brittle failure of bedrock/Failure,”Peace Magazine, 1976, pp. 59–128.
2 Mykhalyuk, A., “Bedrock under uneven dynamic loading,” Naukova Dumka magazine, 1980, p. 154.
3 Mykhalyuk, A., “Torpedo and impulse hydraulic fracturing of a productive interval,” Naukova Dumka magazine, 1986, p. 208.
|
THE AUTHORS
|
 |
Igor Skakovsky earned a petrochemical process engineering degree from Severodonetsk Chemical and Mechanical Institute in Ukraine. Since 2003, he has led experimental research in new methods of forecasting rock dilation and advanced techniques of explosive fractures. His research has resulted in two publications and one patent. Skakovsky is the founder of Sigor Corp. and has been the President and CEO since its inception in 1991.
|
|
| |
Marcela G. Torres earned an MS degree in petroleum engineering from Universidad Nacional Autónoma de México. She began her career working at the Drilling and Fracturing Fluids Laboratory of the Mexican Petroleum Institute in Veracruz, Mexico, analyzing fracturing fluids and proppants. In 2005, she joined Pemex as a supervisor of contract DUOSPI-009/03-P “Obras y Servicios Integrados para la Explotación de Yacimientos de Hidrocarburos en el Paleocanal de Chicontepec.” She presently works for the Activo Integral Altamira Group as a Productivity Group Leader.
|
|
| |
|


