Developing a system-level approach helped engineers understand and resolve problem control lines, to avoid significant repair costs.
Scot T. Ellis, George Siappas and Angus Colyer, Chevron; and Robert F. Mitchell, Halliburton
In general, downhole control lines are not subject to routine failures, but a study of downhole completion failures identified them as a principal failure cause. The cost of recovering downhole completions to repair control line failures warranted the investigation of equipment reliability including control lines, clamps and fittings.
Early work indicated that the components were not engineered as a system, but rather as individual components driven by the hardware interfaces of more substantial components at the physical limits of the system. Hence, the mechanical attributes of the components collection had never been closely studied. To fill this knowledge gap, a system-level approach was developed to understand and resolve the problem areas. This article details that process.
An integrated team of completions and subsea engineers found that the control line and its components may not be engineered to the same rigor as the rest of the subsea and completion system. Preliminary findings of engineering procurement and quality processes confirmed this.
Analysis based on intervention cost for the control lines revealed that failures alone could amount to about $150,000/well-yr, based on four control lines per well. Data for the analysis included: 4,000 control line items, 21,000 service years, 64 failures, 10 known causes and 54 unknown causes.
This data produced a mean-time-to-failure of 328.125 yr/failure (a failure rate of 0.003). Assuming a $12.5 million intervention cost for fixing failed control lines (rig rate plus equipment cost), this works out to $38,000/line-yr without considering the cost of lost production.
As a result of the study, a system-level approach was used to:
- Identify failure reasons
- Identify the loads experienced
- Test components to establish working limits
- Verify results through analytical modeling.
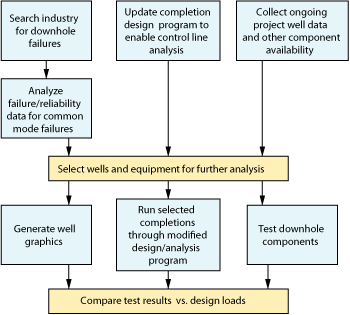
The goal was to provide recommendations and implement simpler, more reliable equipment for future projects. To evaluate the reliability and product improvement program, the approach determined the types of failure and failure conditions by searching the industry for recorded control line failures, Fig. 1.
 |
|
Fig. 1. A systematic workflow determined the failure types.
|
|
FAILURE RESEARCH
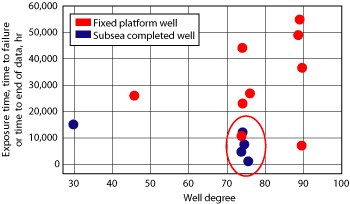
The failure data was analyzed and evaluated using a database search tool. The program established common-mode failure conditions and produced statistical analysis of items connected to the control line by depth with the number of failures by deviation including: item top depth vs. maximum well deviation, item top depth vs. maximum deviation point and well deviation vs. exposure time, Fig. 2.
 |
|
Fig. 2. A database tool established common failure conditions like this plot associated with geometry changes (oval).
|
|
The results showed that the majority of control line failures are related to 75°-90° deviated wells. In addition, more control line failures were noted shallow in the well rather than the deep-set SubSea Safety Control Valves (SSSCV). Also, well geometry changes were associated with potential failure.
TEST EQUIPMENT
After polling vendors and company inventory, the researchers identified commonly available systems, which became the study’s subjects. Fittings tested included standard industrial A and B fittings, as a baseline reference for specialized downhole fittings C through F. The configurations tested included:
- Fittings: A (¼-in. cone and thread), B (¼-in. cone and thread with anti-vibration), C (9⁄16-in. cone and thread x ¼-in. dual ferrule with test port), D (¼-in. dual ferrule x ¼-in. dual ferrule, with back-up O-ring and test port), E (9⁄16-in. cone and thread x ¼-in. dual ferrule with back-up O-ring and test port), F (¼-in. dual ferrule) and G (¼-in. dual ferrule).
- Control lines: Type 1 (seam welded ¼-in.) and Type 2 (seamless ¼-in.)
- Clamps: Type X of cast steel and Type Y of pressed steel.
TEST LOADS
Numerous tests were performed on the control line tube/fittings. The first five tests were non-destructive to verify lifecycle durability. The sixth and seventh tests were destructive to establish the maximum working envelope. Testing was performed sequentially.
Control line tests. Hydraulic pulse testing involved 9,000 cycles to simulated 25 years of service. The first 4,500 cycles were from 0 psi to 15,000 psi followed by a second 4,500 cycles from 0 psi to 20,000 psi. Thermal cycling also simulated 25 service years using 100 cycles from 39°F to 390°F. Shock and vibration testing varied frequency, acceleration, amplitude and temperature. External collapse tolerance was tested using 1,000-psi pressure increments up to 20,000 psi. Torque retention was tested by measuring the maximum torque at which a control line backed off a fitting.
The two destructive tests included a burst test, which pressured the control line up to the maximum pressure at which the line or fitting leaked or burst. The final test involved tensile load. It stressed the line up to the maximum load that initiated a rapid pressure drop or rapid elongation.
Clamp tests. There were five non-destructive tests including thermal cycling and shock and vibration tests similar to the control line tests. The clamps also underwent two other tests: axial and torsion loading. The axial tests applied a longitudinal load until the stress induced slip. Torsional loading applied tangential force until rotational slip occurred.
CONFIGURATIONS TESTED
Seven downhole control line configurations were selected for testing. These compared seamless and seam-welded tubes with different fittings. The tests included:
- Test 1: Orbital welds, seamless ¼-in. tube with A fittings
- Test 2: Orbital welds, seam-welded ¼-in. tube with B fittings
(Tests 1 and 2 were performed to establish the viability of using field-installed orbital welds.)
- Test 3: Seam-welded ¼-in. tube with F fittings
- Test 4: Seamless ¼-in. tube with F fittings
- Test 5: Seam-welded ¼-in. tube with G fittings
- Test 6: Seam-welded ¼-in. tube with D and E fittings
- Test 7: Seam-welded ¼-in. tube with C fittings.
To test the control line, connection and clamps, a series of test fixtures were assembled, including a machined aluminum test manifold. All samples were assembled and torqued according to the manufacturer’s specifications. The fixtures were installed into an environmental test chamber and mounted to the shock and vibration test rigs. For clamp testing, the main rigging was used for the longitudinal and rotational testing.
Most test samples passed most tests, but failed in one way or another. Only Test 3 (seam-welded ¼-in. tube with F fittings) passed all the tests. Three tests (2, 4 and 6) had a problem with torque retention. Test 1 sheared at the weld; Test 5 had a problem with external collapse and Tests 1 and 7 failed the random vibration test.
CLAMP TESTS
Several cross-coupling downhole control line clamp configurations were selected for testing. Only cross-coupling clamps were tested, since cross-coupling and mid-span couplings use the same clamping arrangement. Their working characteristics are similar, and the loading being applied represents both types. The clamps tested included Type X clamps (harsh-environment cast steel, standard-environment cast steel and cast steel), and Type Y clamps: pressed steel and low-profile pressed steel. All test samples were subjected to life cycle and destructive tests, Table 1.
TABLE 1. Clamp test results
Click table to enlarge. |
 |
|
For test samples 1 and 2, the pressed steel clamp and the low-profile pressed-steel clamp moved during initial axial load test, causing them to jackknife. Their replacement units’ clamping force varied during lifecycle testing, but there was no long-term effect on the clamping force. A load increase was noted during final load testing. This was due to rust-inhibitor coating carbonization from thermal cycle testing.
For Test 3, no initial load testing was applied to the harsh environment cast steel clamp due to the risk of damaging the assembly. The clamping force of the unit varied during lifecycle testing, and there was no long term-effect on clamp force caused by the testing.
For Test 4, the pressed steel bands on the cast steel clamp started to roll during initial load testing, which was halted to prevent damage. The initial clamp was used for lifecycle testing, and the clamping force varied during the test with no long-term effect from the testing. A load increase was noted during final load testing. This was due to rust-inhibitor coating carbonization from thermal cycle testing.
For Test 5, the cast steel clamp was only subjected to initial load testing to compare its clamping capacity with others.
STRESS ANALYSIS
Understanding the failures in control lines was the first step; the next was to predict the stresses and loads that may have caused failure. The testing performed helped to define loading concerns:
- For a single control line: temperature, pressure, axial, bending stresses and torsion loading.
- For a control line clamp: shear load across clamp imposed by the control line, axial slip along tubing length imposed by frictional contact forces and rotational slip around the tubing imposed by rotational frictional forces and clamp offset.
Thermal loading is important because a control line is expected to operate in a producing well, where injected fluid sets up opposite length change vectors between the tubing and control line. Control lines have been sized and selected based on their pressure rating with minimal regard to mechanical considerations. Given their size, they have a much greater pressure capability than required; however, a control line’s axial strength is not particularly strong. Bending stress is added in relation to the tubing, but torsional loading can be a design limitation. A few of the control line connections backed off due to torsional load.
The clamp’s purpose is to protect the control line by holding it close to the tubing, support the weight of the control line and protect it from crush loads. Longitudinal clamp movement will impart tensile and compressive loading. Radial movement will impart additional tensile loading at the clamp node. If the line slips through the clamp, the load distribution across its length will change. Interactive loading between tubing, clamp and control line is understood, but not modeled in the software.1
Analysis of the production tubing system with attached control lines assumes that the control lines and the tubing move as if attached to each other at every point along the interval length. The analysis presents an average measure of the force in the control line. In reality, the control line is clamped at fixed spacings along the tubing length. This “between clamps” analysis adds the effect of control line weight to the average force to determine the worst-case load.
Axial tubing movement can result from the sum of differential thermal expansion and differential ballooning. Induced torque produced by helical buckling can develop tubing rotation. Scrubbing loads are produced by friction due to contact forces and movement. Given the contact force and friction coefficient, the scrubbing loads can be estimated by assuming pipe rotation.
The worst-case lateral load is created by point contact between the clamp and the wellbore wall. This load develops twisting moments and lateral forces directly on the clamp, together with friction drag forces.
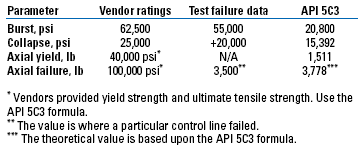
The vendors provided the 40-kpsi yield strength and 100-ksi ultimate tensile strength of the control line material, but not the actual axial rating, Table 2.
| TABLE 2. Control line ratings |
 |
|
CASE STUDY
To validate many of the findings and to check the software modeling code, example wells were created. Configurations were created to highlight the findings of deviation, control line depth and well geometry. The configurations modeled 10,000-ft-MD wells in 1,000 ft of water depth. Three wells were considered: one vertical and two deviated wells, one each at 45° and 90°.
The wellbore temperature varied from 40°F at the mudline to 150°F at TD. Wellbore fluid was 8.6 ppg brine placed inside 9 5⁄8-in., 53.5-lb/ft production casing with 4½-in. 12.6-lb/ft L80 production tubing.
Control lines modeled were ¼-in., 0.065-wt, 40-ksi, inc 825 with 5½ in.-OD clamps offset at 1½-in. Control lines were modeled at three depths: 1,500 ft, 4,000 ft and 7,000 ft.
The configurations provide three wells with three different control line setting depths. As a result of MD/TVD shifts, the wellbore temperature profiles were adjusted to ensure an equivalent thermal profile was applied to each scenario. Due to the MD/TVD correlation, the pressure profiles were different; therefore, a fourth example was created based on the 45° example with an equivalent TVD to the vertical well.
The result was a 12,000 ft MD well. All control line depths were at equivalent TVD to the vertical well to equate the pressure profiles. The final example was also based on the 45° well example, but this configuration had a 7-in. liner from 6,000 ft to 10,000 ft.
INPUT DATA
Control line ratings were equated based on the API 5C3 formula for Oil Field Tubulars. The tubing used was 1⁄4-in. OD, 0.065-wt with a yield of 40 ksi, as supplied by the vendor. This yielded ratings of 20,800 psi burst, 15,392 psi collapse and 1,511 lb axial. The clamps modeled were 5 1⁄2-in. OD, 1 1⁄2-in. offset with an axial slip resistance of 2,000 lb-f and a rotational slip resistance of 8,438 in.-lb-f. Shear resistance was 70 lb-f, Table 3.
| TABLE 3. Loads applied |
 |
|
The overpull case showed control line sensititvity to tensile loads. Most tubing designs include this case and model where the tubing base is fixed or stuck and surface pull is applied to the tubing. The overpull is distributed across the control line length. Similarly, the running-in-hole case examines tubing/control line tensile loading. This simulates the shock load induced if the tubing is suddenly stopped while running in.
The next two loads indicate the system’s sensitivity to thermal differential loading. The first load, maximum temperature tube-minimum temperature control line, is a worst case event where the tubing experiences a full production thermal load while the control line is experiencing a cold injection load from a surface injected fluid. The second, minimum temperature tube-maximum temperature control line, is the opposite and was included to span the thermal possibilities.
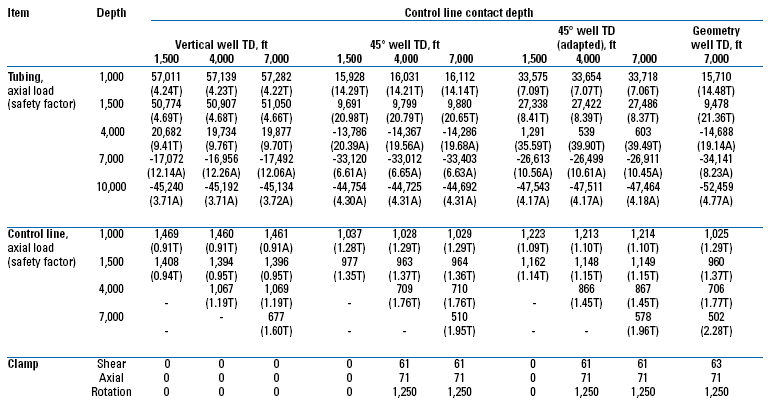
Table 4 shows the axial force on the tubing and the control line at the given depths for the given control line set depths with the safety factor. The safety factor is the minimum of either triaxial or axial, since burst and collapse have zero differentials across the tubing, control line and annulus.
TABLE 4. Example well results
Click table to enlarge |
 |
|
Looking at the vertical well and the three sensitivities of control line setting depth, there is an increasing load on the tubing, but the control line load varies little. With increasing deviation, control line loads decrease. Only the vertical case indicates a worst case where control line load exceeds the rating. This is contrary to the failure data, which suggested that an increasing deviation increased the chance of failure.
It may be that the assumption of equal control line lengths and equivalent temperature profiles, but changing pressure profile, did not give an appropriate comparison. To check this, the adapted 45° well kept the temperature and pressure profiles equivalent to the vertical well but varied the MD of the control line in accordance with the vertical well TVD. The trend of decreasing load with deviation is less with this new adaption, but it is still different from the previous hypothesis.
One possibility was that the axial loads shown were without bending and that only by looking at the values with bending would the expected trend be seen. Table 5 shows these axial forces with bending, and the trend is still contrary. The only loading that meets the trend hypothesis was the clamp loading with shear load, axial slip and rotational slip loads increasing as the deviation increased and control line depths increased. This is a key indication that the integrated clamp load imposed on the control line is a key factor to the potential load failure. The geometry change scenario did not show increased loading when compared to an equivalent well scenario (45° well). Snag loads are more important than first thought.
TABLE 5. Axial loads with bending forces (tubing and control line)
Click table to enlarge |
 |
|
SUMMARY
The software does a good job of calculating loads on the control line, clamps and, by reference, the fitting. There are still loads and refinements to be made, but through the use of such code, potential control line weaknesses can be avoided. Reviewing the differences among vendors, API 5C3 type ratings and the tests performed indicate that the API 5C3 formula may underestimate the ratings, particularly the axial rating. Burst and collapse ratings are within tolerance ranges and are minimally conservative.
The software was incomplete, since it did not allow modeling of additional loads, like applied twist (torque) of the completion string. Therefore additional enhancement is necessary. Additional specification would enable modeling of:
- Collapse resistance reduction due to point crush load from side forces
- Installation torque while the tubing/control line combination is run in hole
- Interaction of line, fitting and clamp to determine loading.
RECOMMENDATIONS
Tubing hanger control line fittings should have a burst pressure equal to or better than the control line tubing. Control line fittings should be locked/secured to the equipment body, and ferrule fittings should use a backup barrel-type O-ring seal(s) to avoid leakage in case the control line fitting is partially backed out of the tubing hanger body. Fittings that employ compression-ferrule connections must bite into the control line outer wall, and control line material hardness must allow the ferrules to bite into the tube wall.
Standardized control line connections should be used on tubing hangers and SCSSVs. This simplifies tubing hanger control line connections and improves reliability by removing compression fittings, by using autoclave-type connections.
Seamless control lines should be used for high-pressure downhole applications. Seamless control line manufacturing capacity can be improved from 2,000 ft to 3,000 ft by increasing the raw billet stock from 200 lb to 300 lb. The longer seamless control line in conjunction with improved orbital welding techniques will reduce the total amount of seam/orbital weld used. Testing has indicated that non-annealed orbital control line welds do not reduce the control line performance.
Consider placing crush members in flat-packs to avoid mid-span damage to control lines, and consider using electron-beam welding or laser-beam welding for the makeup of downhole control lines.
For clamps, use cast steel clamps in deviated well sections and pressed steel clamps in vertical well sections. Pressed steel clamps should have reinforced spines to avoid jackknifing. The clamps should be cleaned of rust-preventative coatings prior to installation, since the coatings lower clamping forces by more than 50%. Another option is to add knurling or grip ridges to cut through rust-preventative coatings. Use tested and qualified control line clamps for deviated and deep offset wells.
In general, downhole control line failure information should be captured along with casing and completion string information. Proactive downhole equipment documentation should include top-level equipment specifications and top-level Quality Control Procedures (QCPs). Documents should cover control line manufacture, control line spool lifecycle monitoring (mechanical cycling), control line and fitting compatibility, flat-pack manufacture, flat-pack spooling, control line flushing, control clamp compatibility and offshore installation. Procedures, specifications and QCPs should be based on vendor-supplied data.
Consider having all projects check proposed control line solutions through a control line model, and implement 3D graphical schematics of tubing and control lines, so operators can readily review the downhole configuration.
For the future, investigate if water-based fluids’ operating temperatures can be extended and establish the implications of changing over to synthetic control fluid. Dumping SCSSV returns to sea or using a closed-loop system needs to be investigated, as does dumping SCSSV returns into the wellbore or annulus to avoid environmental concerns. Hydration of SCSSV controls using water-based fluids also needs investigation. 
ACKNOWLEDGEMENTS
The authors thank the vendors for their help with this study. This article was derived from OTC 19170 presented at the Offshore Technology Conference held in Houston, May 5-8, 2008.
LITERATURE CITED
1 Mitchell, R. F., Ellis, S. T., Siappas, G. and A. Colyer, “Analysis of control lines strapped to tubing,” IADC/SPE 112624 presented at the IADC/SPE Drilling Conference held in Orlando, Fla., March 4-6, 2008.
.
|
THE AUTHORS
|
|
|
Scot Ellis earned an MSc degree in offshore engineering from Robert Gordon University. He has 13 years of experience in the GOM, North Sea and other areas. He started with a wellbore design firm consulting in drilling and completion design, workflow and project management. Ellis joined Chevron three years ago and now provides reliability, intelligent completion and hardware skills. His present role is as the Drilling and Completion member of the Chevron-StatoilHydro Joint Technology Team.
|
|
| |
George Siappas is a Subsea Operations Engineer with Chevron in Houston.
|
|
| |
Angus Colyer is a Subsea Engineer with Chevron in Houston.
|
|
| |
Robert Mitchell earned BA, MME and PhD degrees from Rice University, and is a registered professional engineer in Texas. He was Vice President of Enertech Engineering and Research Co. from 1980 to 1996 and worked at
Exxon Production Research Co. from 1973 to 1980. He has published more than 70 papers on drilling and well completion problems and won the SPE Drilling and Completions Award for 2005. Mitchell is a Halliburton Fellow in the Halliburton Drilling and Evaluation Division.
|
|
|


