Accounting for pore- and grain-size distributions in dual-mineralogy systems, improves permeability estimates.
S. Chen, D. Jacobi, J. Chen, M. Gladkikh, D. Georgi, and M. Gillen*; Baker Hughes
Nuclear Magnetic Resonance (NMR) logging measurements respond directly to pore fluids and their interaction with the rock surfaces. Thus, NMR does not suffer many of the drawbacks that affect interpretations of conventional logs, which respond primarily to the rock matrix properties. Conversely, general NMR rock-property interpretation models are explicitly or implicitly developed from clean clastics with single mineralogy and well-connected pore networks at 100% water saturation. When applying these models to interpret more complex lithology, including multi-mineral or carbonate formations, one sometimes faces challenges similar to those encountered when using Archie’s equation for interpreting non-Archie formations. With modifications to the existing interpretation models, and/or use of a more sophisticated pore-scale geometric model, we can take the lithology, mineralogy or pore-structural characteristics information into account to interpret complicated reservoir formations successfully.
Essentially, NMR logging applications fall into two categories: those derived from fluid properties only, and those based on fluid and matrix interactions. Among the latter are pore and grain-size distributions, capillary pressure curves, clay and capillary bound water volumes, and permeability estimates. Even though fluid-matrix interaction is the foundation of these applications, commonly used NMR interpretation models do not adequately take into account lithology and mineralogy variations; consequently, the reliability of these NMR log-derived parameters as quantitative measures suffers. This article describes several new approaches of extending the NMR interpretation models to more complex formations.
MULTI-MINERAL PORE-SIZE DISTRIBUTION MODEL
NMR transverse relaxation time T2 distribution data are widely used as the entry point for many NMR-based formation property interpretation models. The rationale of this approach is that the relaxation rate T2-1of a wetting-phase fluid in a pore space is approximately proportional to the product of the surface-to-volume ratio (S/V) and the surface relaxivity ( ) )
where T2bulk is the bulk relaxation time of the fluid and the index i represents ith pore. The pore-surface-to-pore-volume ratio is equivalent to the inverse of the characteristic pore size. For rocks with a distribution of pore sizes, a distribution of T2 is expected. The surface relaxivity,  , depends on the fluid and rock mineralogy, where the index k stands for kth type mineral grains. This equation is valid for rocks dominated by single minerals and where multi-mineral grains are present, but each pore is bordered by a single mineral grain type. Conversely, if the ith pore is bordered by grains of n different types of minerals, Eq. (1) is revised to , depends on the fluid and rock mineralogy, where the index k stands for kth type mineral grains. This equation is valid for rocks dominated by single minerals and where multi-mineral grains are present, but each pore is bordered by a single mineral grain type. Conversely, if the ith pore is bordered by grains of n different types of minerals, Eq. (1) is revised to
where
Clearly, mineralogy information is needed to correlate the non-linear behavior between T2 and pore-size distributions in complex lithology.
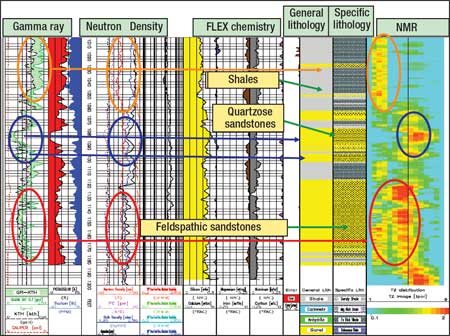
Figure 1 illustrates the effects of lithology and mineralogy on the interpretation of T2distribution for pore sizes from a test well in Johnson City, Texas. The non-NMR logs (GR, neutron, density, and the lithology interpretation tracks) indicate the top interval is shale, the middle interval is quartzose sandstone, and the bottom interval is feldspathic sandstone. The NMR T2distributions are shown on the rightmost track. The quartzose sandstone shows a mono-modal T2distribution, but the feldspathic sandstone interval shows a bimodal T2 distribution pattern. Had the complex lithology effect not been considered, the bimodal distribution would have been interpreted as the result of two distinctive pore sizes. However, the lithology information leads us to interpret the two peaks in the bimodal distribution being associated with the pore fluid in contact with two different minerals.
 |
|
Fig. 1. Illustration of complex lithology affecting the interpretation of pore-size distribution from T2 distribution.
|
|
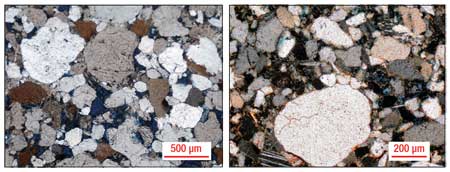
Figure 2 shows two core thin-sections taken from the quartzose (left) and feldspathic (right) sandstone sections, respectively. The position of the long T2 relaxation time peak shift in Fig. 1 can be interpreted from the pore size difference for pores surrounded by quartzose grains. The fast-relaxing T2 component in the feldspathic section is contributed from fluids in smaller pores surrounded by feldspathic grains. To accurately translate the bimodal T2 distribution to pore-size distribution, =3.3 is used, with the assumption that the same surface roughness factor applies to both mineral grains. Had we used a single =3.3 is used, with the assumption that the same surface roughness factor applies to both mineral grains. Had we used a single  to compute pore-size distribution, the pore sizes associated with the pores surrounded by the feldspar grains would have been overestimated by a factor of 3.3. Knowing the mineral composition enables accounting for such non-linear effects. to compute pore-size distribution, the pore sizes associated with the pores surrounded by the feldspar grains would have been overestimated by a factor of 3.3. Knowing the mineral composition enables accounting for such non-linear effects.
 |
|
Fig. 2. Thin-section photo with samples taken from quartzous sandstone section (left) and feldspathic sandstone section (right).
|
|
PORE-SCALE MODEL ADVANTAGE
Multi-mineral rock composition results in being different for different pores. Due to the random nature of pore and grain-size distributions, an exact, analytical solution of pore sizes using Eq. (2) is neither possible nor necessary. A more practical approach is to employ a Pore-Scale Model1 (PSM) constructed using rock mineralogy and diagenetic, weathering and metamorphic processes as inputs, which statistically distributes the grains and is representative of the formation rock’s composition. By matching the PSM-predicted NMR response with the measured T2 distribution, correct pore sizes can be obtained in rocks having complex mineralogical composition.
The benefit of PSM is not limited by conventional means of log-data interpretation. Once the pore-scale rock model is in agreement with the log-data prediction, the fluid flow characteristics can then be predicted under different reservoir conditions that are not measured from logs. For instance, models established from a single water-saturation level can be used to predict the response at different water saturations. An application that takes advantage of this feature is shown next.
ESTIMATION OF GRAIN-SIZE DISTRIBUTION
As NMR T2 distribution correlates to pore-size distribution, as described above, it is natural to consider correlating the T2 distribution with grain-size distribution. For clastics with relatively good sorting, grain size can be considered approximately proportional to pore size and, thus, T2. For poorly sorted rocks, the T2 and pore-size distributions are dominated by small pores, as the smaller grains can occupy the space between the gaps among large grains. The detailed procedure of the determination of grain-size distribution from NMR T2 relaxation time, using the pore-scale model, has been documented.2
In 100% water-saturated rock, all the grain surfaces are in contact with water. Correspondingly, the T2 distribution is useful for determining grain-size distribution. In partially saturated core or a hydrocarbon zone, water occupies the smaller pores and forms a thin water film covering the surface of the larger pores under water-wet conditions. The hydrocarbon phase stays in the center of the big pores and has no contact with the grain surface. Therefore, only the T2 distribution of water carries information on the grain-size distribution.
Figure 3 shows the measured T2 distributions at three water saturations, Sw = 100%, 70%, and 41% (left plot), and the corresponding grain-size distribution estimated from these T2 distributions (right plot), in a Berea core sample. For core samples, T2 distribution of water is obtained by partially saturating the core with air/brine. For log interpretation, the separate T2 distribution of water can be obtained by a fluid typing technique such as 2D NMR.3,4 There is good agreement between the calculated and measured grain-size distributions down to 41% water saturation, except for the tail of very small grain sizes. In these calculations, the same parameter of surface relaxivity and surface roughness factor, as is shown in Table 1 for the sample, are used.
 |
|
Fig. 3. Estimation of grain-size distribution from T2 at partial water saturation (air/water system), Sw=1, 0.7, and 0.41, for a Berea sandstone.
|
|
| TABLE 1. Summary of the input parameters into pore scale model |
 |
|
After the grain-size distribution is determined from T2 at partial water saturation, the pseudo T2 distribution corresponding to Sw = 1 can also be generated. Figure 4 shows the comparison of four T2 distributions corresponding to Sw = 1 for a Berea sandstone. One curve represents the measured T2, the other three are simulated at Sw = 1, 0.7, and 0.41, respectively. The comparison shows that the model-predicted T2 distributions generated from all these saturations are consistent, and they are all in good agreement with the measured T2 distribution in the long T2 range (i.e., large pores) but some discrepancy in the short T2 range is observed. Such a discrepancy is not due to using partial water saturation data, as it is observed, even for simulated T2 distribution using Sw = 1 data. Further improvement of the pore-scale modeling on grain, clay and silt distributions is needed to raise the sensitivity of the lower T2 range.
 |
|
Fig. 4. Comparison of the measured and generated T2 distributions corresponding to Sw = 1 for a Berea sandstone.
|
|
The good estimation of large pore and grain sizes demonstrates the accuracy of the method, as the large grain and pores are not sensed by partial water-saturated T2 measurements. The capability of predicting the grain size is particular useful for the design of sand control filters. Furthermore, generating the pseudo T2 distribution corresponding to Sw = 1 in hydrocarbon zones is also helpful for overcoming the deficiency of NMR-based SDR permeability model (Eq. 6 in the next section) in a hydrocarbon-bearing zone. As the SDR model uses T2GM corresponding to the wetting-phase saturated pores, the insensitivity of hydrocarbonT2 with pore size renders the SDR model less applicable for oil-based mud filtrate flushed formations or for rocks with high residual hydrocarbon saturation. Replacing the SDR model with the generated T2 distribution corresponding to Sw = 1 can solve this problem.
SWIR AND K OF NON-COATES-TYPE FORMATION
The most commonly used NMR-based permeability models are the Coates model5 and the SDR model.6 The latter is also known as the T2GM model. The Coates model is
where the porosity  is a percentage. The default values for the parameters are C = 10, m = 4 and n = 2, respectively. BVM and BVI are Bulk-Volume Movable and Bulk-Volume Irreducible, respectively, and is a percentage. The default values for the parameters are C = 10, m = 4 and n = 2, respectively. BVM and BVI are Bulk-Volume Movable and Bulk-Volume Irreducible, respectively, and
which is obtained by integrating all partial porosity  up to T2cutoff. The Coates permeability is proportional to a high-power law of porosity. If the porosity changes are small, the result will be very sensitive to the T2cutoff. In practice, a single T2cutoff usually does not work for all depths in a complex-lithology well. up to T2cutoff. The Coates permeability is proportional to a high-power law of porosity. If the porosity changes are small, the result will be very sensitive to the T2cutoff. In practice, a single T2cutoff usually does not work for all depths in a complex-lithology well.
The SDR (T2GM) model is described by
where the porosity is a percentage and T2GM is in seconds. The default values for the parameters a = 4 and b =2 indicate that the SDR model is also sensitive to porosity. For reservoirs having little porosity variation, it relies solely on the variation of T2GM. As it uses no T2cutoff, this model is not capable of estimating BVI.
The reservoir formation in this case study exhibits a weak permeability and porosity correlation. Figure 5 plots the core permeability to air (kair) vs. porosity , with the core data taken from four wells in two different fields. The permeability changes by more than four orders of magnitude, but the porosity variation is generally confined within about 10 p.u. To match the core permeability with the Coates model, variable BVI T2cutoff between 5 and 21 ms and CBW T2cutoff between 0.6 and 5 ms must be used. In practice, a very short T2cutoff is often too sensitive to be used reliably for CBW and BVI computation.
 |
|
Fig. 5. Permeability and porosity cross-plot of core data collected from four wells in two oil-producing fields.
|
|
We developed a new approach based on the concept of Leverett-J function7 and the SDR model which requires no T2cutoff for estimating BVI. The dimensionless J-function
is expressed in terms of the capillary pressure pc, permeability k, porosity , the surface tension  and the contact angle and the contact angle  , where Sw is the water saturation measured as a fraction. Normally, one plots the J-function as a function of Sw. For geometrically similar rocks, a single J(Sw) function “overlays” all of these rocks. , where Sw is the water saturation measured as a fraction. Normally, one plots the J-function as a function of Sw. For geometrically similar rocks, a single J(Sw) function “overlays” all of these rocks.
If we choose a nominal pc, which is often the capillary pressure we use for core studies to obtain the irreducible water saturation, Swir, then
Using Eq. 6, we have
or, with the default a and b, Eq. 9 becomes
Plugging Eq. 9 into Eq. 8, we obtain
where
is a constant at given pc, , and .
If formations of multiple wells can be represented by the same J function, we can then attribute the different Swir obtained under the same pc and from different rocks/depths, to the variation of their porosity and T2GM. Thus, we will be able to predict not only the permeability, but also the BVI (or, equivalently, Swir) parameter, with the two NMR-derived quantities, without a T2cutoff. For such a case, a linear trend is expected between NMR-derived Swir and
for a given pc. This assumption enables us to use NMR core or log data, not the permeability data, to calibrate the model parameters, based on a limited number of wells. The calibrated parameters can then be used to predict Swir of other wells at the nominal capillary pressure(s). To verify the assumption, we used core data taken from four wells at pc = 40 and 200 psi, respectively. Data from different wells are represented by a single curve reasonably well, even using the default a and b, as shown in Fig. 6.
 |
|
Fig. 6. Swir vs. T2GM*1.5 of four wells under pc = 40 and 200 psi, respectively.
|
|
 |
|
Fig. 7. Comparison of core and model permeability calculations.
|
|
The good correlation between Swir and NMR T2GM and implies the validity of using the T2GM model (Eq. 6) for the permeability estimation. Figure 7 shows the measured core and model permeability cross plots with optimized model parameters. Referring to Fig. 5, the high-permeability cores appear to be independent of porosity. Thus the optimized permeability model depends only on T2GM:

The low-permeability core plugs exhibits a weak dependence on porosity, the optimized permeability model depends on both f and T2GM:
These models have been applied to satisfactorily interpret permeability of other wells in the same field8 with the hydrocarbon effect being corrected using a pore geometric-modeling approach.
PERMEABILITY IN CARBONATES
Both Coates and SDR equations are pore-size based permeability models, which are generally valid for well-connected pore systems where pore-body and pore-throat sizes are well-correlated, but these equations do not apply to poorly-connected pore systems, particularly vuggy carbonates. In a heterogeneous pore system, for each flow path, the permeability is controlled by the smallest pore throat along the flow path. The validity of the T2cutoff model replies on its corresponding characteristic pore size correlates well with the critical pore throat size, rt,c, which has no correlation to vugs.
Rather, in carbonates, the pore-body-to-pore-throat ratio, rb / r,t, increases as pore connectivity worsens; and rb / r,t  for completely isolated vugs. Thus, rb / r,t can be viewed as a parameter associated with pore connectivity. We have proposed9 a simple approach of generalizing the Coates equation by introducing a pore-connectivity coefficient p such that p=1 corresponds to a pore system containing all regularly connected pores and the p = 0 endpoint effectively states that all of the apparent BVM is “immobile:” for completely isolated vugs. Thus, rb / r,t can be viewed as a parameter associated with pore connectivity. We have proposed9 a simple approach of generalizing the Coates equation by introducing a pore-connectivity coefficient p such that p=1 corresponds to a pore system containing all regularly connected pores and the p = 0 endpoint effectively states that all of the apparent BVM is “immobile:”
where BVI and BVM are computed with the same T2cutoff as if there were no vugs. Partially connected vugs have 0<p<1. Like the Coates equation, this model recognizes that all small pores with characteristic T2 < T2cutoff are bound. In addition, to compensate for the poor connectivity of the large pores in the heterogeneous pore system, this model treats a fraction of pore volumes associated with their characteristic T2 > T2cutoff to be bound fluid.
Finding the p value is a practical challenge for applying the pore-connectivity-based model in log analysis. Many depositional and diagenetic factors can reduce pore connectivity and thus, p value, in carbonate rocks. Partially isolated vugs, intragranular pores and abundance of carbonate mud can all result in poor pore-to-pore connectivity. Therefore, knowing the rock types and the depositional environments or having thin-section images are very helpful for narrowing the selection of a p value to use in case there is no other means to determine it.
In addition to thin-section images and rock type characterization, some wireline or LWD data can help to estimate a p value. When formation test-mobility results are available for a few depths, isolated data points can be used to calibrate the p values for the same section and obtain the moving log of permeability. Image data can help to identify vuggy, fractured or heterogeneous formation sections; these characteristics can be used to semi-quantitatively determine the p value.
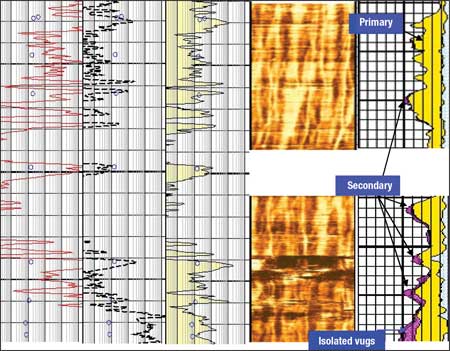
The left plot of Figure 8 shows the comparison of the permeabilities estimated using various models. Shown in the left-most track, the red-colored curve is the permeability estimated using the Coates model with default C, m and n parameters. The discrete circle points are the RCI Wireline Formation Test (WFT)-derived permeability values. The middle track displays the permeability log using the Coates model calibrated to discrete WFT permeability values. While the calibrated permeability log appears reasonable for the upper section, it grossly misses the bottom section, where the facies is known to be vuggy. The third track from the left shows the permeability log based on the p-model with p =0.7 for the upper section (non-vuggy) and p = 0.2 for the low section (vuggy).10
 |
|
Fig. 8. Left: Log plot comparison of permeability log using various models. Leftmost track (red) is Coates model with default carbonate C, m and n parameters. Middle track is Coates model calibrated to wireline formation test data. Rightmost track is permeability log with p model with two different p values for the upper and lower sections. Right log plot shows CBIL image (left track) and the non-connected secondary porosity estimated from the NMR analysis.
|
|
To the right, the brown-colored images are from the Circumferential Borehole Imaging Log (CBIL) of the upper and lower sections, while farthest right curves show non-connected secondary porosity, estimated from the NMR analysis. This example illustrates that even a relatively simple CBIL image is helpful to obtain the p value more reasonably. With the assistance of the formation test data, it can further refine the p value.
CONCLUSIONS
Several cases of complex lithology show where commonly-used NMR formation property correlations cannot be applied directly. By properly taking into account the lithology or mineralogy effects, and with the aid of the pore-scale model approach, we are able to derive pore- and grain-size distributions for multi-mineral systems where no linear correlations between T2, pore size and grain size exist. We demonstrated that the pore connectivity-based carbonate permeability model can take into consideration intragranular, intergranular and vuggy pores.
For a sandstone field study, where no clear porosity-permeability correlation exists and T2cutoff widely spreads, we presented an alternative approach for BVI and the permeability estimation without requiring a T2cutoff. Although it is more challenging to derive petrophysical parameters from NMR logs in complex lithology formations, these examples demonstrate that the difficulties can be overcome by implementing accurate information and using it with modified and/or alternative interpretation models and equations. 
LITERATURE CITED
1 Gladkikh M., Jacobi, D. and F. Mendez, “Pore geometric modeling for petrophysical interpretation of downhole formation evaluation data,” Water Resour. Res., Vol. 43, W12S08, doi: 10.1029/2006WR005688, 2007.
2 Chen, J., Gladkikh, M., Chen, S., Jacobi, D. and H. Kwak, “Determination of grain size distribution from NMR relaxation time using pore scale modeling,” paper presented at Soc. of Core Analysis Annual Symposium, Calgary, Canada, Sept. 9−14, 2007.
3 Hursan, G., Chen, S. and E. Murphy, “New NMR two-dimensional inversion of T1/T2app vs. T2app method for gas well petrophysical interpretation,” paper GGG presented at 2005 Annual Symposium of SPWLA, New Orleans, June 2005.
4 Sun, B. Q., Olson, M, Baranowski, J., Chen, S., Li, W. and D. Georgi, “Direct fluid typing and quantification of Orinoco Belt heavy oil reservoirs using 2D NMR logs,” paper EE presented in 2006 SPWLA Annual Symposium and Exhibition, Veracruz, Mexico, June 4−7, 2006.
5 Coates, G. R., Miller, M., Gillen, M. and G. Henderson, “The MRIL in Conoco 33−1, an investigation of a new magnetic resonance imaging log,” presented at 32nd SPWLA Annual Logging Symposium, Midland, Texas, June, 1991, pp. 16-18.
6 Kenyon, W., “Petrophysical principles of applications of NMR logging,” The Log Analyst, Vol. 38 (2): 1997, pp. 21-48.
7 Leverett, M. C., “Capillary behavior in porous solids,” Trans., AIME, Vol. 142, 1941, pp. 152−169.
8 Chen, S., Chen, J., Gillen, M. and D. Georgi, “A new approach for obtaining Swir from NMR log without requiring T2cutoff,” paper DD, presented at 49th SPLWA Annual Symposium, Edinburgh, Scotland, May 25−27, 2008.
9 Di Rosa, D., Gyllensten, A., Chen, S., Li, W. and D. Georgi, “Use of the NMR diffusivity log to identify and quantify oil and water in carbonate formations,” SPE REE, Vol. 11 (2), 2008.
10 Altunbay, M., Kyi, K.K., Bal, A., Belhaouas, S., Shaharuddin, N. and S. Chen, “Porosity typing and productivity analysis by modified timur-coates permeability model for carbonates using NMR and conventional log data,” Paper KKK presented at 13th Formation Evaluation Symposium of Japan, Chiba, Japan, Sept. 27−28, 2007.
|
THE AUTHORS
|
|
|
Songhua Chen is Manager of Integrated Interpretation and Petrophysics at Inteq/Baker Atlas Houston Technology Center. Prior to joining Baker Hughes, he was a research scientist at Texas Engineering Experimental Station in College Station, Texas, working in NMR and MRI applications of flow in porous media. Chen earned a BS degree from Nanjing Institute of Technology from Nanjing, China and a PhD degree from the University of Utah, Salt Lake City, both in physics.
|
|
| |
David Jacobi is a research scientist at INTEQ/Baker Atlas Houston Technology Center, Baker Hughes. He is responsible for integrating mineralogy, geochemistry and sedimentary petrology to petrophysical measurements, including NMR and nuclear spectroscopy. Jacobi earned an MS degree from Texas Tech University in geology/geochemistry and a BS degree in geology from Midwestern State University.
|
|
| |
Jiansheng (Jason) Chen is a research scientist at Inteq/Baker Atlas Houston Technology Center, Baker Hughes. Previously, he worked at Baker Atlas North American Geoscience department for two years as a Senior Geoscientist. Chen earned a PhD degree in chemical engineering from Rice University in Houston, Texas, in 2004, and MS and BE degrees from Tianjin University, P. R. China in 2000 and 1997, respectively, both in chemical engineering.
|
|
| |
Mikhail Gladkikh is a research scientist at Inteq/Baker Atlas Houston Technology Center, Baker Hughes. His expertise and interests are in the area of petrophysics, pore-scale modeling of rocks, and, most recently, in studying flow behavior of shaped-charge perforations. Gladkikh holds a PhD degree in computational and applied mathematics from the University of Texas at Austin and BS and MS degrees in applied mathematics and physics from the Moscow Institute of Physics and Technology.
|
|
| |
Dan Georgi is Director of Strategic Technology and Advanced Research at the INTEQ/ Baker Atlas Houston Technology Center, Baker Hughes. He recently became the first Baker Hughes technology fellow. Georgi earned a BA degree in physics from the University of California in San Diego, an MA degree in geophysics and a PhD degree in oceanography from Columbia University.
|
|
| |
Mike Gillen was the Product Line Manager for NMR Logging at Baker Atlas until March 2008. He is currently the Director of Logging systems at Scientific Drilling in Houston. Prior to joining Baker Atlas, he was with NUMAR for 11 years, where he held a number of management and technical positions. He holds a BS degree in engineering from the University of Colorado and an MBA degree from Penn State University.
|
|
|


