Time-lapse seismic data finds bypassed pay and drainage volumes, enabling zone-specific drilling and completion optimization to improve recovery efficiency.
Thomas L. Davis and Robert D. Benson, Colorado School of Mines
Tests were carried out by the Reservoir Characterization Project (RCP) of the Colorado School of Mines at Rulison Field, Colorado, to see if time-lapse (4D), multicomponent seismic data could aid in detecting pressure depletion in a tight gas field. Calibration occurred through zonal pressure testing, acquisition of three 9C seismic surveys, specialized image and cross-dipole logging, and microseismic monitoring. Calibration indicated that pressure drops of a few hundred psi could be detected and monitored from surface seismic data. By monitoring pressure depletion, drainage area or sweep can be assessed from 4D multicomponent seismic data, thereby enabling the technology to improve recovery efficiency in tight-gas development. In addition, time-lapse data can potentially be used to locate fractures and design frac jobs to provide greater wellbore deliverability, higher Expected Ultimate Recovery (EUR) and improved economic recovery.
INTRODUCTION
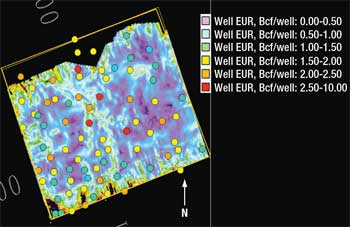
Rulison Field was chosen as the site for RCP’s Phases X and XI reservoir characterization research. Considerable production variability occurs in Rulison. Natural fractures are considered the potential cause of high-EUR wells. RCP’s initial survey showed distinct characteristics of wrench faulting in the central part of the study area, Fig. 1. Shear deformation gives rise to a highly variable fracture-density distribution. The fault zone itself may obliterate permeability, while a short distance away high fracture permeability may occur. Shales deform in a ductile manner by flow, whereas sandstones deform by brittle deformation and fracture. As a result, fractures are concentrated in the sandstone dominated intervals. Near faults, stress relief can occur to create open fractures.
 |
|
Fig. 1. High EUR wells occur in proximity to a wrench fault zone. EUR data courtesy of Williams Production Co, 2003; fault data from Labarre.1
|
|
FRACTURED RESERVOIR CHARACTERIZATION
High fracture density occurs near the central fault, as shown by RCP’s shear-wave anisotropy studies, Fig. 2. The greatest concentration of fractures occurs in the sandstone-dominated Upper Williams Fork interval. Zones of high shear-wave azimuthal anisotropy occur on either side of the fault zone in the Upper Williams Fork. Not all faults exhibit fractures near them.
 |
|
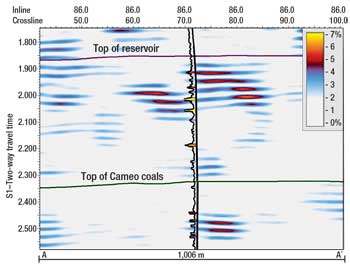
Fig. 2. Shear-wave azimuthal anisotropy displayed along a line of section through the middle of the survey. Anisotropy from the surface seismic and the cross-dipole log are similarly scaled. Zones of high anisotropy on the seismic data correspond to those observed on the log.2
|
|
High shear-wave azimuthal anisotropy appears on the east side of the central fault in the study area and is related to high fracture density. High-EUR wells occur on the east side of the fault, because local stress relief occurs to create open fractures. The maximum horizontal stress is oriented N 75°W across the area and is oblique to the wrench faults in the area. Fractures in this area are dominantly shear related, and the trend of the conjugate shear fracture sets is N 45°W and N 65°E.
High-resolution anisotropy is computed from the amplitudes of split shear waves, and background noise levels affect accurate anisotropy determination. At Rulison, the background noise threshold equates to about 2% anisotropy. Values of anisotropy above this threshold exceed the general noise levels in the data and are captured through the color bar exhibited on Fig. 2.
Time-lapse P-wave data show changes associated with fractures in the Cameo Coal Interval, Fig. 3. P-waves can be used to identify dynamic changes, as the coals are stress-sensitive. Changes in effective stress occur because of pore-pressure change. Areas of change coincide with fractures that are affected by pressure drawdown and gas migration from the coals. These areas are associated with tectonic fracturing in the coals.
 |
|
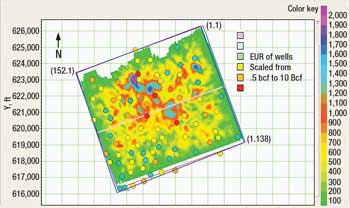
Fig. 3. Time-lapse RMS amplitude of difference anomalies in the Cameo Coal Interval. These anomalies correspond to fracture zones undergoing effective stress change during the time-lapse interval brought about by pressure drawdown associated with production.3
|
|
Where tectonic fracturing occurs, the coal permeability is increased. Pressure drawdown by well completions in sandstones proximal to, and connected to, the coals provides better well deliverability. Seismic monitoring has helped characterize a naturally fractured fairway as a “sweet spot” in the field. Wrench faults give rise to shear fractures in this area. Curvature on the fault system causes stress relief and the presence of open fractures that are distinguishable by shear-wave anisotropy. Vertical and lateral fracture connectivity provides increased permeability and better well deliverability.
The fractured coal zone provides a feedstock for the nearby sandstone reservoirs, where they are connected through the natural fracture network. Production draws down the pressure, enabling gas desorption to occur from the coals. The gas is a dry gas with no free water. Gas deliverability is increased because of the interconnected fracture network between the coal interval and the fractured sandstone bodies in proximity to the faults. These zones of enhanced fracture permeability provide above average gas deliverability and make for high-EUR wells. Seeing these increased permeability zones in the subsurface with multicomponent seismic data assists in optimizing exploration and production strategies for resource development.
Hydraulic fracturing within natural fracture zones that are already depleted exhibits complex behavior that reduces the length of hydraulic fractures and keeps them confined. Connectivity to the natural fracture system is critical to well productivity and high EUR. Orientation and length of the hydraulic fracture relative to the open fracture network is a determinant in well deliverability.
The maximum horizontal stress orientation of N 75°W controls the orientation of hydraulic fractures. As a result, more connectivity is assumed in this direction. However, connectivity also depends on the depositional fabric of the fluvial deposits and the natural fracture system. Predicting connectivity on the basis of hydraulic fracture orientation alone, and using that to design grid-pattern drilling, is not as effective as knowing the actual orientation and lateral extent of the fractured geobodies and using that to locate wells and design hydraulic fracture treatments. The inherent control is the stratigraphy and not just the maximum horizontal stress and orientation of the hydraulic fracture.
Multicomponent seismic data acquired at Rulison Field involves full wave-field data including compressional and shear waves. Compressional waves are acoustic waves or sound waves that travel in the subsurface. Shear waves, on the other hand, are waves that travel elastically involving a torque or shear displacement. As such, shear waves are very sensitive to cracks or fractures in the subsurface. The waves were generated using compressional and shear wave vibrators and the data was recorded using digital accelerometers. Thus three source components of ground motion were recorded on three component receivers giving us nine data components or 9C data.
The dedicated 9C seismic surveys provided the repeatability necessary to see pressure depletion. Time-lapse multicomponent seismic data was used to identify zones that are flowing hydrocarbons to the wellbore. This is important, as 4D multicomponent data provides a tool to monitor well performance after hydraulic fracturing. All zones are commingled, so there is no other means of monitoring where gas is coming from, short of killing the well and then conducting production logging. Production Logging Tool (PLT) logs are expensive to acquire, and the well may never come back to the level of production once it is killed. A PLT log represents only one time-stamp, and many time-stamps are necessary to evaluate how a well performs over time.
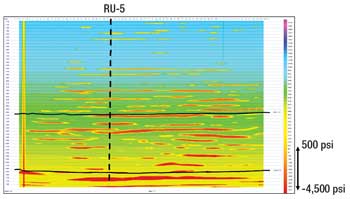
High-resolution Vp/Vs1 and Vp/Vs2 volumes showed good correlation to pressure.4 The data showed that Vp/Vs2 is an especially good attribute for detecting overpressure zones and that time-lapse Vp/Vs2 can be calibrated to monitor pressure depletion. Note the zones of overpressure shown in Fig. 4. Pressure testing in the RU-5 well confirmed the existence of these zones. These overpressure zones need to be targeted with drilling or recompletion programs. Some of these zones occur above the main pay interval, offering the potential to open new gas pay.
 |
|
Fig. 4. Reservoir pressure volume from 2006. Pressure prediction from Vp/Vs2.
|
|
Outlining the overpressured zones could enable existing wells to be recompleted to target bypass pay. These zones may have been completed previously, but if they are not flowing, then recompletions may be needed to access the reserves and improve well deliverability. Assessing bypassed pay opportunities directly from seismic data can aid tight gas development.
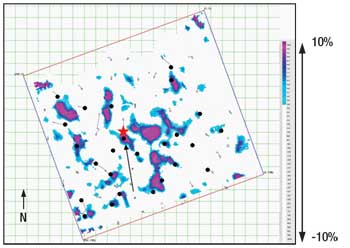
Conventional wisdom in the field, predicated on the direction of hydraulic fractures, is that there is the potential for elliptical drainage and that aligning wells in a linear east-west pattern could cause more connectivity. The drainage areas imaged from time-lapse seismic data offer quite a different perspective, however. Figure 5 shows a slice through the time-lapse Vp/Vs2 difference volume, which shows depletion zones at specific levels in the volume. For a depth slice at 6,200 ft, note the spatial framework of drainage anomalies. They are controlled by well locations, but more importantly by natural fractures and sand-body geometries. Notice the area of larger anomalies in the middle of the survey and their alignment, indicating that greater drainage volumes occur in that area. This area coincides with the area of tectonic fracturing and the high-EUR fairway in the field, as seen in Fig. 1.
 |
|
Fig. 5. Time-lapse Vp/Vs2. Depth slice at 6,200 ft showing extension of relative 2003-2006 Vp/Vs2 anomalies. Well RU-4 represented as a red star.
|
|
CONCLUSIONS
We have confirmed that overpressured and pressure-depleted intervals can be detected by multicomponent seismic data and that effective stress changes can be monitored through 4D data to aid in resource recovery. These results bode well for future tight-gas resource exploration and production. Using multicomponent seismic data to observe bypassed pay and drainage volumes from 4D data enables zone-specific drilling and completion optimization to improve recovery efficiency. 
ACKNOWLEDGEMENTS
The authors thank Williams RMT Company, operator of Rulison Field, for the opportunity to conduct this study. We are grateful to sponsors of our project for the support enabling us to undertake this research.
LITERATURE CITED
1 LaBarre, E. L., “Reservoir Prediction from Multicomponent Seismic Data, Rulison Field, Piceance Basin, Colorado,” MS Thesis, Colorado School of Mines, Golden, Colorado, 2008.
2 Davis, T. L., LaBarre, E. A. and R. D. Benson, “Multicomponent seismic applications to tight gas sandstone exploration and production, Rulison Field, Colorado,” First Break, 26, 2008, pp. 87-91.
3 Davis, T. L., “4-D, 9-C delineates key CBM variables,” American Oil and Gas Reporter, 50, No. 12, 2007, pp. 97-101.
4 Meza, R. A., “Time-lapse Vp/Vs analysis for reservoir characterization, Rulison Field, Colorado,” MS Thesis, Colorado School of Mines, Golden, Colorado, 2008.
|
THE AUTHORS
|
| |
Thomas L. Davis, PhD, is professor of geophysics at Colorado School of Mines and guides the Reservoir Characterization Project. He has been the organizer for technical conferences, workshops and continuing education programs for the Society of Exploration Geophysicists. Davis served as SEG’s second vice president, technical program co-chairman and distinguished lecturer. He received the C.J. Mackenzie Award from the Engineering College of the University of Saskatchewan, the Milton B. Dobrin Award from the University of Houston and the Dean’s Excellence and Melvin F. Coolbaugh Memorial Awards from the Colorado School of Mines.
|
|
| |
Robert D. Benson is a Research Associate Professor in the Department of Geophysics at the Colorado School of Mines, and is co-director of the Reservoir Characterization Project. Prior to joining Colorado School of Mines in 1987, he was a geophysical consultant and had been employed by Placid Oil, Sun Exploration, Texas Pacific Oil and Seismograph Service Corporation. Benson has more than 30 years of experience in seismic acquisition, processing and interpretation. He holds BS, MS and PhD degrees in geophysics from Colorado School of Mines. His research interest include the development and application of time-lapse (4D), multi-component (3C) seismology technologies for enhanced oil recovery which he has published and presented in numerous technical papers and professional meetings.
|
|
|

