Integrated data includes high-resolution 3D seismic, drill hole data, and laboratory measurements of bitumen content.
Milovan Fustic, Lori Skulski, Dale Vanhooren, Paul Bessette, Darren Hinks, Laurie Bellman and Dale A. Leckie, Nexen Inc.
The purpose of this article is to demonstrate how a multidisciplinary team integrates a variety of measured rock and fluid characteristics in order to interpret and map reservoir heterogeneities impacting SAGD operation. It also illustrates that data integration unavoidably leads to non-uniqueness of interpretation that requires evaluation of different geological concepts by active participation of many team members. A comprehensive integration of data is fundamental to achieve efficient development of a multibillion-dollar oil sands project.
INTRODUCTION
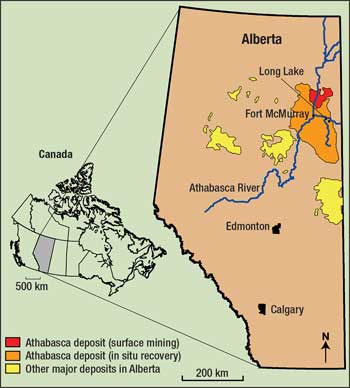
Nexen Inc. and OPTI Canada are joint-venture partners developing the $6.1-billion Long Lake Project in the Athabasca oil sands region of northern Alberta, 40 km southeast of Fort McMurray, Fig. 1.
 |
|
Fig. 1. Location map for Long Lake property in Athabasca Oil Sands Region, northeastern Alberta.
|
|
The Long Lake Project will upgrade bitumen into a premium, sweet synthetic crude oil at a significant cost advantage over competitive technologies, by virtually eliminating the need for externally purchased natural gas. To upgrade the bitumen, the Long Lake Project will use a unique combination of established and proprietary technologies, including OPTI Canada’s patented OrCrude process. The end result is a synthetic crude oil with premium characteristics that will be a highly desirable feedstock for North American refiners. First Premium Synthetic Crude production came onstream in the third quarter of 2008.
The project will use Steam Assisted Gravity Drainage (SAGD) technology to extract the bitumen in situ, from depths of about 250 m. SAGD is the current method of choice where bitumen deposits are too deep for mining. Pairs of horizontal wells are used--steam is injected into the upper well, heating the bitumen and causing it to flow through perforations in the lower well, where it is pumped to the surface. Optimal positioning of injection and production horizontal wells (well pairs) is a must for project success. However, due to reservoir and bitumen heterogeneity encountered in the Athabasca Oil Sands Deposit (AOSD), this is not an easy task. The major challenges for optimal positioning of well pairs include finding, characterizing and mapping the extent of thick, continuous, bitumen-saturated sands, permeability barriers, water and gas saturated zones, and viscosity changes.
Mapping these properties requires the acquisition and processing of various subsurface information and its full integration into geological context. In the Long Lake project, subsurface information includes: high resolution 3D seismic, drill hole data (densely drilled stratigraphic wells commonly cored through the entire zone of interest and logged with conventional suite of geophysical logs including dipmeter), and laboratory measurements of bitumen content.
GEOLOGICAL BACKGROUND
The Lower Cretaceous McMurray Formation forms the most volumetrically significant portion of the AOSD, one of the largest petroleum deposits in the world. The McMurray Formation has never been buried to significant depths.1 Because diagenesis of the McMurray Formation rocks is minimal (due to shallow burial history1 and early petroleum charges), it is inferred that the reservoir quality directly reflects depositional history.2 However, due to restricted accommodation space3 and multiple transgressive-regressive events, the depositional history is very complex. Although, regionally, the McMurray Formation is composed of fluvial, open estuarine, and Estuarine-Channel Complex (ECC) deposits, within the project area, bitumen-hosting rocks are identified predominantly as ECC deposits.
These comprise complex networks of interfingered and multiple-stacked, tidally influenced Point Bar (PB) and associated Abandoned Channel (AC) fill deposits of an ancient estuary. Genetically associated Tidal Flat (TF) deposits are rarely preserved in the subsurface, likely due to erosion in this low-accommodation setting. Reservoir complexity is further enhanced by a range of channel sizes and their unique geometries, as well as by internal heterogeneities within PB and AC-fill deposits.
Many authors have discussed the geometry of McMurray Formation channel deposits. Some have suggested that the thickness of the individual PB deposit might be up to 45 m, as documented at the Steepbank River outcrop.4 This outcrop may have a modern analog in the Han River in Korea.5
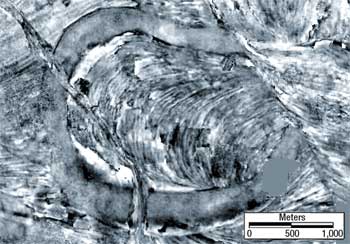
Recent case studies have documented individual PB deposits with lateral extents (widths) exceeding 4 km and 1.5 km, respectively.6,7 These dimensions are in line with the inferred geometry of the channel meander revealed on the time-slice seismic image, Fig. 2, from one of Nexen Inc. / OPTI Canada’s leases. While the above-mentioned dimensions are impressive, studies of modern and ancient analogs suggest that channel deposits with a wide range of thicknesses from the above suggested 45 m to as thin as 2 m (tidal creeks) may be preserved in the subsurface. Also, considering that constant reworking of sediments by meandering rivers and tidal currents create very complex interfingered channel deposits, the preservation of any entire channel deposit is a rather rare phenomenon.
 |
|
Fig. 2. Seismic time slice from one of NEXEN Inc. / OPTI leases shows a single point bar deposit with a lateral extent of more than 4 km.
|
|
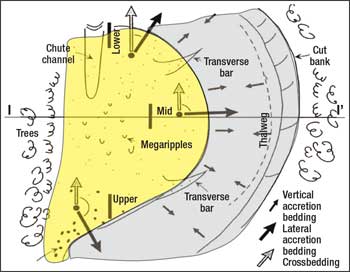
Generally, PB- and AC-fill deposits are considered as reservoir and non-reservoir depositional elements, respectively, Fig. 3. However, internal architecture of PB deposits of the McMurray Formation appears to be very heterogeneous too. A PB deposit commonly consists of trough-cross-bedded sand unit at base of the channel and inclined heterolithic strata (IHS) unit in its upper portions.2,8,9 Based on their stratigraphic relationship, they are also classified as Lower Point Bar (LPB) and Upper Point Bar (UPB) deposits.
 |
|
Fig. 3. Sand-dominated PB deposit (yellow) vs. mud-dominated AC-fill deposit (grey). Water flow direction is toward the top of diagram. Arrows show depositional strata orientation. Within the PB (yellow) there is lateral accretion (black arrows) and cross-bedding (grey arrows). Within the channel (grey) short grey arrows suggest direction of vertical accretion of bedding that would develop after channel abandonment. I-I’ is the position of the hypothetical cross-sectional line shown in Fig. 4a.14
|
|
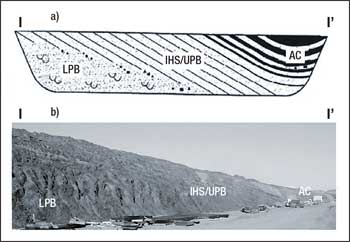
In the McMurray Formation, the proportion of UPB to LPB deposits increases as the meander develops, until the UPB extends to the base of the deposit,3 Figs. 4a and 4b. However, changes in flow hydrodynamics, including occasional floods,9,11 and changes in position of the point bar within the estuary,12 and other factors affect the idealized geometry of PB deposits, Fig. 4a, in terms of reorienting the direction of lateral accretion beds and causing changes in lithologies. The latter is particularly common within turbidity maximum zones, where huge amounts of mud may be deposited, forming muddy IHS-dominated PB deposits.
 |
|
Fig. 4. a) Schematic diagram of a point bar deposit illustrating its constituent elements: Lower Point Bar (LPB), Upper Point Bar (UPB) and Abandoned Channel-fill (AC)2, b) Image of an exposure at Muskeg River Mine displaying the lateral and vertical changes of reservoir properties as suggested in a).
|
|
As a higher-energy deposit, the LPB contains coarser sand and is commonly characterized by excellent porosity and permeability and associated with high-bitumen saturation. By contrast, the interbedded nature of sand and mud encountered in UPB deposits makes porosity and permeability and associated bitumen saturation highly variable over short distances.
When those properties are upscaled to the entire unit, they show that UPB deposits have poorer reservoir properties than LPB deposits. Consequently, LPB and UPB may be classified as Type I (Fig. 8) and Type II (Fig. 9) reservoirs, respectively, with Type I being the most desirable for oil sands developments. AC-fill deposits are predominantly mud and, as such, are not considered reservoir deposits, but instead, as local permeability barriers.
METHODOLOGY
The purpose of geological mapping is to find and delineate thick and continuous Type I reservoirs as the primary target and Type II reservoirs as secondary targets for development. Due to the genetic association and spatial proximities, these two reservoir types commonly have to be developed simultaneously. Their finding, delineation and visualization involve several steps.
First, acquired data are processed, analyzed, and grouped to the level suitable for well-to-well correlation. At this step, team members exercise expertise in his/her own discipline or specialty. Geologists make detailed stratigraphic interpretations of each well (1D interpretation).
The process involves integrating information from core images, geophysical logs (including dipmeter), bitumen-grade distributions, petrophysical analysis and other sources, with an aim to grouping previously described lithofacies into mappable facies assemblages based on their genetic depositional associations (i.e., LPB, UPB, AC); determining the vertical continuity of each of the identified channels and the number of stacked channel deposits in examined wells; recognizing other possibly preserved depositional features (i.e., tie channel deposits); and particularly, characterizing the type and nature of encountered mud and lean zones.
Geophysicists, using both conventional processing and advanced pre-stack processing methods (AVO/LMR and multi-attribute analysis) for reservoir characterization, generate the high quality seismic volumes from which seismic time slices and cross-sections may be easily created. It allows recognition and tracing of not only major lithological changes (breaks), but in some instances, estimation of Vsh (shale volume),12 distinction of water, bitumen- and gas-saturated intervals, as well as overall lithology.14
Second, interpreted geological data and processed seismic from the first step are integrated to create a realistic 3D visual reservoir model. The process of data integration for interpreting subsurface information involves constant comparison of all available information. Interpretation starts with recognizing geologically large-scale and then smaller, but still mappable, features. The large-scale feature, such as the lateral extent of major meandering channels, is commonly detected and delineated on seismic time slices, Fig. 2. Interpretation continues by making a set of geological cross-sections tied to drill-hole locations. Here major geological information from each hole is correlated from well to well. Seismic reflector traces and LMR facies posted behind the cross-section allow for confident correlation of contacts between sand units and thick shale beds, shale plugs (AC-fill deposits) and muddy IHS deposits.
At this stage, seismic resolution reaches its limit. Due to the frequency band-limited nature of the seismic method, we are not fully able to image finer detail features such as sand-dominated IHS bedding packages, precise vertical continuity of individual channel deposits, or erosional contacts between similar lithologies.
These have been recognized using traditional sedimentological approaches supplemented by dipmeter data. Generally, dips with the same and/or similar orientation over a certain depth interval commonly indicate that IHS packages belong to the same channel and that those with opposite and/or oblique orientations belong to different channel deposits.
This information allows not only for distinction of different channel deposits, but also for prediction of the direction in which reservoir quality might improve,2 Figs. 4a and 4b. When a set of parallel or semi-parallel cross-sections is created, comparison of geology between them allows for 3D reservoir visualization.
Finally, with the depositional facies framework created, additional information of importance to operations (i.e., bitumen grade, lean zones, viscosity, etc.) may be posted and analyzed within the framework that can then be modified or, if necessary, reworked to account for all data.
CASE STUDY
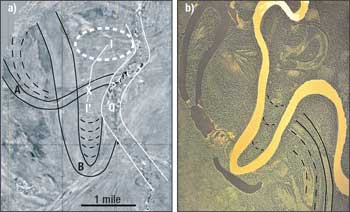
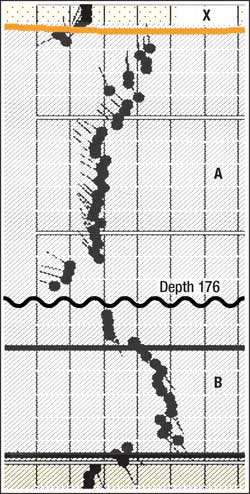
The study area extends over nine sections (9 mi2). Visual inspection of seismic time slices within the study area allows for delineation of at least two meandering-channel deposits (A and B), as well as a major Quaternary channel deposit (Q) to the east, Fig. 5a. The geometry of the delineated meandering channels resembles the geometry of modern meandering channels of the Fly River in Papua New Guinea, Fig. 5b. After investigating the seismic time slices from different depths, it is difficult to determine whether channel A or B is younger and stratigraphically higher. This dilemma becomes resolved after inspecting core and dipmeter information. For instance, Well X (Fig. 6a), from depths of 168 to 176 m, shows dips pointing toward the northwest and from 176 to 191 m, toward the southeast. The contact between those oppositely oriented dips marks an erosional surface between two separate but stacked channels, Fig. 6b.
 |
|
Fig. 5. a) Seismic time slice over the study area. Highlighted are two meanders labeled as “A” and “B” channels. Scroll bars are highlighted by black dashed lines and AC-fill deposits with black solid lines. A quaternary channel deposit that has incised into the McMurray Formation is outlined and labeled “Q”. Symbol “X” shows the position of the vertical well shown in Fig. 6a and 6b. White line (I-I’) shows the position of the geological section presented in Figure 6b. Finally, a big oval (white dashed lines) encircles an area with the best reservoir sands. b) Aerial photo of Fly River in Papua New Guinea shows similar geometries to those revealed by seismic in a).
|
|
 |
|
Fig. 6a. a) Dipmeter data from well X. A change in dip orientation at depth of 176 m. defines the contact between stacked channels A and B, and determines this stratigraphic relationship..
|
|
 |
|
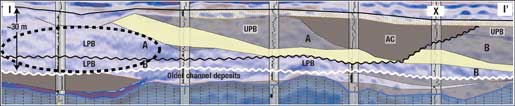
Fig. 6b. Geological cross-section showing the relationship of stacked PB A and B deposits. Black wavy line shows the bottom of channel A and white wavy line indicates the bottom of the channel B. Note that LPB portions of channels A and B are stacked in the northern parts of the study area. Non-shaded areas represent thick continuous sands (reservoir Type I). Light shaded areas are sandy IHS of the UPB deposit (reservoir Type II). Darker shaded areas are mud dominated IHS within the UPB and solid dark grey color-filled areas are muddy IHS of the AC-fill. The dashed oval indicates the best position for future SAGD development where two LPB deposits are stacked yielding about 30 m of vertically continuous sand pay.
|
|
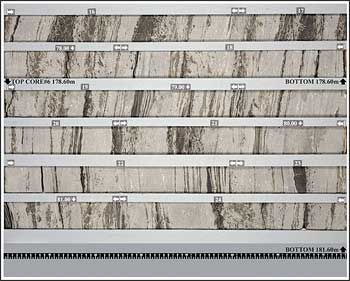
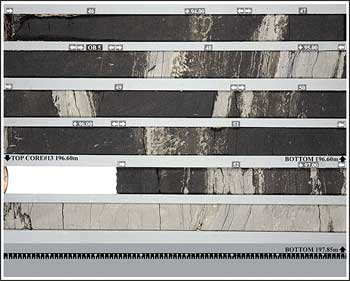
The well location (Fig. 5a) suggests that this well penetrates the cutbank side of the AC-fill deposit of channel A that is expected to dip toward the northwest. Underlying lateral accretion (IHS) beds of the channel B are expected to dip in the direction in which meanders developed, which is toward the southeast. Lithology confirms both interpretations, Figs. 7 and 9.
 |
|
Fig. 7. Core image of non-reservoir, abandoned channel-fill deposit. Image shows parts of the core from depth above 176 m of well X (Fig. 6a).
|
|
 |
|
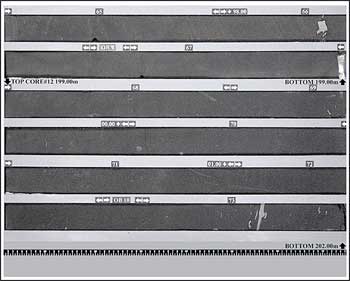
Fig. 8. Core image of reservoir Type I deposit, an apparently massive, clean sand from LPB deposit.
|
|
 |
|
Fig. 9. Core Image of reservoir Type II, sandy IHS-dominated deposit. Image shows parts of the core from depth below 176 m of well X (Fig. 6a).
|
|
Seismic traces show relatively strong contrast between two lithologies allowing tracing of the AC-fill deposit contact toward the north. Tracing suggests that channel A thickens to the north from Well X and that the true channel thickness is about 20 m, Fig. 6b. This interpretation is supported by the presence of channel-lag breccia along this elevation in nearby wells.
Dipmeter data supplemented with seismic also suggests that many erosional surfaces observed in cores are actually reactivation surfaces at points where PB deposits were reoriented, perhaps due to floods. This information suggests that observed erosional surfaces are not disconformities.
The mud-dominated nature of a majority of laterally-accreting beds in channel B may be explained as a function of the sinuosity of the channel B that indicates low-current energy. Analyzed internal architectures and mapped geometries, placed in view of the concept of increased proportion of UPB to LPB deposits as meander develops, suggest that LPB deposits for both channel A and channel B are predominant in the north and northeastern corner of the study area, Fig. 5b.
Finding stacked LPB deposits means finding thick and continuous Type I reservoir that allows for optimum commercial development. The absence of geological reflectors on seismic (dashed oval in Fig. 5a and 6b) indicates consistent lithology, perhaps supporting the interpretation of thick, stacked-LPB deposits. Other direct subsurface information confirms this suggestion (typical core image from that area, Fig. 8). More detailed characterization for placing horizontal developmental wells will be focused in that area to predict the actual recoverable reserves in the context of reservoir heterogeneities and SAGD technology limitations.
The above interpretation was not straightforward. Two instances of non-uniqueness between data presented challenges for integration of interpretation. In the first instance, seismic time slices seem to image scroll bars of channel A that extend in depth below the interpreted base of the channel. A detailed analysis suggested that this may be due to multiple reflection events propagating within the formation, a common issue with surface seismic imaging.
In the second case, seismic interpretation highlighted the presence of a 4-m to 5-m thick set of laterally accreting beds close to the upper portion of the reservoir. However, the set of laterally accreting strata were not recognized as a separate unit from dipmeter data. Subsequent review of the core data supported the seismic information and therefore seismic interpretation was honored in the mapping the extent of this channel deposit.
FUTURE WORK
The next step will be to use interpreted information as a framework for reservoir simulation. In these terms, upscaled geological facies are converted into facies assemblages (depositional architectural elements-LPB, UPB, AC, etc.) that were used for well-to-well correlation on each of geological cross sections, should be connected to form 3D objects. Those objects will possess similar reservoir properties for each individual channel and, if populated by empirically-derived averaged values for properties of interest, may be directly transformed into distinct reservoir flow units (huge cells). Such a model will provide a realistic 3D framework for reservoir simulations.
CONCLUSIONS
Although complex, subsurface reservoir geology of the McMurray Formation is mappable in the subsurface. However, only full use and integration of all available geological and geophysical data allows for a realistic geological interpretation and model for oil sands development purposes. It requires the teamwork of many geologists, geophysicists and engineers. 
ACKNOWLEDGEMENTS
The authors thank Nexen Inc. and OPTI Canada for allowing us to present data and interpretation for this case study. We also thank Adam Yakabuskie and Shin Ma for assisting in creating figures accompanying this paper. This article was modified from “Heavy Oil and Bitumen in Foreland Basins-From processes to products,” presented at AAPG Hedberg Conference, Banff, Alberta, Canada, September 30-October 3, 2007.
LITERATURE CITED
1 Williams, G. D., “The Mannville Group (Lower Cretaceous) of Central Alberta,” Bulletin of Canadian Petroleum Geology, No. 11, 1963, p. 350-368.
2 Wightman, D. M., and S. G. Pemberton, “The Lower Cretaceous (Aptian) McMurray Formation: An overview of the McMurray area, Northeastern Alberta,” Petroleum Geology of the Cretaceous Lower Manville Group, Western Canada, G.S. Pemberton and D.P. James, Canadian Society of Petroleum Geologists Memoir, No. 18, 1997, p. 312-344.
3 Hein, F., “The Great Canadian Oil Sands: Regional geologic framework and influence of salt-dissolution effects (abstract),” Basin Analysis Division luncheon talk, Canadian Society of Petroleum Geologists, Reservoir, No. 34, Issue 1, 2007, p. 20.
4 Mossop, G. D., and P. D. Flach, “Deep channel sedimentation in the Lower Cretaceous McMurray Formation, Athabasca oil sands, Alberta,” Sedimentology, No. 30, 1983, p. 493-509.
5 Choi, K. S., Dalrympale, R. W., Chun, S. S., and S. Kim, “Sedimentology of modern Inclined Heterolithic Stratification (IHS) in the macrotidal Han River Delta, Korea,” Journal of Sedimentary Research, No. 74, 2004, pp. 677-689.
6 Fustic, M., “Stratigraphic dip analysis-A novel application for detailed geological modeling of point bars, and predicting bitumen grade, McMurray Formation, Muskeg River Mine, Northeast Alberta,” Natural Resources Research, No. 16-1, 2007, p. 31-43.
7 Brekke, H., and R., Evoy, “Use of dipmeter data in the definition of the internal architecture of point bar deposits in the Athabasca Oilsands: Implications for the Middle McMurray Formation in the Hangingstone Area, Alberta,” Annual AAPG Convention, Dallas, 2004.
8 Thomas, R. G., Smith, D. G., Wood, J. M., Visser, J., Calverley-Range, E. A., and E. H. Koster, “Inclined heterolithic stratification-terminology, description, interpretation, and significance,” Sedimentary Geology, No. 53, 1987, p. 123-179.
9 Smith, D. G., “Modern point bar deposits analogous to the Athabasca oil sands, Alberta, Canada,” in P. L. de Boer, A. Van Gelder and S. D. Nio, Tide Influenced Sedimentary Environments and Facies, 1988, p. 417-432.
10 Strobl, R. S., Muwais, W. K., Wightman, D. M., Cotterill, D. K. and L. P., Yuan, Geological modeling of McMurray Formation reservoirs based on outcrop and subsurface analogues, in Petroleum of the Cretaceous Manville Group, Western Canada, G.S. Pemberton and D.P. James, eds.: Canadian Society of Petroleum Geologists Memoir 18, 1997, pp. 292-311.
11 Lettley, D.C., and Pemberton, S.G., “Speciation of McMurray Formation incline heterolithic strata: Varying depositional character along a riverine estuary system, (abstract)” in Annual Canadian Society of Petroleum Geologists Core Conference, Abstract Book, 2003, p. 6-10.
12 Gray, F. D., Anderson, F. P., and Gunderson A. J., 2006, “Prediction of shale plugs between wells in heavy oil sands using seismic attributes” in Natural Resources Research, v. 15, no. 2, p. 103-110.
13 Bellman. L., 2007, “Oil sands reservoir characterization: A case study at Nexen/OPTI Long Lake (abstract)” in Annual Canadian Society of Petroleum Geologists Core Conference.
14 Hayes, O. M., “Modern clastic depositional environments-Lecture notes for field school, Research Planning Inc.,” sponsored by Am. Assoc. Petroleum Geologists, 2002, variously paginated.
|
THE AUTHORS
|
|
|
Milovan Fustic is a Geologist in Nexen’s Synthetic Oil Group in Calgary, Alberta. He earned a BSc honors degree in geology from the University of Belgrade, Serbia and is a PhD candidate in petroleum geology at the University of Calgary. Fustic has 15 years of professional experience out of which the last 8 years were on various aspects of oil sands industry and research. Fustic has published and/or co-authored several papers and conference proceedings related to Alberta’s oil sands sedimentology, reservoir characterization, bitumen geochemistry and applied petrophysics (dipmeter). He can be contacted at milovan_fustic@nexeninc.com.
|
|
| |
Lori Skulski is a Geological Manager in Nexen’s Synthetic Oil Group in Calgary, Alberta. Skulski earned a BS degree in geological engineering from the University of Saskatchewan. She can be contacted at Lori_Skulski@nexeninc.com.
|
|
| |
Dale Vanhooren is a Geology and Geophysics Manager in Nexen’s Synthetic Oil Group in Calgary, Alberta. Vanhooren earned degrees in physics, geophysics and education and has worked for Nexen mainly as an interpreter in conventional gas, conventional heavy oil and synthetic oil for the past 8 years. He can be contacted at Dale_Vanhooren@nexeninc.com.
|
|
| |
Paul Bessette is a Geophysicist in Nexen Inc. for the Synthetic Oil Group in Calgary, Alberta. Bessette earned a BS degree in geophysics from the University of Calgary. He can be contacted at Paul_Bessette@nexeninc.com.
|
|
| |
Darren Hinks is a Geophysicist in Nexen Inc. Before joining Nexen’s Synthetic Oil Group in 2006, he worked on a project for Nexen as a geologist and geophysicist on Nexen’s Block 14 in Yemen. Hinks earned BS degrees in geology and geophysics. He can be contacted at Darren_Hinks@nexeinc.com.
|
|
| |
Laurie Bellman is the President of Oil Sands Imaging Inc., a seismic analysis company specializing in reservoir characterization of oil sands seismic data. Before starting this company in 2007, Bellman worked as a geophysical consultant for a number of companies, although mainly for Nexen Canada in the Synthetic Oil Group. She earned a BS honors degree in physics from the University of Victoria. She can be contacted at Laurie@oilsandsimaging.com.
|
|
| |
Dale Leckie is Chief Geologist in Nexen Inc. Leckie co-edited SEPM Special Publication 85, “Incised Valleys in Time and Space;” AAPG Memoir 55; “Foreland Basins and Fold Belts;” and Canadian Society of Petroleum Geologists Memoir 15, “Sequence Stratigraphy: Surface, Subsurface and Sedimentology.” Leckie is President of SEPM and was co-organizer of the 2007 AAPG Hedberg Conference on “Heavy Oil and Bitumen in Foreland Basins.” He can be contacted at Dale_Leckie@Nexeninc.com.
|
|
|


