An energy-efficient process yields a recovery factor of at least 75%.
Bruce C.W. McGee, E-T Energy
From September 2006 to August 2007, a Proof Of Concept (POC) test of Electro-Thermal Dynamic Stripping Process (ET-DSP) was completed by E-T Energy, Ltd. A numerical simulation study was done prior to the field test to quantify performance metrics, such as the amount of water usage per m3 of produced oil, the energy input requirements, kWhr/m3 of oil (i.e., an equivalent Steam Oil Ratio (SOR) value), greenhouse gas emissions, drilling performance, operating costs and process facility design.
Field performance met or exceeded expectations. The recovery factor was greater than 75%, the energy requirement per m3 of oil produced was 23% less than calculated, and peak production rates were greater than expected. The Water-Oil Ratio (WOR) was one with no greenhouse gas emissions in heating the oil. An insignificant volume of sand was produced, and the oil recovered had very little to no emulsions.
A comparison of the data with theory reveals that not all the drive mechanisms were considered in the initial numerical simulation. One of the more significant factors is the contribution of associated gas. Albeit in relatively small amounts, the gas evolving from the bitumen with rising temperature displaced the bitumen from the pore volume and accelerated recovery from the production wells.
INTRODUCTION
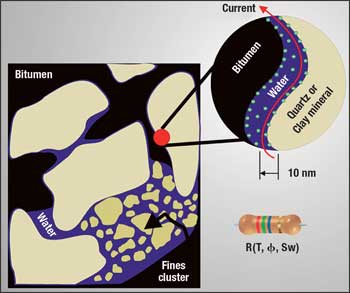
Electrical-thermal heating of the Alberta oil sands has been studied since the early 1970s.1,2,4,6,7,8 Heat is created in the bitumen reservoir as electrical current passes through the connate water, Fig. 1. At low frequency, the reservoir behaves like a resistor, and the conversion of electrical energy to heat is by ohmic losses. This article compares data from a pilot test of the ET-DSP process4 with numerical simulation.5 Construction and operation of the test were carried out from September 2006 to August 2007.
 |
|
Fig. 1. The conducting path for electrical current is through the continuous connate water that envelops the non-conductive sand particles. Electrical energy is converted to heat along these pathways, and the heat is transferred to the oil and sand particles by conduction. The large surface area between the water film and the sand particles facilitates the rapid transfer of heat.
|
|
The objectives of the POC were to:
- Determine the percent Recovery Factor, Ro
- Establish the Energy-Oil Ratio (EOR), i.e., the kWh/bbl of produced bitumen
- Determine the water consumption on a per-barrel basis of produced bitumen, WOR in m3/m3.
- Confirm numerical simulation temperature predictions
- Develop equipment and facility design basis, well completions, operating procedures and economic parameters for commercial development.
Table 1 summarizes the comparison between numerical model predictions and results from the pilot test. The recovery factor achieved in the POC was within the model prediction. The energy consumption was less than the predicted model by 23%. Converting the energy in terms of an equivalent SOR (SORe) = 0.49 , or a Net Energy Ratio (NER) of 30 times more energy produced in the bitumen than was used to produce it. The ratio of water used per produced barrel of bitumen was predicted to be one; slightly less than one was achieved in the POC.
| TABLE 1. Model vs. proof of concept comparison |
 |
|
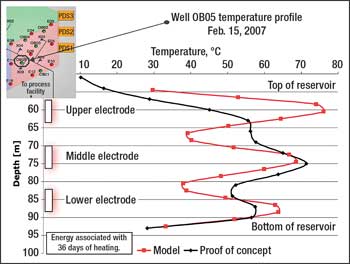
A comparison is shown between the modeled and actual temperature response at observation Well OB05, Fig. 2. The well is located approximately mid way between the electrode wells. The differences in peak and average temperatures are well within acceptable limits. Figure 2 shows the uniform heating over the 30-m reservoir thickness achieved in the pilot. In the model, the temperature profile has more vertical variation. This difference suggests that crossflow, and therefore, vertical convection is more pronounced in the reservoir than expected. The difference may also suggest that water injected into the electrodes in a wellbore is flowing uniformly into the oil sands. It is also noted that the power into the upper electrode is less than half of the predicted value.
 |
|
Fig. 2. Comparison of the temperature at OB05 with the model. The energy is associated with 36 days of heating. The OB05 temperature profile compares favorably with the model. The upper electrodes in the pilot were initially operated at less power than the model. Therefore the upper temperatures are not as high. The more uniform profile in OB05 suggests enhanced vertical flow in the reservoir than predicted which may result in better drainage. The difference in peak temperature is 6%.
|
|
ET-DSP POC
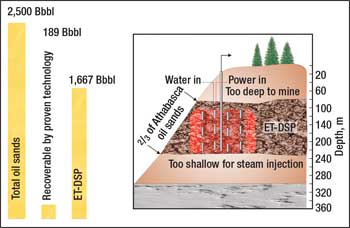
Background. There are presently two techniques used to produce bitumen: open pit mining and in situ thermal recovery, which involves drilling wells and injecting steam to heat the bitumen allowing it to flow and be produced from a well. Of the in situ methods now used, Steam Assisted Gravity Drainage (SAGD) is the most promising, having the advantages of lower energy requirements and higher recovery factors over other steam injection methods. However, about two thirds of the total deposit is too deep for surface mining and too shallow for steam injection3 but may be well suited for the ET-DSP process, Fig. 3.
 |
|
Fig. 3. For various technical and economic limitations, about two thirds of the total Athabasca Oil Sands Deposit is too deep for surface mining and too shallow for steam injection. This accounts for the huge difference between known and established oil sand resources. These stranded resources are ideally suited for ET-DSP due to the low operating pressure of the process and the economic efficiency of implementing the process on a commercial scale.
|
|
Transferring electromagnetic energy to the deposit is proving to be an effective means of supplying the necessary heat. In the electro-thermal process, electromagnetic energy is converted to heat in situ using a system of electrodes from which current flows through the formation. By proper choice of electrode location and spacing, considerable control can be exerted over the path taken by the current and, hence, over the temperature profiles that will develop in the formation. Electro-thermal processes are mostly free of problems related to very low initial formation injectivity, poor heat transfer, shale layers between rich oil sand layers, cap rock requirement, and the difficulty of controlling the movement of injected fluids and gases.
ET-DSP technology. Formation heating at power frequency has the advantage of the ready availability of 60 Hz power and the associated apparatus, such as transformers and measurement equipment. At these low frequencies, current flow in the formation is by ionic conduction through the water-saturated portion of the interconnected pore spaces, Fig. 1. Electrical energy is converted to heat along these pathways. The heat is transferred to the oil and sand particles by conduction.
The ET-DSP technology combines the features of electro-thermal heating with heat transfer by convection. Water is injected into the ends of the electrode where the power density is most intense. The injected water carries heat away from the electrode into the reservoir. The underlying benefit of combining convective heat transfer with electro-thermal heating is rapid and uniform heating of the reservoir.
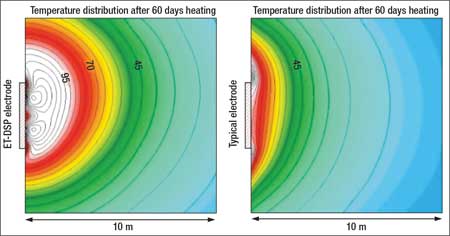
The comparison between basic electro-thermal heating and ET-DSP is demonstrated by the respective temperature distributions, Fig. 4. This figure shows a comparison of the temperature distribution resulting from an ET-DSP electrode and an electrode with no injection of water into it. The introduction of the convective heat transfer by injection of water into the ends of the ET-DSP electrode results in over ten times more oil sand being heated to above 70°C.
 |
|
Fig. 4. This figure shows a comparision of the temperature distribution resulting from an ET-DSPTM electrode and a conventional electrode. The introduction of the convective heat transfer by injection of water into the ends of the ET-DSPTM electrode results in over ten times more oil sand being heated to above 70°C.
|
|
Initially, all the fluids are immobile. As the temperature increases, the viscosity of the bitumen is reduced so that it can be produced from a production well. The water injection rate into the electrodes is comparable to the rate of fluid production from the reservoir (achieves voidage replacement). Consequently, the injection pressure is low, often equivalent to hydrostatic pressure or less. The average operating pressure of the reservoir is dropped to less than initial conditions as the bottomhole producing pressure at the production wells is reduced to maximize gravity flow of fluids into the wellbore. A cap rock to contain fluids and heat within the reservoir is not necessary.
THE POC DESIGN
For the T-I POC, the ET-DSP system was installed on a 50% scale. The smaller scale accelerates the time to obtain and analyze data. The power was turned on September 19, 2006, for testing and technical adjustments. Thermal operations went online with heat being delivered to the formation over the internet control on October 5th. First production from the extraction wells occurred on January 6, 2007.
On March 24, two of the reciprocating pumps (Wells X05 and X08) were replaced with Progressive Cavity Pumps (PCP). On June 11, 2007, E-T Energy began to sell clean bitumen to market. On June 30, power was turned off at the electrodes and on September 30 the extraction wells were shut-in, marking the end of the POC.
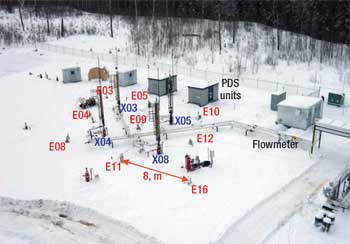
Figure 5 shows where the POC of the ET-DSP process was performed in the T-I pilot test area. There are nine electrode well (E-Wells) locations each completed with three electrodes, and four extraction wells completed with different pumping technologies. Five temperature observation wells are located within the T-I area to measure real-time data from every three meters through the pay zone. Three computer-controlled Power Delivery Systems (PDS) units with the capacity to deliver up to 30 kW per electrode.
 |
|
Fig. 5. The T-I Proof of Concept consists of 9 E-Wells, 4 X-Wells, 3 PDS Units, MCC Skid, and conventional surface piping and tankage.
|
|
The E-Well grid is formed on equilateral triangles with the length of the side equal to the spacing between E-Wells. An ET-DSP element is defined by the triangle. Each element consists of effectively half an E-Well because of symmetry. The four production wells (X-Wells) are located on a rectangular grid between the E-Wells. The X-Wells were originally completed with positive-displacement-beam lift pumps. Two of the X-Wells were later equipped with PCPs. Three on-site PDS units were connected to the 27 electrodes. Each PDS unit was internet controlled and monitored the operation of each electrode in real time. The process facilities were similar to those associated with a heavy-oil battery. Thermally insulated and heat-traced piping were run between heated tanks. Water-oil-sand separation was effected by gravity with some diluent mixing to accelerate the process. A heat exchanger was piped into the flow process but was rarely used. Data was monitored through flowmeter, tank gauging, temperature points, and pressure on a daily basis.
Table 2 summarizes the reservoir properties at the T-I POC site. The depth to the top of the bitumen-rich McMurray reservoir extends through 51 m of overburden. The average gross thickness was 35 m with a net thickness of about 30 m. The area of each ET-DSP element is 27.71 m2; with eight elements subtending a total area of 221.70 m2. The bitumen in place, based on a 30% porosity, 80% oil saturation, and 30 m of net pay is, 1,596.26 m3 (10,000 bbl).
| TABLE 2. Summary of the T-I POC reservoir properties |
|
|
The ET-DSP production cycle consists of three significant operational events. Following the pre-heat phase, there is a 180-day production period operating concurrently with electro-thermal heating. The final phase consists of turning off the heating and producing fluids from the oil sands using the residual heat. From the start of production, the watercut steadily increased as more bitumen is produced. At about 50% recovery of the bitumen, the watercut became 50%. This is coincident with the end of the heating and producing cycle. By the end of the producing cycle, the recovery factor was expected to be 75% with an EOR of 80 kWh/bbl. The duration of an ET-DSP production cycle is 365 days.
OPERATIONS
Within days of turning on the production wells, the operational difficulties with producing the bitumen using reciprocating pumps became evident. As the bitumen flowed from the heated reservoir and up the production tubing, it cooled enough to become viscous and sticky. Gas became trapped in the viscous bitumen, locking the pump. To exacerbate the problem, the cooled viscous bitumen prevented the pump from rapidly moving up and down resulting in what is known as a rod-fall problem.
The installation and operation of the PCP in the extraction wells was a pivotal moment for the ET-DSP POC’s success in the oil sands. The PCP’s notable characteristics were:
- Performance is not affected by gas. This means capitalizing on the gas-drive mechanism enhances bitumen flowrates.
- Can produce very viscous (greater than 100,000 cP) bitumen, meaning that substantial bitumen can be produced before achieving maximum temperatures, therefore, saving energy.
- Installation costs for PCPs were a fraction of the reciprocating pump.
- The PCP can be controlled accurately over the internet to optimize recovery and production rates.
Well X05 was completed with a new PCP and is surrounded by 4 of 16 operational electrodes (75% failure rate) and still delivered the following results:
- A recovery factor of 77%; models predicted a 75% recovery factor.
- The EOR was 61.52 kWh per produced bbl of bitumen; models predicted 80.00 ( 25% less energy was used).
- Despite the failed electrodes, E-T Energy effectively demonstrated that half the number of extraction wells will achieve performance targets. The POC was based on a 1:1 ratio of electrodes to extraction wells, the results from the POC demonstrated that a 2:1 ratio will work.
- Makeup-water volume was less than the bitumen produced. The remaining water came directly from the reservoir. The WOR was less than one-models predicted a value of one.
E-Wells. Seventy-five percent of the electrodes failed. The good news was that more than 3/4 of the budgeted energy was injected before the failures and the performance targets of the POC were all achieved despite the failures.
The electrodes failed at about the same time that the extraction wells started producing. Sands shifting caused the cement plugs above the electrodes to fall and damage the cables.
The PDS units and water injection facilities operated without incident throughout the POC. It was possible to control power to individual electrodes at any time over the internet, monitor voltage, current, resistance, and power in real time, and create software-driven emergency and safety shutdown procedures. Cold weather conditions did create some challenges with the water injection system. Once the produced water reached the requisite temperature, cold weather became less of an issue. The water injection rates and volumes were monitored and controlled over the internet.
 |
|
Fig. 6. Bitumen production. Approximately 2,200 bbl of sand and emulsion-free bitumen was produced and sold to market. It is estimated that 85% of the produced bitumen was extracted from Well X08.
|
|
RESULTS
A total of 2,200 bbl of bitumen was produced during the POC. Minor volumes of oil were produced during the months of January and February 2007, when only the reciprocating pumps were used, Fig 6. Results showed a dramatic increase in production with the installation of PCPs in wells X08 and X05. Effective heating began in October 2006. However, the surface facilities were not fully commissioned until January 2007, marking the onset of production. The energy input rate to the electrodes was moderated so that when production operations began, the energy injected into reservoir was equivalent to a 30 day pre-heat phase.
Due to the large percentage of failed electrodes, the location of the electrodes, and that Well X05 was the only PCP well that was installed through the entire pay zone, the focus was on its production performance. Well X05 was operating under less-than-ideal conditions with only four of the 16 electrodes functioning. An estimated 85% of the recovered bitumen was produced.
A comparison of theoretical production developed from numerical simulation and actual production data from X05 showed that the curves are similar in shape and the area under the curves are almost identical, with the actual cumulative production being slightly more-77% versus 75% recovery, Fig. 7.
 |
|
Fig. 7. Theoretical ET-DSP production cycle compared to the Proof of Concept for Well X05. The curves are similar in shape and the area under the curves are almost identical with the actual cumulative production being slightly more; 77% versus 75% recovery.
|
|
The theoretical peak rate is about 2.5 m3 per day and occurs immediately after ramp up. The actual peak is almost the same, except that it peaks even higher again the following month. A possible explanation may be found in the benefit of the gas liberating from the bitumen and expanding with increasing temperature, along with the steam, and driving the oil towards the production wells. This is commonly referred to in conventional oil reservoirs as a solution-gas drive mechanism. For actual X05 production, the pump speed was minimized during the evening when no one was on site. The low rates during the evening shift were averaged into the daily production rate.
This difference is due to injection of energy into the reservoir around Well X05 at a rate of 25% less than the target energy. Consequently, the relatively smaller remaining energy results in the formation and bitumen cooling more rapidly. The cooler bitumen will have a higher viscosity and result in a lower production rate. The other reason has to do with heat losses. In the theoretical calculation, there are heating patterns enveloping the producing element. Therefore, heat losses from the sides of the element are essentially zero. In the actual case, heat is lost to the outside of the heated volume and into the adjacent reservoir that has not been heated. The heat losses will cool down the reservoir more rapidly, resulting in bitumen that has a higher viscosity and lower productivity.
In summary, the production performance from the POC exceeded expectations. E-T Energy was able to demonstrate that expected recovery factors (as high as 77%) could be achieved with much less energy than predicted. It is worth pointing out that the EOR of 61.52 kWh per bbl achieved for the production of bitumen from Well X05 is equivalent to a SOR of 0.49.
Although many of the electrodes failed, the reservoir did get hot-from top to bottom. Figure 2 shows the temperature profile at the observation well OB05 and the expected profile calculated from the model. Given that the reservoir extends from 52 to 89 m, the data shows how the entire interval has increased in temperature. This increase in temperature, throughout the entire pay zone, was achieved in 30 days. Peak temperatures of 75°C to 80°C are consistent with the numerical model.
ELECTRO-THERMAL PROCESS ADVANTAGES
The thermal efficiency of using electrical energy may offset the higher cost often associated with electrical power. Based on results from the POC, electro-thermal heating can be four times more thermally efficient with an SORe of 0.49, an EOR of 62 kWh/bbl, and an NER of more than 30.
The recovery factor of the electro-thermal process was 75% or more. There may be improvements to the technology that increase recovery factors. The WOR was less than one. Electro-thermal heating offers the following advantages to heating the formation that are not available with other thermal methods:
- Rapid and uniform heating without the need for injecting and displacing fluids and thus negatively impacting the saturation distribution in the formation for bitumen flow
- Operating the reservoir at lower pressure allowing for shallow operations
- Increasing productivity area at the many extraction wells to produce bitumen more rapidly than from a single wellbore
- Maintaining ongoing pressure of the formation, through voidage replacement, increases the driving force to mobilize the bitumen toward the extraction wells.
KEY LESSONS LEARNED
The electrodes for well completion have been redesigned to protect its electric cables and prevent snapping due to excessive load bearing down on the electrode. There will be no cement plugs or other weight over the electrodes until such time as the electrode wells are abandoned.
Surface facilities can be limited to just oil-water separation process. Sand handling and emulsion treatment facilities are not necessary. The heat exchanger was an operational challenge, provided little benefits, and was rarely used. Temperature monitoring can be limited to extraction wells only. Additional observation wells were useful but necessary. A bitumen-diluent mixing facility proved to be very advantageous. All new wells will be equipped with PCP pumps that can be controlled for optimized operations. From the time of installation to the end of the POC there was zero downtime with the PCP pumps.
CONCLUSIONS
Based on the performance of the POC, electro-thermal processes, such as the ET-DSP process, provides an additional effective in situ thermal recovery technology for the production of bitumen from oil sands. E-T Energy has successfully designed, constructed and operated the ET-DSP process in the Athabasca Oil Sands, heat the bitumen, and produce it to surface to storage tanks. Bitumen production was essentially sand free with virtually no emulsions, using less energy than expected. With the production of sand- and emulsion-free bitumen, it was cost effective to simply sell bitumen to the market.
E-T Energy has developed an inventory of “how-to’s” that take advantage of existing services in the industry that will result in cost savings for the future. We expect far fewer operations will be needed per barrel of oil produced than other approaches. Overall, the system was easy to install, quick to commission, and provided for a rapid startup-a plug-and-play approach to bitumen recovery. 
ACKNOWLEDGEMENTS
The author thanks E-T Energy for permission to publish the results of this project, Dr. Vermeulen for his helpful input, and the staff at E-T Energy. This article was prepared from Paper 2008-209, presented at the Canadian International Petroleum Conference/SPE Gas Technology Symposium 2008 Joint Conference (the Petroleum Society’s 59th Annual Technical Meeting), Calgary, Alberta, Canada, June 17-19, 2008.
LITERATURE CITED
1 F. S. Chute, F. E. Vermeulen, and M. R. Cervenan. “Physical modeling of the electrical heating of the oil sand deposits,” Technical Report AOSTRA Agreement No. 31, Applied Electromagnetics Group at the University of Alberta, 1978.
2 F. S. Chute, F. E. Vermeulen, and M. R. Cervenan. “Physical modeling of the electromagnetic heating of the oil sand and other earth-type and biological materials,” Canadian Electrical Engineering Journal, 1979, 4(4): pp. 19-28.
3 Jan Czarnecki, Boryan Radoev, Laurier Schramm, and Radomir Slavchev. “On the nature of the athabasca oil sands,” Advances in Colloid and Interface Science, 114, No. 115, March 2005, pp. 53-60.
4 Bruce C. W. McGee and Fred. E. Vermeulen. “In situ electromagnetic heating for hydrocarbon recovery and environmental remediation,” Journal of Canadian Petroleum Technology, distinguished authors series, 39, No. 8, August 2000, pp. 25-30.
5 Bruce C. W. McGee and Fred E. Vermeulen. “The mechanisms of electrical heating for the recovery of bitumen from oil sands,” Journal of Canadian Petroleum Technology, 46, No. 1, January 2007, pp. 28-34.
6 F. E. Vermeulen and F. S. Chute. “Electromagnetic techniques in the in situ recovery of heavy oils,” Journal of Microwave Power, 18, No. 1, 1983, pp. 15-29.
7 F. E. Vermeulen, F. S. Chute and M. R. Cervenan. “Physical modeling of the electromagnetic heating of oil sand and other earth-type and biological materials,” Canadian Electrical Engineering Journal, 4, 1979, pp. 19- 28.
8 F. E. Vermeulen, F. S. Chute and R. G. McPherson. “Physical modeling of electrothermal processes in oil sand,” Alberta Oil Sands Technology and Research Journal of Research, 4, 1988, pp. 299-305.
|
THE AUTHOR
|
|
|
Bruce C. W. McGee is President and CEO of E-T Energy, a private oil sands company with leases in the Athabasca Oil Sands Region. McGee earned a BSc degree in 1980, a M Eng degree in 1984, and a PhD degree in 1998, all in electrical engineering, from the University of Alberta. He also earned an ME degree in chemical engineering in 1989 from the University of Calgary. McGee has extensive technical and business experience in the oil and gas and environmental industries.
|
|
| |
|
|


