An operator in eastern Ecuador takes advantage of existing ESP capabilities to provide a solution to reservoir management problems.
Carlos Lara, Enrique Ramon and Edwin Vizcarra, Enap-Sipec; Miguel Perez, Cesar Contreras, David Amores, Schlumberger
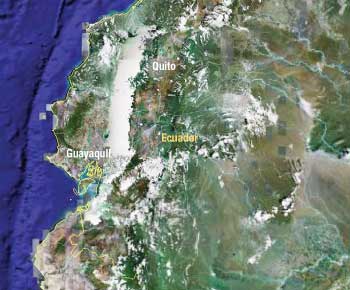
Ecuador’s MDC Field is located in Orellana Province, which lies on the eastern slopes of the Andes Mountains, about 110 mi (176 km) east of Quito, Fig. 1. Operated by Enap-Sipec the field consists of 17 producing wells plus a single injector that is used for re-injection of produced water. The field produces from three reservoirs: the “U” sand, the “T” sand and the Hollin Superior sand. Total production from the field is about 14,000 bopd.
 |
|
Fig. 1. The MDC Field is in eastern Ecuador, just south of the equator and about 110 mi (175 km) east of Quito.
|
|
All the producing wells in MDC Field use Electrical Submersible Pumps (ESPs) to lift produced fluids to the surface. The pumps are all equipped with Phoenix downhole sensors and are connected to an ESP-monitoring system. This system provides several advantages in managing field operations including real-time monitoring of downhole pressure and temperature, as well as monitoring critical pump performance parameters that are used to maximize pumping efficiency and alert the operator of any developing problems.
BACKGROUND
Under Ecuadorian law, whenever a new well is drilled or a new zone is opened to production, a production quota must be requested from the National Hydrocarbon Directorate, the government agency in charge of regulating the development of hydrocarbon resources. Typically, the procedure involves derivation of the Inflow Performance Relationship (IPR) curve for the zone, calculated using production data, bottomhole flowing pressures obtained from production tests, and static reservoir pressure. The static reservoir pressure is usually obtained from pressure transient analysis.
Familiar to reservoir and production engineers, pressure transient analysis involves creation of a pressure disturbance in the reservoir, then observing the speed and nature of the reservoir’s recovery to a stable state. The well is produced for a period until bottomhole pressure and rates become constant, then it is shut in and the pressure buildup back to static reservoir pressure is recorded, usually with a memory pressure/temperature gauge. The process can be time consuming and often problematic. Frequently, the tests are concluded prematurely, before sufficient data have been gathered, or conversely, they are prolonged past the point needed to produce the static reservoir pressure, wasting valuable time.
The solution to premature or prolonged testing periods has been downhole monitoring of test pressures in real time. Well-testing service providers can install the required downhole sensors, valves and telemetry to accomplish the task. In addition to obtaining the required IPR curve and static reservoir pressure, interpretation of the pressure transient data by trained reservoir engineers yields much valuable information including the presence and effect of near-wellbore formation damage known as skin. Unfortunately, to perform a proper well test requires that the well be shut down temporarily during test-equipment rig up and data acquisition.
A BETTER WAY
Faced with a scheduled shutdown on one of the MDC Field producing wells to fulfill government requirements, engineers at Enap-Sipec looked for a way to satisfy legal obligations without a lengthy interruption of production. It was decided to take advantage of the existing metrology present in the ESP-monitoring system to obtain the required data. For ESP-operated wells, every pump shutdown (buildup) and startup (drawdown) is an opportunity to evaluate well productivity and obtain reservoir parameters. Schlumberger’s Advanced Lifting Services offers a way to monitor a pressure transient in real time, by using its espWatcher, so that the quality and quantity of test data meet the objectives. The well to be tested was tapping the “U” sand reservoir.
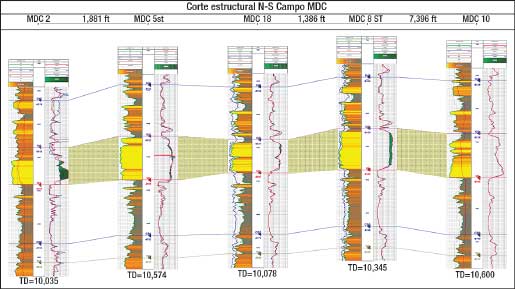
A continuous sandstone reservoir, the “U” sand, lies about 9,500 ft (2,896 m) deep. It has an average thickness of about 50 ft (15.2 m). Porosity and permeability average 17% and 500 mD respectively. The reservoir produces 18°API oil with a bubble pressure of 850 psi (5.86 MPa) and viscosity of 9 cP at reservoir pressure and temperature, Fig. 2.
 |
|
Fig. 2. Structure of the “U” sand is illustrated by log suites from five wells: MDC-2, MDC-5 (sidetrack), MDC-18, MDC-8 (sidetrack) and MDC-10.
|
|
The drainage mechanism is mixed, comprising rock/fluid expansion and a weak lateral water drive. The original reservoir pressure in the field was 3,500 psi (24.13 MPa) at 9,500 ft. Actual reservoir pressure today is around 2,000 psi (13.8 MPa) following cumulative field production of about 11 million bbl of oil. Reservoir pressure varies, with wells having the highest static pressure located toward the southeast side of the field. Unfortunately, the highest-pressure wells are major water producers, with watercuts up to 60%. This has led to the hypothesis that the lateral pressure support originated in an aquifer located in the southeast portion of the field.
The original plan to acquire the data required shutting in the well for about 30 hr. The objective was to get the data in the shortest time to avoid deferring production.
Using downhole sensors already installed in the ESP, the engineers hoped to perform real-time monitoring of the pressure buildup test. This would allow reduction of shut-in time should the test objectives be achieved before the planned 30-hr duration of the test. Conversely, real-time monitoring would also allow the test to be extended if objectives had not been met after the planned time had elapsed. This would eliminate having to perform the test again because of inconclusive results from a prematurely abandoned measurement period.
Finally, considerable cost benefits and time savings were realized by using existing equipment to achieve the objectives instead of hiring a well-service team to perform a traditional production test.
RESULTS VALIDATE METHODOLOGY
The real-time pressure test began on Feb. 11, 2008, Fig. 3. ESP sensors recorded drive frequency, intake pressure and temperature data that were transmitted by satellite to the service company’s production center in Oklahoma City. Pressure began to build up immediately when the pump was shut off, and became asymptotic within a few hours. As soon as the infinite-acting radial flow regime was achieved, the test was concluded, thus reducing shut-in time to the minimum. Simulations were run at 18, 24 and 36 hours after shut-in looking for the best match on the log-log diagnostic plot (Fig. 4), the semi-log Horner plot and the pressure history plot to determine when the correct flow regime had been reached, confirming that the pressure transient was in the proper regime to derive correct results.
 |
|
Fig. 3. Real-time well test illustrated by pressure (blue) and temperature (red) data from downhole gauges located on the ESP.
|
|
 |
|
Fig. 4. Log-Log diagnostic plot matches pressure derivatives versus time derivative to determine when infinite-acting radial flow regime has been reached.
|
|
As the test revealed, the well reached infinite-acting radial flow after 44 hr. Had the test been concluded at the planned 30 hr, results would have been inconclusive and the test would have to be repeated, doubling the cost. Conversely, had the test been prolonged for 60 hr to ensure valid data acquisition, valuable time would have been wasted. Real-time measurements prevented the two most common well-test problems from occurring.
PROBLEM SOLVED
With the initial objective of regulatory compliance accomplished, the engineers examined the data to determine the well’s performance efficiency within the reservoir. Near-wellbore skin damage in excess of 25 was determined, resulting in a pressure drop of about 1,102 psi (7.6 MPa). This was equal to 58% of the actual reservoir pressure and indicated that the well was seriously underperforming.
From the data, a system nodal analysis was run that postulated solutions for different values of skin effect, Fig. 5. The nodal plot showed that with a reduction of skin to 10, net oil production would increase 85%, and if skin effects were completely removed, net production could be boosted by 330%. Based on these analyses, the service company elected to perform an aggressive matrix treatment to reduce the skin.
 |
|
Fig. 5. System nodal analysis provides possible solutions based on reduction of skin damage.
|
|
CONCLUSION
Real-time measurements from ESP sensors can be adapted to perform downhole well and reservoir analyses. Downtime can be minimized without jeopardizing measurement validity. Reservoirs can be managed more effectively, thus prolonging their economic life and increasing recovery. Pump performance can be tuned to the best scenario to forestall early water breakthrough, optimizing field conformance. Continuous downhole data monitored from all ESP wells can be used in aggregate to improve overall reservoir performance. 
|
THE AUTHORS
|
| |
Carlos Lara is a production manager and project director for Croduc, Poseidon, MDC Extension and other projects for Enap-Sipec, S.A. Lara has 29 years of experience in the oil and gas industry, having worked in Empresa Nacional del Petroleo in Magallanes, Sipetrol International and Sipec Ecuador. He earned a mechanical engineering degree from Universidad de Santiago, Chile, a civil mechanic engineering degree from Universidad de Magallanes, Chile, and is a licentiate in managerial development programs from the University of Chile PDG.
|
|
| |
Enrique Ramon V is a reservoir engineer for Enap-Sipec S.A. in Ecuador, focusing on well test evaluation, workover analysis and production optimization. He earned a petroleum engineering degree at Central University of Quito, Ecuador. He is a member of SPE.
|
|
| |
Edwin Vizcarra is a reservoir engineer at Qatar Petroleum with experience in Argentina and Ecuador. He is also a simulation expert and previously worked for Perez Companc, Petrobras, and Enap-Sipec. Vizcarra holds a petroleum engineering degree from Escuela Politecnica Nacional, Ecuador.
|
|
| |
Miguel Perez is the artificial lift sales manager for Schlumberger Ecuador, based in Quito, Ecuador. He has 11 years’ experience in the oil and gas industry and has developed additional artificial lift expertise since joining Schlumberger in 2000, being exposed to different lifting methods such as gas lift, ESPs and hydraulic lift. Perez earned a bachelors degree in industrial engineering from Universidad del Zulia, Venezuela.
|
|
| |
Cesar Contreras is a senior reservoir engineer at the Schlumberger Production Center of Excellence in Oklahoma City. Contreras worked in the oil and gas industry for over 24 years mainly as a reservoir engineer, before joining Schlumberger in 2006. He previously worked for Expro Group, Halliburton, Graña Montero Petrolera and Petroperu. Contreras earned a petroleum engineering degree from Universidad Nacional de Ingenieria, Peru. He is an active member of SPE.
|
|
| |
David Amores is a sales and technical support engineer for Schlumberger, based in El Cocha, Ecuador. His areas of expertise include artificial lift, sales, and optimization and monitoring. David received his automotive engineering degree from Escuela Politecnica del Ejercito de Latacunga, Ecuador.
|
|
|

