Conventional 3D coverage disappeared in shallow-depth imaging. High-resolution data was necessary to determine fault locations.
A. O. Okojie-Ayoro, J. H. McBride, R. W. Keach II and J. V. South, Brigham Young University; T. C. Anderson and B. J. Black, Rocky Mountain Oilfield Testing Center
Using the Teapot Dome Field near Casper, Wyoming, US, as a test case, we demonstrate how high-resolution seismic surveys furnish a clearer picture of shallow reservoirs as well as the relationship between deep and shallow faults. The Upper Cretaceous Shannon Sandstone, the shallowest petroleum reservoir at Teapot Dome (about 250 to 650 ft (76-198 m)), can only be imaged properly with high-resolution seismic methods. We identify faults and deformation structures that penetrate and could potentially partition the Shannon reservoir. Integration of these results with information from conventional 3D seismic and well-log data suggests that at least some shallow faults have propagated from depth. Furthermore, high-resolution imaging provides a means to better constrain the location of faults mapped from well logs. High-resolution imaging becomes critical in cases of shallow reservoirs where it is important to understand compartmentalization of production, fluid communication between the deep and shallow reservoirs, or continuity of structures from depth into the shallow subsurface.
BACKGROUND
The resolving power of 3D seismic data depends on spatial sampling (e.g., the Common Depth-Point (CDP) footprint) and the frequency content of the seismic survey. These factors impose resolution limits on the subsurface structures that can be imaged adequately. Typical 3D CDP bin sizes of 55-110 ft (17-34 m) may prevent coherent imaging of shallow reservoirs and subtle deformation or stratigraphic features in the shallow subsurface. The Shannon Sandstone is one of the main hydrocarbon-producing intervals at Teapot Dome, comprising about 50% of the total production at Teapot Dome; however, information on the structure of the Shannon reservoir has been limited to log correlations from wells.
Teapot Dome is one of several basement-involved Laramide anticlines1 in the Rocky Mountains that host hydrocarbon reservoirs in Wyoming with a well developed and studied fracture system, Fig 1.2 The fold is associated with a west-southwest-vergent thrust fault as inferred from 3D seismic data, Fig. 2. Several faults are exposed and have been mapped in outcrop, but their relation to deeper faults is undocumented, Fig. 3.2-4
 |
|
Fig. 1. Location of basins and uplifts in eastern Wyoming, and Teapot Dome with respect to the Powder River Basin. Modified from Cooper et al.
|
|
 |
|
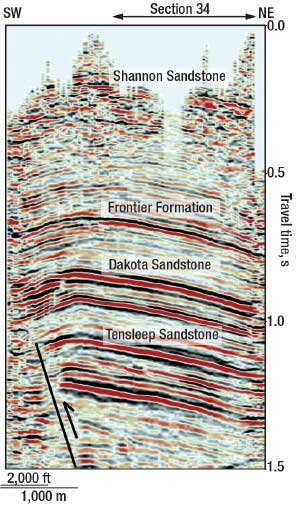
Fig. 2. Seismic cross-section extracted from the 3D volume diagonally through Section 34 showing west-southwest-vergent basement-cored thrust.
|
|
 |
|
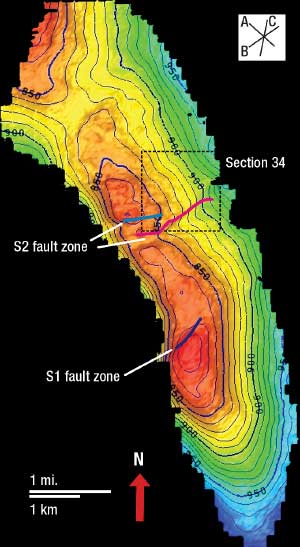
Fig. 3. Travel time “structure” mapped from 3D seismic at the Dakota Formation level. The faults in the S1 and S2 faults zones are indicated. The southernmost fault strand within the south-dipping S2 zone corresponds to the fault crossed by our surveys in Section 34. Hotter colors represent highs and cooler colors represent structural lows. Contour interval is 10 ms. Inset in upper right corner indicates general strike directions of faults and fractures mapped in outcrop.
|
|
Cooper et al. detailed two sets of faults at the Parkman Member of the Cretaceous Mesaverde Formation. The fault set that is most common along the eastern limb of the anticline consists of northwest- and southeast-dipping normal and normal-oblique faults that strike northeast with a right lateral slip. The fault set that dominates the southern hinge of the anticline consists of normal conjugate faults with northeast and southwest dips striking subparallel to the hinge of the fold.2 The faults on the eastern limb have offsets of up to 131 ft (40 m), which decreases to the southwest where small offsets of 0-1 ft (0-30 cm) are observed.
METHODOLOGY
Although previous subsurface mapping at Teapot Dome has produced seismic images of faults at deep hydrocarbon reservoir levels (Fig. 3), the true upward vertical extent of these faults into shallow reservoirs cannot be resolved using conventional seismic data, as shown by comparing time slices at different levels, Fig. 4. This study tests the applicability of high-resolution P- and SH-wave (compressional and horizontally polarized, respectively) reflection data acquisition with a small CDP bin that can be integrated with conventional 3D seismic data and correlated well logs. Our target is a previously recognized near-surface fault zone in the interior of the oil field, centered on Section 34, Fig. 2. The behavior of a P-wave is controlled in part by the medium bulk modulus, and thus affected by the presence of fluid, while the SH-wave velocity is dependent on the density and shear modulus of the medium. The ability to resolve shallow subsurface structures in a medium using SH-waves is due to their slower travel time and shorter wavelength, which varies from one half to one third of the wavelength of P-waves.5
 |
|
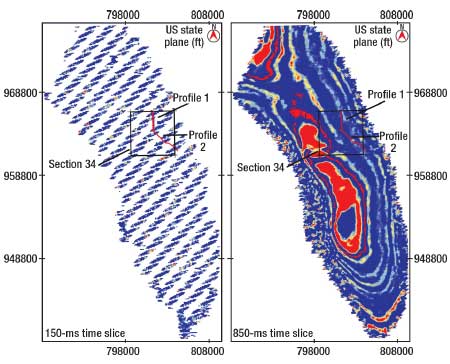
Fig. 4. Time slices of 3D data at 150 ms (left: near Shannon Sandstone depth) and 850 ms (right: near Dakota Sandstone depth) showing how CDP coverage dies out in shallower formations.
|
|
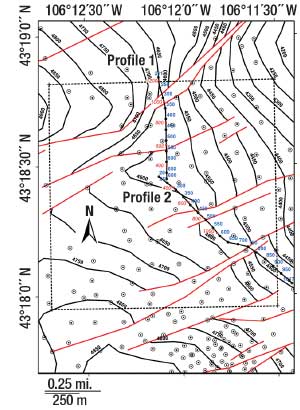
Two pairs of high-resolution 2D seismic P-wave and SH-wave profiles were acquired within Section 34 of the Teapot Dome oil field: Profile 1 trends roughly north-south, while Profile 2 trends northwest-southeast, Fig. 5. 2D profiles extracted from the 3D volume provide images of structures for depths corresponding to 500-ms to 1,300-ms travel time, but structures are not resolvable at the shallowest producing (or Shannon) levels (locally, 150-200 ms) because resolution begins to die off before 500 ms, leaving typical V-shaped gaps from the first-break mute and the drop in CDP fold, Figs. 2 and 4.
 |
|
Fig. 5. Structural contour map (elevations in ft above sea level) for the top of the Shannon Sandstone centered over Section 34 (dashed square) of Teapot Dome showing faults (red lines) and well locations (circles) from which the elevations of the Shannon were taken.6 P-wave CDPs shown in blue, SH-wave, P-wave shown in red.
|
|
A 100-lb (45-kg) accelerated weight dropper mounted on the back of an all-terrain vehicle served as the P-wave source. The records were recorded by a 48-channel roll-along CDP recording system using 28-Hz geophones. The receiver and source spacing was 10 ft (3 m) for the P-wave surveys. For the SH-wave surveys, a land streamer technique7 was used that involves a 12-channel, 14-Hz horizontal geophone spread pulled by a truck, with a 5-ft (1.5-m) receiver and source spacing. This technique utilizes gravity coupling of two horizontal geophones mounted opposite each other on steel sleds, which cancels the P-waves while the two components of the SH-wave are field-summed. The SH-wave source was a 2-lb (1-kg) steel mallet, struck against a vertical metal plate.
Data processing involved a routine series of steps, the most critical being muting of first breaks while allowing reflections that may merge with the head waves, a common problem in high-resolution seismic data.8 The mute was also chosen to eliminate strong surface wave contamination, which focused the CDP stack on the high-apparent velocity field. Refraction static corrections were applied with a replacement velocity of 9,000 ft/s (2,743 m/s) and an elevation datum of 5,500 ft (1,676 m) to match those of the previously processed 3D seismic data set, so that 2D and 3D data can be directly compared in travel time. SH-wave data processing was similar, except that only elevation statics were applied and a mute was designed to suppress the effect of surface, or Love, waves.7
Using the dipole sonic log for the interval of interest (from the southern section of the field) the vp/vs was determined to be between 2 and 3. For simplicity, we used a ratio of 2, which would give maximum converted depths for the SH-wave seismic profiles. A replacement velocity equal to one-half that of the P-wave data was used. The SH-wave data are not as high quality as the P-wave data, and were acquired to test an alternative to shallow imaging to be compared with the P-wave data. Although migrations of the stacked sections were tested, we display the data unmigrated because the dips of the reflectors were low.
OBSERVATION AND INTERPRETATION
Several northeast-striking normal faults, part of the S2 fault zone, can be mapped from the well data in Section 34 and cross the 2D seismic profiles, Fig 5. Profile 1 crosses the largest fault mapped in this part of the field, while smaller faults are crossed by Profile 2, Figs. 6 and 7. Most of these faults were observed from the well data to have relatively small displacements (less than or equal to 100 ft (30 m)), Fig. 5. The P-wave and SH-wave profiles show the most detailed reflection images of faults yet observed in the shallow subsurface at Teapot Dome, Figs. 6 and 7. The prominent reflection is interpreted as arriving from the boundary between the Shannon (or an interface just above it) and overlying Steele shales, based on correlation with well logs and previous Shannon picks on the 3D seismic volume. Faults imaged here cut through Shannon intervals at depths below datum of around 623 ft (190 m, times are converted to depth using the replacement velocity).
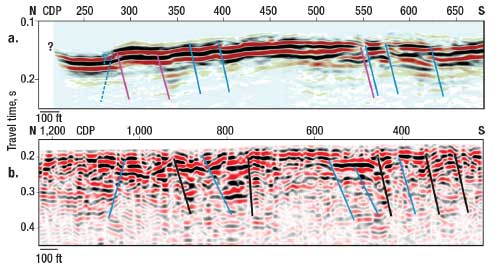
Profile 1. The reflectivity on P-wave Profile 1 shows a slightly anticlinal geometry that mimics the shape of deeper horizons and structure maps constructed from the 3D seismic volume, Fig. 6a. However, the details of this geometry are not resolvable from the 3D volume or the well-based structure contour map.
 |
|
Fig. 6. (a) Unmigrated seismic reflection Profile 1 with interpreted faults. Blue faults were mapped from high-resolution seismic data alone. Pink faults are mapped from well data. CDP interval for these other high-resolution P-wave profiles is nominally 5 ft. The dip angle of the fault on the high-resolution data is not well constrained and actual dip angles could be higher than drawn. (b) Unmigrated SH-wave seismic Profile 1 showing denser faulting (black faults) than can be observed on the P-wave profile. Blue faults correspond with those mapped on the P-wave profile in Fig. 6a. CDP interval for this other high-resolution SH-wave profiles is nominally 2.5 ft.
|
|
The Shannon reflection on Profile 1 is offset by several subtle faults detected by lateral coherency changes, reflection orientation changes or abrupt offsets. Faults with reflectors down-thrown mostly to the south (dip directions are apparent, in the plane of the section) and a northernmost fault having a downthrown side apparently to the north are observed in Profile 1. The direction of throw of the latter fault is difficult to ascertain since not all of the structure is visible along the profile. Furthermore, this feature appears near the end of the profile, where the CDP fold begins to drop and the shallow velocity structure derived for static corrections may not be well constrained, and so it should be interpreted with less confidence.
The southernmost faults (CDPs 550 and 570) are the most prominent and actually define a zone of faulting, where offset is roughly 66 ft (20 m), although larger offsets may be permitted by the seismic profile. This area appears to match the greatest faulting, crossed by the profiles, as defined independently from structural contouring. The full extent of the apparent dips cannot be determined from the 2D seismic data alone because deeper offsets are not observable. The calculated throw of the largest faults is more or less consistent with displacements reported in nearby outcrops and inferred from well data.
The first reflectivity on SH-wave Profile 1 corresponds with the expected time for interfaces above and possibly including the uppermost part of the Shannon, Fig. 6b. SH-wave reflectivity begins at about 200 ms, corresponding to 450 ft (137 m), and continues to 675 ft (206 m), below datum for a replacement velocity of 1,372 m/s (one half of the P-wave replacement velocity). The reflectivity is complex and cut by more disruptions than visible in the P-wave version of the profile. This is in part because the SH-wave data have higher visualization capability from the shorter wavelengths. Faults mapped on the P-wave section are usually expressed on the SH-wave section, although they are not as clearly defined. Noise contamination or aliasing from incompletely suppressed Love waves could create spurious offsets. The most pronounced offset on the SH-wave section corresponds to the fault zone on the southern half of Profile 1.
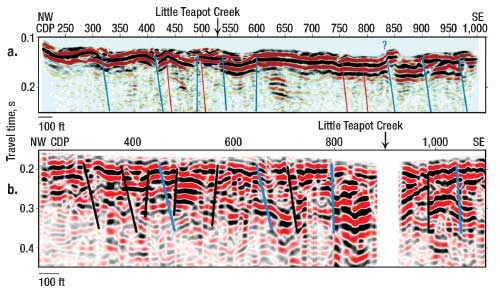
Profile 2. On P-wave Profile 2, reflectivity appears at 125 ms, corresponding to depth of 563 ft (171 m), Fig. 7a. At least four disruptions of the Shannon reflector, interpreted as normal faults, were observed, most of which can be mapped with a southeast dip in the plane of the section-assuming normal displacement, as interpreted from the well-log data-and have somewhat smaller offsets. Most of the faults mapped here are less well expressed and have significantly smaller offsets than the main fault observed on Profile 1. The wavy character of some of the events could be related to a poor static correction solution. Most of these locations match moderately well with locations derived independently from correlated well logs.
 |
|
Fig. 7. (a) Unmigrated P-wave reflection profile along Profile 2, showing somewhat more deformation compared to Profile 1. Red faults were mapped from well data. Blue faults were mapped only from the high-resolution P-wave seismic profile. (b) Unmigrated SH-wave seismic profile showing faulting along Profile 2. Blue faults correspond with those mapped on P-wave profile in Fig. 7a. Black faults are additional possible faults, but are not clearly observed on the P-wave profile.
|
|
SH-wave data were acquired only along about the first two-thirds of the P-wave Profile 2, Fig. 7b. Reflectivity arrives from about the same times as for Profile 1. As seen on the SH-wave Profile 1, this profile suggests a more intricate pattern of faulting than would be interpreted from the P-wave profile alone.
DISCUSSION
Faults within shallow reservoir strata cannot be imaged by conventional 3D seismic data, but are detected by high-resolution seismic methods. For decades, surface faults have been mapped in exposed Cretaceous strata surrounding Teapot Dome. Deeper faults are well imaged on the conventional seismic data, but the persistent question has been: Do they propagate upward to the shallow Upper Cretaceous formations? On arbitrary profiles extracted from the 3D seismic volume, chosen to match the position of the high-resolution profiles, faults offsetting high-quality Dakota and Frontier Formation reflectors were extended upward with as little deviation along the fault projection as possible.
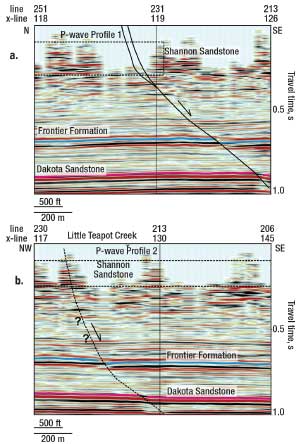
For Profile 1, the faults that were previously mapped to be within the S2 fault zone from the 3D volume, were extended upward through where there is a coherency loss in the seismic data (130-550 ms), Fig. 8a. One of the faults belonging to the S2 zone matches the most prominent fault mapped on Profile 1. This fault is also one of the largest faults as defined from the correlated well logs. One major fault defined from 3D volume may also project up to the Shannon on the northwestern end of Profile 2, although this fault was not independently mapped from well data and is drawn with less confidence, Fig. 8b.
 |
|
Fig. 8. (a) An arbitrary seismic profile through the 3D volume matching high-resolution P-wave Profile 1 and continuing to the southeast. A fault within the S2 fault zone can be drawn through the Frontier and Dakota horizons, and is projected up to the level of the Shannon interval. Loss of coherency in the data begins at about 550 ms. The fault line drawn to the level of the Shannon appears in the high-resolution P-wave profile (largest fault, Fig. 7a). (b) An arbitrary seismic profile through the 3D volume matching high-resolution P-wave seismic Profile 2. The fault, which is interpreted to correspond to the northwestern-most fault (Fig. 7b) crossed by Profile 2, is projected up to the level of the Shannon interval.
|
|
CONCLUSION
Combined geophysical and geological data provide the greatest visual detail of shallow reservoir faults and structure yet seen at Teapot Dome. Significant improvement in the resolution of the 2D seismic profiles could be obtained by using a higher-frequency source (e.g., explosives or guns), although this would increase the cost. We infer that several normal faults penetrate the Shannon Sandstone in the study area. On the basis of well and conventional seismic data, we may conclude that they are high-angle faults, which would be expected of faults with normal displacement, and that they have a northeast strike, approximately orthogonal to the hinge line of Teapot Dome.
Previous outcrop-based studies provide a context in which to interpret the results of mapping faults from the 2D seismic profiles. Cooper et al. observed a set of normal dip-slip faults that are perpendicular to the fold axial trace. These faults included both southeast and northwest dips, which is consistent with our observations. We thus infer that at least some of the faults observed in outcrop could penetrate deeper through Upper Cretaceous formations such as the shallow Shannon and even further into Paleozoic units.
Faults mapped from well data do not always exactly correspond to the locations from the high-resolution seismic data; however, the main S2 fault crossed by our profiles matches exactly. Apparent mismatches elsewhere may be explained by the fact that the wells used in the mapping of these faults are hundreds of feet or more apart from one another. The position and dip of faults mapped on the P-wave profiles match in a general way with faults that can be interpreted on the experimental SH-wave sections, although the SH-wave sections are of poorer quality. These sections nevertheless indicate more faults than are map-able from the P-wave sections. The SH-wave data show that faults penetrate into strata probably shallower than the Shannon and thus suggest potential leakage pathways near the ground surface.
 |
|
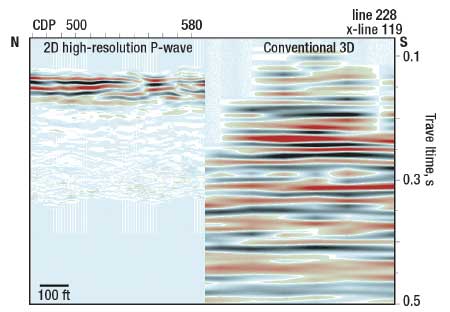
Fig. 9. Comparison of the resolution of 3D and high-resolution 2D seismic data at shallow intervals using a portion of the high-resolution P-wave Profile 1 and a contiguous portion of crossline 228 from the Teapot Dome 3D seismic volume shown at the same scale with identical data and replacement velocities.
|
|
Using a side-by-side comparison of the two seismic data sets shows how 3D coverage vanishes upward, and how only high-resolution profiles can be used to view the shallow Shannon reservoir, Fig. 9. Our observation of deeper faults being connected to faults cutting the Shannon is critical because previous fault models of Teapot Dome could not associate deeper faults with faults mapped from well data in shallow reservoirs. Although in our study area, only two of these faults show a large offset and an observable connection with deeper penetration into the 3D volume, we suspect shallow faults elsewhere could be associated with deeper faults. Thus, high-resolution seismic techniques potentially clarify both structural deformation and shallow reservoir partitioning. Knowledge of the location of shallow, small-offset faults, ordinarily considered “sub-seismic,” would be significant determinants in choosing formations for carbon sequestration or enhanced oil recovery projects. 
ACKNOWLEDMENTS
Partial support for this project was provided by the College of Physical and Mathematical Sciences, Brigham Young University. The authors gratefully acknowledge software grants from the Landmark (Halliburton) University Grant Program (GeoProbe, SeisWorks3D, and ProMAX2D) and from Seismic Micro-Technology (The Kingdom Suite). The authors also acknowledge subsurface data including the 3D seismic survey, and surface access for acquisition of the 2D high-resolution data provided by RMOTC and the US Department of Energy.
LITERATURE CITED
1 Brown, W. G., “Deformation style of Laramide uplifts in the Wyoming foreland,” in Schmidt, C. J. and W. J. Perry, eds., Memoir - Geologic Society of America Bulletin, 171, 1988, pp. 1-25.
2 Cooper, S. P., Goodwin, L. B. and J. C. Lorenz, “Fracture and fault patterns associated with basement-cored anticlines: The example of Teapot Dome, Wyoming,” American Association of Petroleum Geologists Bulletin, 90, No. 12, 2006, pp. 1903-1920.
3 Thom, W. T. and E. M. Speiker, “The significance of geologic conditions in Naval Petroleum Reserve No. 3, Wyoming,” US Geological Survey Professional Paper 163, 1931, pp. 1-64.
4 Doll, T. E., Luers, D. K., Strong, G. R., Schult, R. K., Sarathi, P. S., Olsen, D. K. and M. L. Hendricks, “An update of steam injection operations at Naval Petroleum Reserve No. 3, Teapot Dome Field, Wyoming: A shallow heterogeneous light oil reservoir,” SPE 30286 presented at International Heavy Oil Symposium, Calgary, Alberta, Canada, 1995, pp. 1-20.
5 Woolery, E. W., Street, R., Wang, Z. and J. B. Harris, “Near surface deformation in the New Madrid seismic zone as imaged by high-resolution SH-wave seismic methods,” Geophysical Research Letters, 20, 1993, pp. 1615-1618.
6 Black, B. J. and M. Milliken, “Understanding the complex geometry of extensional faulting in a compressional Laramide structure: Teapot Dome, Wyoming, abstract,” presented at Annual Meeting of the Rocky Mountain Section of the American Association of Petroleum Geologists, Snowbird, Utah, Oct. 7-9 2007, pp. 33-34.
7 Pugin, A. J. M., Larson, T. H., Sargent, S. L., McBride, J. H. and C. E. Bexfield, “Near-surface mapping using SH-wave and P-wave seismic land streamer data acquisition in Illinois, US,” The Leading Edge, 2004, pp. 677-682.
8 Steeples, D. W., and R. D. Miller, “Avoiding pitfalls in shallow seismic reflection surveys,” Geophysics, 63, No. 4, 1998, pp. 1213-1224.
|
THE AUTHORS
|
|
|
Anita Okojie-Ayoro has an MS degree in geology from Brigham Young University (BYU) and a BS in physics from Ambrose Alli University, Nigeria. She was actively involved in shallow subsurface seismic projects during her studies at BYU. She currently works as a seismic engineer for WesternGeco.
|
|
| |
John McBride is a professor at BYU. His research interests include tectonophysics, applications of geophysics to geologic hazard assessment and hydrogeology, and geoarchaeology.
|
|
| |
Tom Anderson is the chief scientist for the RMOTC in Casper, Wyoming. He has worked in the oil and gas industry since 1977. Tom has BS and MS degrees in geology from BYU. He is a member of the AAPG, a registered professional geologist in Wyoming, and a past president of the Wyoming Geological Association.
|
|
| |
Brian Black has over six years of experience as a petroleum geologist, including stratigraphy and sedimentology, fluid flow characterization, structural geology and technical computing. Brian has BS and MS degrees in geology from BYU with an emphasis on stratigraphy/sedimentology and reservoir characterization.
|
|
| |
Bill Keach is a visiting associate professor at Brigham Young University and a senior affiliate scientist at the Energy Geosciences Institute, University of Utah. Bill is on leave from Landmark/Halliburton, where he spent 14 years in a variety of positions. He earned his MS in geophysics from Cornell University and a BS in geology from BYU.
|
|
| |
John South is a geologist for Fronterra Geosciences with an emphasis on interpreting image logs for wells throughout the Rocky Mountains. He has a BS in geology from Adams State College, Colorado, and an APE from Snow College, Utah.
|
|
|


