The biomarker hopane, in a mud additive, overprints the hopane signature from oil shows, but other biomarkers remain unaffected.
S. E. Ohm and H. S. Beeley, ConocoPhillips Norge; D. A. Karlsen, K. Backer-Owe and J. H. Pedersen, University of Oslo, Norway
Oil-based mud additives are used frequently during drilling for various purposes. The chemical compositions of additives may overprint or interfere with the chemical composition of hydrocarbon shows in the well and, therefore, complicate geochemical interpretations. This is likely to be an increasing problem as discovering hydrocarbons becomes more difficult and subtle. Geochemists must compile a list of all additives used during drilling and also must obtain a sample of the pre-drill oil-based mud additives used during each project. Then, confirming the influence or possible contamination of additives on the discovered hydrocarbon is possible using detailed geochemical analyses performed post-drilling.
In this article, a frequently used, oil-based mud additive is shown to have overprinted the hopane signature of an oil-slick sample in Well 35/1-1 in the northern North Sea. However, the sterane biomarkers used for facies interpretation are shown to be unaffected by the mud additive, and an accurate age and facies determination was formed from the steranes.
This article also demonstrates that if one biomarker group from the mud additive overprints that of the indigenous oil show, other biomarker groups may still truly represent the oil show, and that supports conclusions from a previous paper.1
BACKGROUND
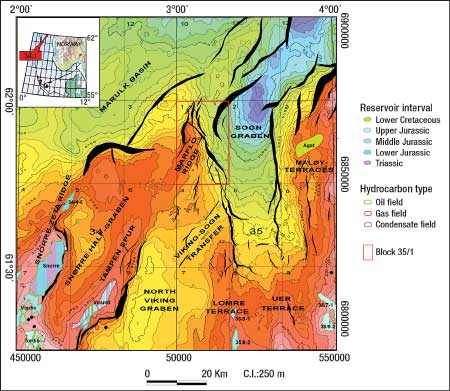
In a recent paper, Ohm et al.1 discussed the origin of hydrocarbons in Well 35/1-1, northern North Sea, Fig. 1. The presence of gammacerane and various hopane ratios suggested a Paleozoic source. Norway and Greenland are thought to have been less than 200 km apart prior to Mesozoic extension, comparable in dimensions to the North Sea graben system today,2,3 and the Upper Permian marine depositional basin between Greenland and Norway was shown to extend much further east than previously thought.4
 |
|
Fig. 1. Location map, Block 35/1, northern North Sea, with main structural elements and hydrocarbon discoveries. Courtesy of Petroleum Geoscience.21
|
|
A potential Permian source rock, if proven in Block 35/1, might imply that the Upper Permian basin also extends further south, as well as east. Seismic data showed deeply buried Paleozoic intervals that suggested a very mature signature. However, existence of a Permian source was not supported by maturity-influenced biomarker ratios as Ohm et al. observed various sterane ratios that suggested an atypical, Upper Jurassic oil source.
All samples, composed of extracts from SideWall Cores (SWC) and one oil slick sample, were contaminated by the Oil-Based Mud (OBM) mineral oil used during drilling. However, some SWC samples contained traces of a condensate (C4-10), and the oil slick sample contained traces of C4-10 and a heavy oil fraction (C25+). None of the biomarkers used for facies and maturity determination of the oil sample were, however, found in the OBM, and the biomarkers were therefore used to determine maturity and depositional environment of the oil’s source rock.
Ohm et al. reported that Versatrol, a proprietary mud additive made by M-I Drilling Fluids LLC was used during the drilling of Well 35/1-1, and that the chemical composition of the additive may have interfered with the oil slick sample composition and, therefore, the geochemical interpretation. At the time of the Ohm et al. publication, the authors had been unable to acquire a sample of Versatrol for analysis to verify the additive composition. The results of Versatrol analysis are presented in this article.
Three oil-based mud additives were used during drilling: proprietary Versamod, proprietary Versamul and Versatrol. Geochemical analyses showed that individual chemical components in the Versatrol sample interfered with, or overprinted, some of the biomarkers used for facies interpretation. The two other additives, Versamond and Versamul, did not introduce biomarker contaminants to the oil sample.
VERSATROL ADDITIVE
Versatrol additive consists of 100% gilsonite, which appears in uintaite, a solid bitumen mineral that occurs in the Uinta Basin, in Utah, Colorado, Canada and Mexico.5,6 Uintaite is composed primarily of nitrogen, sulphur and oxygen compounds and asphaltenes, with minor saturated and aromatic hydrocarbons.
In the Uinta Basin, gilsonite occurs as dikes with roots into the Eocene Green River Formation. The dikes range in thickness from millimeters to more than 5 m, and extend upward from roots in the Green River Formation into overlying formations, although some roots also extend downward. The roots are believed to form as hydraulic extension fractures caused by overpressure in oil shales of the Green River Formation.7 The distribution of gilsonite dikes appears to be related to net thickness of high-quality Green River oil.8 Gilsonite has been used since the mid-1950s in the drilling industry to solve borehole instability.
The Green River Formation consists of a suite of early Tertiary lacustrine sediments deposited in depressions bordering the Laramide Uplift.9,10 Several key biomarkers were identified first in the Green River Formation; among them is gammacerane,11 often interpreted as an indicator of hypersaline conditions.7-12 In the North Sea and the Norwegian Sea, gammacerane is present in several Paleozoic source rock extracts and oils,4,13 and is also described in an unusual, most likely Jurassic-derived oil from further south in the North Sea.14 The presence of gammacerane in Well 35/1-1 was an argument for the suggested atypical, Upper Jurassic depositional environment in the Marflo Ridge area of the northern North Sea.1
ANALYSIS
Samples of the oil-based mud additive used during drilling of Well 35/1-1 were made available and analysed, and a sample of gilsonite, collected in Utah, was also analyzed. In addition, analytical results that formed the basis of the paper by Ohm et al. were available.
A Fisons MD 800 Gas Chromatograph-Mass Spectrometer (GC-MS) with a Chrompack CP-SIL 5CB-MS column (50 m x 0.32-mm I D, 0.40 µm film thickness) was used for GC-MS analyses. The GC-MS was programmed from 80°C to 180°C at 10°C/min., then to 310°C at 1.7°C/min. with a final hold time of 30 min. Helium was used as the carrier gas. The instrument was operated in Selected Ion Mode (SIM). Ions with mass-to-charge (m/z) ratios equal to 178, 191, 192, 198, 217, 218, 231 and 253 were monitored.
RESULTS
Drilling mud additive samples, gilsonite samples and oil samples were analyzed for the biomarkers hopane and sterane to determine the relationship between the mud additive and gilsonite, and to determine any possible contamination of the oil samples by the mud additive.
Hopanes. The hopane distribution for ion m/z 191of the oil sample from Well 35/1-1, the mud additive and gilsonite are shown in Fig. 2. Color coding illustrates similar peaks in the fragmentograms and shows a clear similarity between the analyzed samples that confirms the close chemical relationship between the mud additive and gilsonite. The similarities between peaks also suggest that the hopane fingerprint of the oil sample is dominated by the hopane fingerprint of the mud additive. Initially the presence of gammacerane in the oil sample attracted the attention of Ohm et al. as the presence of gammacerane in the North Sea is often evidence of hypersaline, carbonate Paleozoic source rocks,4,14 for example Permian evaporitic sequences. However, gammacerane is also present in the mud additive and the gilsonite, thus not giving exclusive facies information of the oil sample source. Peak identifications of the m/z 191 ion chromatogram are shown in Table 1.
 |
|
Fig. 2. The triterpane m/z 191 mass fragmentogram of the 35/1-1 oil sample, the mud additive and the gilsonite. Result similarity suggests that the oil sample is contaminated and completely dominated by the mud additive.21 Color coding reflects similar peaks in the three fragmentograms. Peak identification is shown in Table 1.
|
|
| TABLE 1. Peak identification of mass to charge ratios 191, 217, 218 |
 |
|
Steranes. Figure 3 shows sterane distributions for ion m/z 217 of the oil sample, the mud additive and gilsonite. The sterane distribution of the oil sample is, as opposed to the hopane fraction, observed to be quite different from the sterane distribution of the analyzed mud additive and gilsonite. The close similarity between the mud additive and gilsonite sample ion chromatograms substantiates their chemical relationship.
 |
|
Fig. 3. The sterane m/z 217 mass fragmentogram (left) and the sterane m/z 218 mass fragmentogram (right) of the 35/1-1 oil sample, the mud additive and the gilsonite. The mud additive and the gilsonite samples of each mass to charge ratio appear to closely correspond, but the oil sample is different. Color coding reflects similar peaks in each of the m/z fragmentograms. Peak identification is shown in Table 1.
|
|
Figure 3 also shows the m/z 218 fingerprints of the oil sample, mud additive and gilsonite. As in the m/z 217 distribution, a close resemblance is observed between the additive and gilsonite, while the oil signature is distinctly different. Peak identifications of the m/z 218 ion chromatogram are shown in Table 1.
DISCUSSION
While providing the first evidence of the existence of an Upper Permian source rock near the mid-Norwegian Continental Shelf, Bugge et al. presented a new Paleozoic play model in the same area.4 Figure 4 shows hopane ratios from the oil sample of Well 35/1-1 as related to the Upper Permian Ravnefjeld Formation source rock samples. Initially, the ratios caused excitement because they may have indicated that the Upper Permian to Lower Triassic marine depositional basin, which extends further to the east than previously believed, could also extend further to the south.
 |
|
Fig. 4. The mud additive and gilsonite are shown to plot alongside the Well 35/1-1 oil, showing that the oil is not derived from the Ravnefjeld Formation, but is reflecting contamination from the mud additive. From Bugge et al.4
|
|
Plotting the mud additive and gilsonite samples alongside the 35/1-1 oil sample leads to the question of whether the oil sample biomarkers were only a mirror image of the mud-additive and, consequently, would not provide any information regarding oil maturity and facies. The hopane distribution did seem to be affected by the mud additive, but the steranes clearly show dissimilarities between the mud additive and the oil sample.
The plot of C28/C29 sterane ratio vs. time suggests that the oil sample is of Jurassic age and not Paleozoic, Fig. 5.1,15 If the sterane distribution of the mud additive overprinted the oil sample sterane distribution, then logically, a Jurassic age would be expected for the mud additive and gilsonite as well. The sterane distribution for the mud additive and the gilsonite instead suggests a Cretaceous to Tertiary age, which makes sense because gilsonite is mined from the lacustrine, Eocene-age Green River Formation. Hence, the additive sterane fraction does not overprint the oil sterane fraction and, therefore, could be a reliable facies indicator.
 |
|
Fig. 5. The mud additive and gilsonite-sterane ratios are distinctly different from the 35/1-1 oil sterane ratio. A Cretaceous/Tertiary age is suggested for the mud additive. Since gilsonite, a primary constituent of the mud additive, is mined from the Eocene-age Green River Formation of the Uinta Basin, the suggested Cretaceous/Tertiary age is reasonable. The sterane ratio difference between the mud additive and the 35/1-1 oil further suggests that the sterane content of the oil is non-contaminated and reflects properties of the oil. From Grantham and Wakefield.15
|
|
When plotting the gilsonite and mud additive in the diagram of Andrusevich et al.,16 the x-axis was extended toward the origin to include both the additive and gilsonite, Fig. 6. The extension of the x-axis suggests that the oil sample carries exclusive information regarding its origin that appears to be a carbonate source. The mud additive and the gilsonite are also distinguished from the oil sample by plotting the percentage of C27, C28 and C29 steranes from the m/z 218 ion-chromatogram in the ternary diagram of Shanmugam,17 Fig. 7. The oil sample is clearly different from normally developed Upper Jurassic oils.18 Figure 7 shows that the Versatrol and gilsonite samples were formed in a terrestrial to lacustrine depositional environment that corresponds well to the interpreted lacustrine environment of the Green River Formation where gilsonite is found and mined.
 |
|
Fig. 6. The mud additive and gilsonite samples plot toward the origin and are different from the Well 35/1-1 oil sample, again suggesting that the oil steranes are non-contaminated. From Andrusevich et al.16
|
|
 |
|
Fig. 7. The ternary diagram shows that the mud additive and gilsonite samples are different from the Well 35/1-1 oil sample. The mud additives plot in the terrestrial source rocks area, and are skewed towards the lacustrine part of the diagram, which corresponds with the Green River Formation gilsonite origin. The oil sample plots outside the area where most upper Jurassic-derived oils plot, suggesting the sample represents an atypical upper Jurassic source.21 Courtesy of Petroleum Geoscience.
|
|
One could possibly argue that the location of Well 35/1-1 in the Andrusevich and Shanmugam diagrams is a result of a siliciclastic-derived oil that is contaminated by the mud additive. However, the ion-chromatograms demonstate that the oil steranes are influenced very little by the steranes from the mud additive.
3D flexural backstripping was performed by Badley Geoscience Ltd. using techniques described by Roberts et al. combined with the layer-by-layer removal of stratigraphic sequences with sediment decompaction using the standard Sclater and Christie method and isostatic unloading.19,20 Backstripping showed that major footwall blocks, including the Marflo Ridge, were exposed subaerially during the Upper Jurassic in the Tampen Spur area.1 Figure 8 is a schematic representation of the interpreted depositional environment after structural backstripping. Shallow marine conditions favoring formation of algal mats and carbonates may have existed between islands. These islands may have produced terrestrial, organic runoff, and wave activity could have potentially brought oxygenated water to bottom sediments, thus deteriorating the conditions for conservation of organic material. This depositional environment fits the observed sterane biomarker data and supports an atypical, Upper Jurassic-developed source rock in the Marflo Ridge area.
 |
|
Fig. 8. Schematic of an Upper Jurassic depositional environment.1,21 Courtesy of Petroleum Geoscience.
|
|
CONCLUSIONS
As demonstrated, mud additives may influence geochemical interpretations, particularly in wells where only hydrocarbon shows are found. An influenced interpretation may lead to erroneous conclusions. Consequently, it is important that geochemists have access to lists of all oil-based mud additives used in drilling. Taking samples of the additives and retaining them until well results are known is also very important. The sampled mud additives can be disposed if they will not influence the composition of the discovered petroleum.
With minor hydrocarbon shows, however, it is more important to check for potential contamination by mud additives in the case that geochemical analyses are planned to be performed on the shows. An interesting observation from the study is that even if one biomarker fraction from the mud additive overprints biomarkers of the oil show, not all the other biomarker fractions necessarily overprint as well. This study has demonstrated that the hopanes of the oil show mirrored that of the mud additive, Versatrol, while the sterane fraction carried oil-specific information that was not affected by the mud additive biomarkers.
- The oil-based mud additive Versatrol is reported to influence geochemical analyses and interpretations by overprinting the indigenous hopane distribution of a minor oil show.
- Just because one biomarker fraction from the mud additive overprints the same biomarkers from the oil show does not preclude other biomarker fractions of the oil sample from being oil specific and usable in geochemical interpretations.
- Mud additive lists should be accessible and checked before geochemical data interpretation from wells with minor shows.
- The Permian source, suggested by the hopane distribution of oil in Well 35/1-1, is ruled out successfully, as the hopanes represent the drilling mud additive instead of indigenous soil hopanes. Therefore, this study supports conclusions made by Ohm et al. regarding the atypical Upper Jurassic depositional environment in Block 35/1, northern North Sea.

ACKNOWLEDMENT
The authors are grateful to Knut Pedersen at the drafting office at ConocoPhillips for all assistance, and to ConocoPhillips for permission to publish this article. This material was previously published in Petroleum Geoscience (Vol. 13, 2007), and they are gratefully acknowledged for permission to use the figures.
LITERATURE CITED
1 Ohm, S. E., Beeley, H., Karlsen, D. A., Hall, P. B. and A. Foss, “An atypical early mature oil in Block 35/1, Norwegian North Sea-hypersaline, carbonate Jurassic environment?” Petroleum Geoscience, 12, 2006, pp. 157-174.
2 Doré, A. G., “The structural foundation and evolution of Mesozoic seaways between Europe and the Arctic,” Palaeogeography, Palaeoclimatology, Palaeoecology, 87, 1991, pp. 441-492.
3 Mosar, M., Torsvik, T. H. and the BAT team, “Opening the Norwegian and Greenland Seas: Plate tectonics in mid-Norway since the Late Permian.,” in Eide, E. A. (coord.) BATLAS-Mid Norway plate reconstructionatlas with global and Atlantic perspectives, Geological Survey of Norway, Trondheim, 2002, pp. 48-62.
4 Bugge, T. et al., “Upper Permian as a new play model on the mid-Norwegian continental shelf: Investigated by shallow stratigraphic drilling,” American Association of Petroleum Geologists Bulletin, 86, 2002, pp. 107-127.
5 Curiale, J. A., “Origin of solid bitumens, with emphasis on biological marker results,” Organic Geochemistry, 10, 1986, pp. 559-580.
6 Davis, N. and K. Gilbreath, “The many facets of gilsonite,” American Association of Drilling Engineers, 02-DFWM-HO-38, 2002.
7 Peters, K. E., Clifford, C. W. and J. M. Moldowan, The biomarker guide, 1st Ed, Cambridge University Press, Cambridge, 2005.
8 Monson, B. and J. Parnell, J., “The origin of gilsonite vein deposits in the Uinta Basin, Utah,” in Fouch, T. D., Nuccio, V. F. and T. C. Chidsey, eds., Hydrocarbon and mineral resources of the Uinta Basin, Utah and Colorado, Utah Geological Association, Salt Lake City, Utah, 1992, pp. 257-270.
9 Roehler, H. W., “Correlation, composition, areal distribution, and thickness of Eocene stratigraphic units, Greater Green River Basin, Wyoming, Utah, and Colorado,” US Geological Survey Professional Paper 1506-E, US Geological Survey, Washington, DC, 1992.
10 Fouch, T. D. et al., “Green River (!) petroleum system, Uinta Basin, Utah, USA,” in Magoon, L. B. and W. G. Dow, eds., The Petroleum System-From Source to Trap, American Association of Petroleum Geologists, Tulsa, OK, USA, 1994, pp. 399-421.
11 Hills, I. R. et al., “An optically active triterpane, gammacerane in Green River, Colorado, oil shale bitumen,” Journal of Chemical Society, Chemical Communications, 20, 1966, pp. 752-754.
12 Dahl. J., Moldowan, J. M. and P. Sundararaman, “Relationship of biomarker distribution to depositional environment; Phosphoria Formation, Montana, USA,” Organic Geochemistry, 20, 1993, pp. 1001-1017.
13 Karlsen, D. A., interview by author, 2007.
14 Pedersen, J. H. et al., “The geochemistry of two unusual oils from the Norwegian North Sea: Implications for new source-rock and play scenario,” Petroleum Geoscience, 12, 2006, pp. 1-12.
15 Grantham, P. J. and L. L. Wakefield, “Variations in the sterane carbon number distributions of marine source rock derived crude oils through geologic time,” Organic Geochemistry, 12, 1988, pp. 61-73.
16 Andrusevich, V. E., Engel, M. H. and J. E. Zumberge, “Effects of paleolatitude on the stable carbon isotope composition of crude oils,” Geology, 28, 2000, pp. 847-850.
17 Shanmugam, G, “Significance of coniferous rain forests and related organic matter in generating commercial quantities of oil, Gippsland Basin, Australia,” American Association of Petroleum Geologists Bulletin, 69, 1985, pp. 1241-1254.
18 Karlsen, D. A. et al., “Petroleum migration, faults and overpressure. Part II. Case history: The Haltenbanken petroleum province, offshore Norway,” in Cubitt, J. M., England, W. A. and S. Larter, eds., Understanding petroleum reservoirs: Toward an integrated reservoir engineering and geochemical approach, Geological Society, London, 237, 2004, pp. 305-372.
19 Roberts, A. et al., “Mapping palaeostructure and palaeobathymetry along the Norwegian continental margin,” presented at the AAPG, NAPG Hedberg Research Conference, Stavanger, Norway, Sept. 8-11, 2002.
20 Sclater, J. G. and P. A. F. Christie, “Continental stretching; an explanation of the post-Mid Cretaceous subsidence of the central North Sea basin,” Journal of Geophysical Research, 85, 1980, pp. 3711-3739.
21 Ohm, S. E. et al., “A drilling mud additive influencing the geochemical interpretations of hydrocarbon shows,” Petroleum Geoscience, 13, No. 4, 2007, pp. 369-378.
|
THE AUTHORS
|
|
|
Sverre Ekrene Ohm received his MSc degree in marine quaternary geology from the University of Bergen in 1983. He has worked for the Norwegian
Petroleum Directorate and later for Elf Petroleum on geochemistry-related topics. In 1997, Ohm joined Phillips Petroleum, now ConocoPhillips, and his interests moved toward petroleum system analyses. In 2006, he received his PhD from the University of Oslo, where he is an Associate Professor II, and he spends his time there when he is not at Conoco- Phillips.
|
|
|
|
Hugh Beeley earned an honors degree in geology with chemistry, and an MSc in basin evolution and dynamics from London University. He joined
Phillips Petroleum in 1992 as an exploration geologist working in the Central Graben and West of Britain. He worked in Gulf Coast development, GOM deepwater and West Africa exploration. He was transferred to ConocoPhillips in Stavanger in 2002, where he works in HPHT exploration of the Norwegian Central Graben.
|
|
|
|
Dag A. Karlsen is associate professor in petroleum system analysis at the Department of Geosciences, University of Oslo, and specializes in the use of oil and gas to delineate and trace out basin-scale migration patterns of petroleum for use in exploration since 1990. Karlsen has conducted research with Norwegian shelf oil companies, supervised 27 Cand. Scient students, master students and five PhD students.
|
|
| |
Kristian Backer-Owe manages the Organic Geochemistry Laboratory at the Department of Geosciences, University of Oslo. For the past 17 years, he has worked on organic geochemistry applied to petroleum exploration. He holds a BSc degree in biochemistry and an MSc degree in geology from the University of Oslo.
|
|
| |
Jon H. Pedersen earned his PhD in petroleum geology from the University of Oslo, Norway, in 2006. He currently works as a petroleum system analyst in the international global exploration division of StatoilHydro.
|
|
|


