Since you can’t see them, what do you use to find them? This part of this long- running series describes the use of logging tools to locate underground blowouts.
Neal Adams, Neal Adams Services, Houston
In the most basic terms, our impulse is to use our sensory perception to identify a surface blowout. Do you see a fire, the flow, equipment leak, smoke, pollution or damage? Sometimes we can hear, smell, and even feel the blowout. But in the case of an UnderGround BlowOut (UGBO), sensory perception cannot be used to identify it, unless it evolves into a surface event. Even after 35 years of worldwide well-control experience, my ability to see underground is not any better than yours.
Different assessment methods must be used. These include surface pressure evaluations, logging techniques and a thorough understanding of the well’s history and geology. Perhaps you just said to yourself, “Yeah, but anyone can read a temperature log.” Hopefully, you’ll reserve your opinion on that until you read this article.
DIAGNOSTIC PRESSURE ANALYSIS
In the most basic terms, our impulse is to use our sensory perception to identify a surface blowout. Do you see a fire, the flow, equipment leak, smoke, pollution or damage? Sometimes we can hear, smell, and even feel the blowout. But in the case of an UnderGround BlowOut (UGBO), sensory perception cannot be used to identify it, unless it evolves into a surface event. Even after 35 years of worldwide well-control experience, my ability to see underground is not any better than yours.
Different assessment methods must be used. These include surface pressure evaluations, logging techniques and a thorough understanding of the well’s history and geology. Perhaps you just said to yourself, “Yeah, but anyone can read a temperature log.” Hopefully, you’ll reserve your opinion on that until you read this article.
Let’s develop a basis of understanding using Example 1.
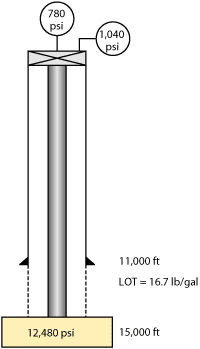
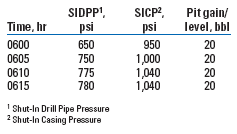
Example 1. While drilling at 15,000 ft on the well shown in Fig. 1, the driller observed several primary warning signs of kicks and proceeded to shut in the well. After the shut-in was completed, he called the company man and started to record pressures and pit gains, Table 1.
 |
|
Fig. 1. The 15,000-ft well for Example 1, with 12,480 psi and pipe set at 11,000 ft.
|
|
| TABLE 1. Shut-in data for Example 1 |
 |
|
The final recorded shut-in pressures and pit gain after 15 min. were SIDPP of 780 psi, SICP of 1,040 psi and a 20-bbl pit gain. The pit gain is routinely recorded, and should be a constant value after shut-in, to verify that all systems are closed and leaks don’t exist.
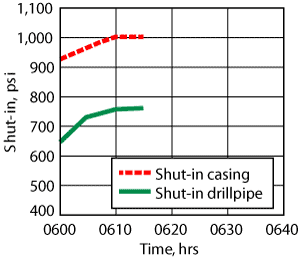
Upon closure of the BOP system, flow out of the top of the well is stopped. Flow from the kicking zone into the wellbore continues until equilibrium is reached between the wellbore and formation pressure. Table 1 shows this effect over the time interval of 0600-0615 hr. The surface manifestation of the equilibrium process is rising drill pipe (SIDPP) and casing pressures (SICP). When surface pressures become static, we interpret that to mean wellbore-formation equilibrium has been reached, Fig. 2.
 |
|
Fig. 2. When surface readings of casing and drill pipe pressure level off, we believe the wellbore and formation are in equilibrium.
|
|
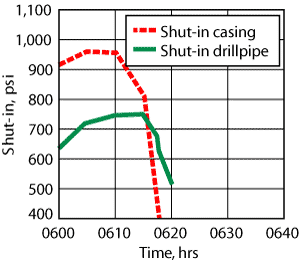
UGBOs disrupt this process. When increasing wellbore pressure exceeds formation integrity, a fracture is formed that breaks the closed hydraulic circuitry. The typical scenario will be increasing surface pressures after shut-in, accompanied by a sudden pressure reduction.
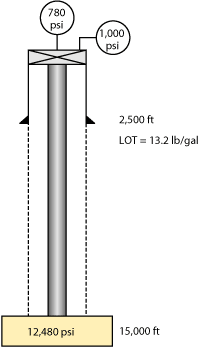
Consider Example 1a, which is the same as Example 1, but this time with a well architecture where intermediate casing is not set and the surface casing is set at 2,500 ft. Fig. 3.
 |
|
Fig. 3. Example 1a-the same well under a different scenario.
|
|
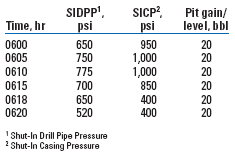
The shallower casing seat provides less resistance to fracture. Again, the driller takes a kick from 15,000 ft, closes the BOPs and observes the pressures shown in Table 2 and Fig. 4. From this example, the fracture point occurs at 1,000 psi SICP.
 |
|
Fig. 4. Example 1a over time. Data in Table 2.
|
|
| TABLE 2. Data for Example 1a. |
 |
|
This manifestation may not be observed if a thief zone previously existed in the wellbore or if the influx causes hole bridging prior to reaching pressure equilibrium. For an effective pressure diagnostic effort, the well should be closed in quickly and pressures recorded frequently from the initial well closure. A good industry practice is to record all initial shut-in pressures and subsequent pressures on the daily reports. Too often, a post-mortem UGBO analysis is frail, because shut-in pressures were not recorded frequently.
Consider the equivalent mud weights caused by the kick shut-in conditions for Figs. 2 and 4. Use the well schematics and the data from Tables 1 and 2 to calculate the equivalent mud weights at each respective casing seat. The estimated rock fracture strengths using the Eaton method with normal formation pressures to 11,300 ft are given below.
From a prior installment in this series (World Oil, January 2004), recall that the equivalent mud weights caused by a kick are calculated to get a rough first estimate:

where:
 = equivalent kick mud weight at casing seat, lb/gal = equivalent kick mud weight at casing seat, lb/gal
 = formation fracture strength at casing seat, equivalent, lb/gal = formation fracture strength at casing seat, equivalent, lb/gal
Pd-scv = pressure at vertical depth of casing seat, psi
dsc-v = vertical surface casing depth, ft
0.052 = conversion constant, psi/ft/lb/gal
 = mud weight, lb/gal = mud weight, lb/gal
Substituting for Example 1:

and recalling that the re-fr is 16.7 lb/gal in this case,
16.7 lb/gal > 12.6 lb/gal.
The  is 12.6 lb/gal with the deep casing set at 11,000 ft. Eaton’s method shows the estimated rock strength to be 16.7 lb/gal. Since the kick stress of 12.6 lb/gal at 11,000 ft is less than the estimated rock strength of 16.7 ppg, the kick should not cause a UGBO at shut-in conditions. This point is important because the maximum downhole kick stresses usually occur at shut-in conditions. This leads to the important conclusion that a successful kick killing operation is possible if the well is shut-in without sustaining a UGBO incident. If improper kick-handling techniques are used, a UGBO may occur depending on the degree and type of mishandling, i.e., allowing a continuous feed-in at the flow source if the required casing pressure is not maintained. is 12.6 lb/gal with the deep casing set at 11,000 ft. Eaton’s method shows the estimated rock strength to be 16.7 lb/gal. Since the kick stress of 12.6 lb/gal at 11,000 ft is less than the estimated rock strength of 16.7 ppg, the kick should not cause a UGBO at shut-in conditions. This point is important because the maximum downhole kick stresses usually occur at shut-in conditions. This leads to the important conclusion that a successful kick killing operation is possible if the well is shut-in without sustaining a UGBO incident. If improper kick-handling techniques are used, a UGBO may occur depending on the degree and type of mishandling, i.e., allowing a continuous feed-in at the flow source if the required casing pressure is not maintained.
For Example 1a, with the casing seat at 2,500 ft:

13.2 lb/gal < 16.7 lb/gal.
The case with pipe set at 2,500 ft shows opposite results compared with the case where the pipe is set at 11,000 ft. The kick stress of 16.7 lb/gal at 2,500 ft easily exceeds the rock strength of 13.2 lb/gal. A UGBO will be initiated if the well is properly shut in. Some operators will implement the Maximum Allowable Casing Pressure (MACP) method at this point. The MACP is plagued with its own set of problems and is seldom reliable in most cases.
Fluctuating casing pressures usually indicate a UGBO. Downhole flow and formation fracture parameters are dynamic if the flow continues. They seldom follow a consistent or predictable pattern. Note that the initial surface pressure (SICP) increases of 950 psi to 1,040 psi in Table 1 are normal and do not constitute a fluctuating phenomenon.
Lastly, common kick scenarios where UGBOs are not involved usually result in a higher SICP than SIDPP, or
SICP > SIDPP.
The annulus is typically contaminated with foreign influxes that require more surface pressure to establish equilibrium. Assuming the well was quickly shut in, the drill pipe should be uncontaminated.
Reversing the relative levels for SIDPP and SICP,
SIDPP > SICP
should be interpreted as an indicator of an abnormal occurrence. A UGBO is the common, but not the sole, cause for this irregularity. Further analysis may be required.
A diagnostic pressure analysis at shut-in conditions allows a quick-look interpretation of downhole conditions that cannot be provided from other sources. After shut-in has occurred and the initial analysis has been completed, alternate means must be used to continue monitoring the changing downhole conditions. Most common techniques involve wireline logging tools and include temperature and noise surveys.
TEMPERATURE LOGS
Subsequent to the diagnostic pressure analysis at initial shut-in, perhaps the most widely used wireline UGBO identification method is the temperature log. Analysis is quick and effective in some cases but can lead to confusion in others. Factors to be considered include:
1. Flowrate and fluid type
2. Hole and pipe geometry
3. Rock flow properties in the flowing and receiving zones
4. Annular conditions
5. Prior circulation conditions including rate and fluid type
6. Ambient and geothermal gradients.
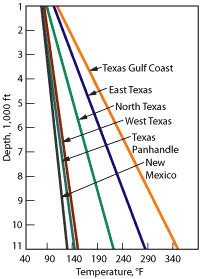
Consider Fig. 5. Formation fluid temperatures increase with depth. Vertical fluid movement between intervals should create a temperature anomaly that can be measured with a temperature log.
 |
|
Fig. 5. Normal formation temperatures for various geographical regions.
|
|
The term temperature log is normally associated with a continuously run log measuring temperatures at the tool face. A presentation format that eases interpretation is the differential temperature, ΔT/ΔZ, which is normally calculated over a short interval, e.g., 10-20 ft. The differential temperature curve should approximate a vertical line, assuming a constant geothermal gradient and static fluid conditions. An aberration in the vertical line signals a downhole anomaly deserving of more study.
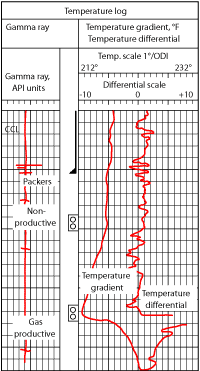
In a perfect world, the starting point for using temperature logs is to establish anticipated formation temperatures as a base to compare with the temperature log run at the time of the UGBO, Fig. 6. We know that temperatures increase with well depth, where the rate may depend on formation type, thermal conductivity, porosity, pore fluids and geographical region. Anticipated temperatures with depth are often assumed to follow this equation:
where:
Tz = temperature at depth z
Ts = surface temperature
Gt = temperature gradient
Z = depth.
 |
|
Fig. 6. Typical temperature log.
|
|
A typical range for temperature gradients is 0.5 to 2°F/100 ft, Fig. 5.
Although we commonly assume a single temperature gradient for an area, some scenarios don’t follow this trend. Examples are drilling near a salt dome where the thermal conductivity of salt may be different from that of the rock formation, or drilling in an area where geothermal rock sources outcrop near the surface.
Also, consider the case of a waterflood project. Temperature in and adjacent to the zone of interest are usually cooler than the norm. If the waterflood zone is also the receiving zone for the UGBO, temperature analysis becomes difficult.
After an anticipated temperature behavior is established, our log results can be analyzed. First, take a broad overview of the log and identify any obvious anomalies. Look at the line-tension plot on the log to determine if the logging tool’s movement was at a constant rate or if a sticking tool may have resulted in the anomaly. Check for unanticipated results such as the case of a temperature anomaly in a cased hole section.
Figure 6 provides a good example for explanatory purposes. A 95/8-in. casing string is set to 9,510 ft with a production liner run to 9,900 ft (not shown on the log). The liner hanger and a production packer are set at about 9,480-9,490 ft. The casing and liner collars are shown in the left track of the log with the Casing Collar Locator (CCL). The gamma ray is not shown. The well was perforated at 9,540-9,550 ft and also at 9,605-9,615 ft. The upper perforations were non-productive. Produced gas is coming from the lower set of perforations.
The right side of the log shows two temperature curves. The left curve is the absolute temperature, and the differential temperature curve is shown on the right. Both can provide valuable information in some cases. Consider the absolute curve at 9,660 ft. It reads 222°F. Gas expansion in the rock strata from 9,660 ft to the perforations at 9,605-9,615 ft creates a cooling effect that lowers the absolute temperature to 212.5°F. After gas has entered the well tubulars, the magnitude of the expansion-cooling effect is reduced exponentially, which allows the absolute temperature to increase toward a normal formation temperature. The temperature has increased to 218°F at 9,450 ft.
The differential curve, shown on the right, clearly demonstrates a greater sensitivity and allows additional data to be extracted. The general differential trend of 0°F at 9,660 ft increases to an off-scale reading at 9,620 ft. This results from the expansion-cooling effect.
Note the trend at 9,650 ft and again at 9,625-9,630 ft. Some type of formation feature retards the expansion and the cooling rates. A horizontal permeability barrier might create this aberration. Available data doesn’t allow us to formulate other possible explanations; however, the anomalies signal the need for further investigation.
Vertical gas movement through the downhole completion assembly results in ± 2-3°F differential temperature changes. A good example occurs at 9,480-9,500 ft, where the gas travels through a packer and several external casing string changes.
The next step is to place the temperature logging results in the context of well operations. Was the log run immediately after fluid circulation, or had the wellbore been static for some time? Fluid pumping creates a cooling effect on the wellbore and can mask temperature anomalies. Prior pump rates and volumes should be identified. Note that oil-based muds have a different effect than a water-based muds.
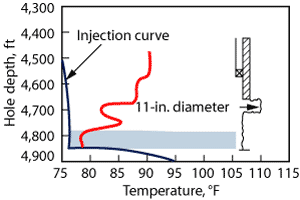
The wellbore-drillstring geometry should be evaluated. Figure 7 shows temperature behavior of a logged well with a washout. Changes occur at the casing shoe-to-open hole enlargement and also at the hole washout from 4,650 to 4,700 ft.
 |
|
Fig. 7. Temperature effect from an openhole washout.
|
|
The temperature log is often run in conjunction with other analytical tools. If multiple runs are made, the log may show results that are “smeared” and small, but important details may be lost. The most meaningful results occur with the initial, down logging run.
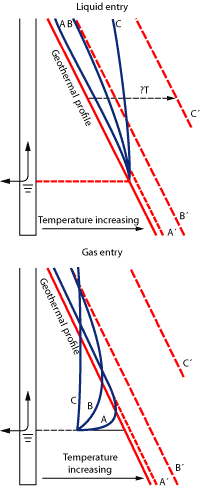
Figure 8 shows possible temperature profiles for a liquid or gas entering the wellbore from a reservoir. For the moment, assume that reservoir pressure is above the liquid’s bubble point so solution gas remains in the liquid and does not form a separate phase. Profiles A, B and C result from varying liquid entry rates. Profile C occurs at high entry rates.
 |
|
Fig. 8. Temperature effects for liquid (top) and gas (bottom) entry for three different entry flowrates.
|
|
Each profile, A, B or C, asymptotically approaches a line A´, B´ or C´. These lines are roughly parallel to the geothermal gradient but exceed it by some amount, ΔT. Large ΔTs suggest a high flowrate entry into the wellbore. The value ΔT can be approximated as:

where:
b = coefficient, a function of fluid type and thermal conductivity
G = geothermal gradient
M = mass flowrate
Although the equation might suggest that quantitative analysis of flowrates may be possible, the reality is that too many variables and unknowns usually prevent a reliable application of the equation.
UGBO gas flows into the wellbore create a convoluted analysis picture in Fig. 8. As gas enters the wellbore and moves upward, geometry and pressures may allow some gas expansion to occur. Associated with the expansion is a cooling effect. The gas has a reservoir temperature that exceeds temperatures in shallower zones, so the flowing temperature should be greater than the formation gradient. However, the potential cooling effects from gas expansion prevent reliable evaluation.
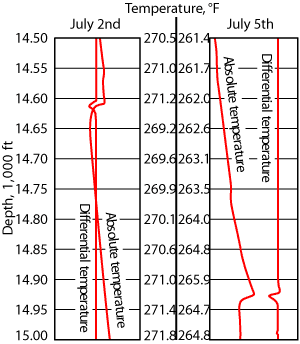
Figure 9 shows a temperature anomaly from two runs on a UGBO well at various times, July 2 and July 5. The trend over this time frame shows wellbore cooling. This coincides with prior wellbore bridging near the bit. However, the anomaly at 14,950 ft can be easily explained if the deeper bridging stopped the UGBO flow, which originally occurred from a kick while drilling on bottom. The anomaly’s shape suggests a deep-to-shallow flow. However, this analysis is incorrect because the temperature at 14,450 ft is greater than the formation temperature at 14,650 ft, which is below the hypothesized entry point. To further confuse the interpretation, the anomaly doesn’t occur near any changes in drillstring geometry.
 |
|
Fig. 9. Gas flow and temperature results in a well.
|
|
It is fair to characterize the temperature log as an effective UGBO descriptive tool. However, we often find that quick-look interpretations without a follow-up comprehensive evaluation can lead an operator to select forward options that achieve less than anticipated results. A comprehensive analysis of temperature logs in complex environments can easily require 10-20 hours or more.
NOISE LOGS
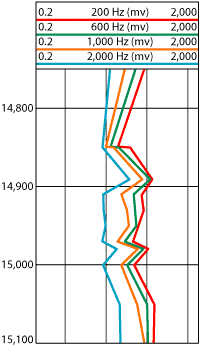
Noise logs are often run after, or with, the temperature log as an additional UGBO identifier. It can provide reliable guidance if the environmental conditions are conducive. In simple terms, a noise log is a sensitive microphone that can detect sounds created by fluid movement. The log can differentiate among gas, liquid and two-phase flow because each generates unique sound signatures. Data is captured in the ranges of 200-2,000 Hz. A sample noise log section is shown in Fig. 10. It was run on the example well used in Fig. 9.
 |
|
Fig. 10. Noise log showing sound levels at various frequencies.
|
|
The tool must be stationary to take readings, because sounds generated from tool and wireline movement far exceed any UGBO fluid movement noises. Several minutes are required at each station to capture the data.
The most efficient scheme for UGBO identification is to get a first estimate of the flow source’s location and then bracket the suspected flow source with the stationary readings from the noise log. The temperature log or knowledge of the well’s history usually provides reliable first estimates for selecting depth stations for the noise log. It is impractical to run the noise log over the openhole (or cased-hole) interval without some knowledge of the problem zone’s location.
Noise logs are used predominantly during production operations for tracking undesirable fluid movements such as behind-pipe flow or assessing flow performance from individual perforations. The logging environment usually involves a stand-alone production tree, logging truck and a hoisting device such as a gin pole truck for raising and stabilizing the lubricator. This environment is conducive for noise logging, as it minimizes background noises that could mask sounds from downhole fluid movement. Likewise, noise logging from a drilling rig is often inconclusive due to background noises from pumps, engines and other normal rig activities.
ANNULAR WATER FLOW LOG
The primary application of the annular water flow log is in production operations to identify and quantify water flow behind casing. When direct access to the injection flow profile is available for water injection wells, fluid velocity and volume are most commonly determined using a standard flowmeter.
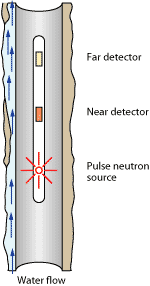
Arnold and Paap first proposed in 1977 the use of oxygen activation logging for detecting water movement behind casing. As the process developed, two commercial methods emerged in the 1980s that allowed measurement of water velocity based on oxygen activation logging. Stationary measurements at selected depths were required for both methods, Fig. 11.
 |
|
Fig. 11. Schematic of annular water flow logging tool.
|
|
The steady state method is based on the exponential decay of induced gamma ray activity as the neutron source is pulsed continuously. Gamma ray counts are measured using two detectors at known separation distances. Water velocity is estimated on the measured count rates and evaluated using the characteristic exponential decay rate. The impulse activation method uses 2- to 10-sec. pulsations to activate the water. A detector downstream counts the rates and estimates water volumes using the same principles in the steady state method.
SPINNER SURVEY
As a frequently used production tool to identify and quantify downhole flow volumes and rates, the spinner survey has limited applications in flow detection and characterization for UGBOs. The spinner tool must be in the flow stream to detect fluid movement, and it must be positioned in a tubular of a known diameter if volumes are to be calculated.
RADIOACTIVE TRACER
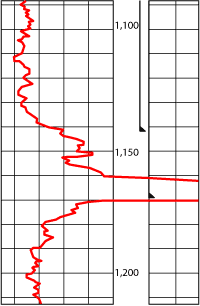
One of the oldest flow identification techniques is the radioactive tracer. Usage is small, primarily due to other, more effective techniques and the increased restrictions placed on usage of radioactive materials. Its application principle is simple. A small amount of a radioactive source liquid, such as Iodine 131, is placed in the well, usually at the suspected loss zone. This material has a half-life of 8.1 days and is soluble in water. After pulling the drillstring, or other conveyance method, a radiation monitoring log is run as drilling fluids are pumped slowly. The objective is to track the flow direction of the radioactive fluids to determine source and exit points, allowing development of solutions to the flow problem, Fig. 12.
 |
|
Fig. 12. Typical gamma ray log showing response to radioactive mud, “chased” to a casing exit point.
|
|
Obviously, rig crew handling of the source material with the mud system posed serious safety hazards, as well as regulatory concerns. Further, the source material was often diluted in the mud system and pumped to various parts of the annulus and elsewhere, which made interpretation unreliable.
FINAL NOTE
Mathematical models of the logging techniques discussed here can be, and have been, developed by various researchers to predict many physical properties resulting from flow. If available for the field, these models could help evaluate downhole conditions and predict future events, as well as assist in evaluation of kill options and selection of the optimum approach. Unfortunately, the timeliness of the event usually precludes running the models, since the model is not available for rig site applications, and the required input data for the model would take time to compute for the actual wellbore. 
BIBLIOGRAPHY
Arnold, D.M., and H.E. Peelman, “Behind casing water flow detection using continuous oxygen activation,” U.S. Patent No. 4,032,780, June 28, 1977.
Arnold, D.M. and H.J. Paap, “Quantitative monitoring of water flow behind and in wellbore casing,” Journal of Petroleum Technology, January, 1979.
Chance, D.M., Trcka, D.E. and B.A. Dawe, “Application and interpretation to continuous activation logs for measuring complex water flow profiles in injection wells,” SPE 28412 presented at the 69th Annual Technical Conference and Exhibition, New Orleans, Louisiana, September 1994.
Trcka, D.E. and D.M. Chace, “Improved method for measuring annular water flow in injection wells using continuous oxygen activation logging,” SPE 26450 presented at the 68th Annual Technical Conference and Exhibition, Houston, October 1993.
|
THE AUTHOR
|
|
|
Neal Adams has over 30 years of oil industry experience as a firefighter, blowout control specialist, engineer and consultant. He earned a BA (honors) from Northeast Louisiana University in 1971, and an MS in petroleum engineering from the University of Houston. Adams has traveled to and worked in 35 countries, and was instrumental in extinguishing fires in the 1991 war with Iraq. Adams is President of Neal Adams Services, Houston (www.NealAdamsServices.com).
|
|


