Seismic data alone shows high P-wave values for gas hydrates and concretions,creating a need for other tests to characterize anomalies in the ocean floor
N. Sultan, M. Voisset, T. Marrset and A. M. Vernant, IFREMER; E. Cauquil, J. L. Colliat and V. Curinier, Total
This article presents a new method to characterize free gas, gas hydrate and carbonate concretion occurrence, which are considered high-risk factors for subsea developments. This method is based on the combination of 3D seismic data and geotechnical site characterizations using piezocone Cone Penetration Tests (CPT). The calibration of P-wave velocity anomalies was completed using in situ geotechnical testing carried out during two oceanographic surveys in 2003 and 2004.
Comparisons between in situ testing using the piezocone, recovered cores, and predicted gas and gas hydrate distribution based on compressional wave velocity have shown that 3D seismic data is a valuable tool in identifying heterogeneous areas, but using in situ CPT testing is essential to discriminate between gas hydrates and carbonate concretions. Furthermore, in situ compressional wave velocity (Vp) measurements have clearly demonstrated the co-existence of gas hydrate and free gas in the study area that was only previously suspected from seismic data.
The continental slope off Nigeria is one area where gas hydrate occurrence near the seafloor has been detected previously, as discussed by several authors.1,2 Gas hydrate accumulation is of interest to industrial development, because hydrates are formed near the seafloor and could become a major risk to any future oil development. Changes in bottom water temperature and/or pressure generated by human activity on the seafloor (drilling, laying pipelines) can destabilize hydrate layers, and potentially result in large landslides and soil failures. Gas hydrates may also be the origin of gas release within the sediment layer that can generate a dramatic modification of the engineering response of the soil. Free gas may increase sediment compressibility, modify shear strength of the soil and reduce intrinsic permeability.3,4 Thus, detection of free gas and gas hydrates is required for safe underwater development.
This work was performed within the framework of a joint research project, Nigeria: Evaluation des RISques (NERIS), between Ifremer and Total. The main aim of this project was to define a protocol to characterize gas- and gas-hydrate-charged sediment corresponding to high-risk areas, or geohazards, by using 3D seismic data and in situ geotechnical site investigation.
GEOLOGICAL SETTING
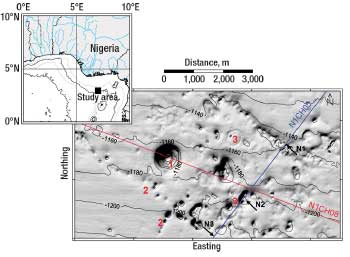
The study area is located in the Gulf of Guinea on the west coast of central Africa, south of Nigeria and seaward of the modern Niger Delta, Fig. 1. The continental margin off the Niger Delta is undergoing deformation by gravity-driven tectonics, initiated in response to rapid seaward progradation and sediment loading in the successive depocentres.
 |
|
Fig. 1. (top left) Location and (bottom right) shaded bathymetry of the study area showing a giant pockmark, small scale circular depressions and atypical irregular structures on the seafloor. Seismic lines N1CH05 and N1CH08 are displayed and respectively.
|
|
Various studies of the Nigerian continental slope have shown different seafloor sedimentary features such as pockmarks, gas hydrates, slides, mud volcanoes and carbonate build-ups associated with fluid flow.1-8 Heggland observed gas chimneys above hydrocarbon charged reservoir that result from hydrocarbon migration along fault planes between source rocks of reservoirs and the seabed.9
The study area is within the translational zone, and lies at water depths ranging from about 1,100-1,250 m. The area is characterised by numerous circular to sub-circular features that are a few meters to 700 m in diameter, and by numerous oblong patches.10 Most of these features are located within a NW-SE trend area bounded by two lineaments, Fig. 1.
The seafloor displays various shapes, most notably, a large-scale circular depression about 110 m deep and 700 m in diameter appearing as a giant pockmark, and small-scale circular depressions. Distribution of pockmarks seems related to distribution of gas/fluid migration paths caused by pre-existing vertical weakness zones (i.e., fault planes) within shallow sediments. Numerous small-scale pockmarks align along an underlying southern major fault plane, suggesting the presence of a migration pathway along this fault up to the seafloor, Fig. 1.
METHODS AND TOOLS
The high-quality seismic data available for the study area, processed using DeltaStack3D, allowed determination of interval velocity.11,12 DeltaStack3D is an automatic, 3D high-density velocity-picking tool developed by Total.
In this case, because processing of seismic data is adapted to the shallow target, quality of data is optimal in the first 500 ms-(TWT) window below the sea bottom. Results were stable and had a good signal-to-noise ratio, with seismic bandwidth at sea bottom at about 70 Hz, leading to a minimum time between two consecutive velocity analyses of 14 m/s. If we consider an average velocity of 1,600 m/s, the resulting resolution is about 11 m. There is a satisfying alignment of detection (i.e., the times when velocity analysis is made) with the seismic markers, which leads to a spatially coherent velocity field.
In situ measurements. In situ geotechnical measurements were performed using the Ifremer piezocone CPT during the NERIS2 oceanographic survey. This seabed piezocone can perform in situ geotechnical measurements in deep water (up to 6,000-m water depth) with a maximum depth of investigation of 30 m below the sea bottom. A combination of two special cones, the classic CPT cone and sonic cone, was used in the investigation, Fig. 2.
 |
|
Fig. 2. Scheme of the piezocone CPT (a) and Sonic CPT (b)
|
|
The CPT cone includes three modules: a lower module with geotechnical sensors; a module including a source of Cs 137 of weak energy for measurement of unit weight; and a third module with two inclinometers placed in two perpendicular planes and a thermometer. More details concerning the CPT piezocone are presented in Meunier et al.13
In the cone penetration test, a cone on the end of coiled tubing is pushed into soil layers at a constant rate, Fig. 2a. The electric cone used during the NERIS2 cruise gave continuous measurements of the tip resistance (qc), sleeve friction (fs) and excess pore pressure (∆u2) measured by a porous filter located immediately behind the cone. From CPT parameters qc and ∆u2, the corrected cone resistance qt can be derived according to the following equations:
where  is the effective cone section ratio and uh is the hydrostatic pore pressure. is the effective cone section ratio and uh is the hydrostatic pore pressure.
The net cone resistance qnet is given by the following equation:

where is the vertical total stress at the cone base. is the vertical total stress at the cone base.
The sonic cone penetration test is a technology improvement to the standard cone penetrometer. The end of the coiled tubing holds two tips where the first tip contains a high-frequency compression wave source (1 MHz) and the second tip the receiver, Fig. 2b. Distance between receiver and source is 0.07 m. The compression wave is made over 1,000 measurements to increase the accuracy of the measurement. As with the classic penetrometer, the sonic CPT is pushed into the sediment layers at a constant rate, and takes continuous measurements of P-wave velocity and attenuation. A total of 21 CPT and sonic measurements were taken in the study area.
Laboratory testing. An experimental program on undisturbed marine sediments from core N2-KSF43 was performed to identify the key parameters needed to express P-wave velocity anomalies in terms of gas and gas hydrate concentration. The detailed laboratory geotechnical investigation included classification tests, consolidation/permeability tests and strength tests. Testing of samples was performed to identify soil type, shear strengths and compressibility characteristics of the soil. Tests were also performed to identify acoustic properties of the sediment that involved measuring P- and S-waves while changes in capillary pressure were applied.
RESULTS
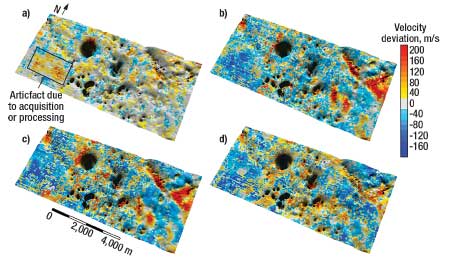
The data-processing software was applied to derive the interval velocity over the upper 10 reflectors. Figure 3 illustrates the projection on the seafloor of the velocity deviation from the reflector mean value for the first upper four reflectors. The first reflector represents the upper 15 mbsf (m below the seafloor), and the second, third and fourth reflectors characterize, respectively, the sediment at around 40 mbsf, 60 mbsf and 80 mbsf, Figs. 3a-d. The velocity deviation increases at the second and third reflectors, indicating higher activity. In this work, only the P-wave velocities from the first reflector are studied, since it can be calibrated by CPT measurements and piston coring.
 |
|
Fig. 3. Velocity deviations from the reflector, mean value for the first upper four reflectors. First reflector-upper 15 mbsf (a), second-40 mbsf (b), third-60 mbsf (c) and fourth-80 mbsf (d).
|
|
CPT testing. During the NERIS1 cruise, several recovered gravity cores showed gas hydrate in some areas and carbonate concretions in others. By comparing the cores in terms of gas hydrate and carbonate concretions, it was clear that seismic data gave high-P-wave velocities for both gas hydrate and carbonate concretions.
Several sites were chosen for in situ measurements to delineate the map of velocity anomalies. Three CPTs were completed in the gas hydrate areas (PM27-A, PM33-B and PM33-C) and six CPTs were completed in the carbonate concretion areas (PM22-A, PM22-B, PM22-C, PM23-A, PM23-B and PM23-Bbis), Fig. 4. All CPTs performed in suspected concretion or gas hydrate zones are characterized by early refusal at depth between 5 m and 18 m with high cone resistance values (qt ranging between 10 and 25 MPa).
 |
|
Fig. 4. Bathymetry map showing gravity cores locations (KS), CPT (PM) and sonic CPT (PV) measurements positions.
|
|
Results determined the vertical effective stress,  , derived from the unit weight measurements, the corrected cone resistance, qt, the friction, fs, and the pore pressure, u2, as a function of depth at PM33-D, PM33-E, PM27-A and PM23-A, respectively. , derived from the unit weight measurements, the corrected cone resistance, qt, the friction, fs, and the pore pressure, u2, as a function of depth at PM33-D, PM33-E, PM27-A and PM23-A, respectively.
PM33-D, considered a reference site based on seismic data, had very low sediment unit weight, and its corrected cone resistance, friction and excess pore pressure increased linearly with depth. At 30 mbsf, the corrected cone resistance, qt, was about 650 kPa, friction, fs, was about 22 kPa and excess pore pressure, ∆u2, was about 236 kPa.
PM33-E, located where free gas was suspected because of low P-wave velocities, was characterized by a low unit weight, and at 30 mbsf, the corrected cone resistance was about 670 kPa, friction was about 24 kPa and excess pore pressure was about 413 kPa.
Excess pore pressure, ∆u2, generated by rod penetration in PM33-E was twice the ∆u2 of PM33-D. Free gas is probably the origin of high excess pore pressure at PM33-E. The temperature increase generated by rod penetration could cause a volume expansion of the free gas (and probably gas exsolution), leading to an increase of excess pore pressure. Gas occurrence causes a decrease of soil permeability and consequently an increase of excess pore pressure generated during rod penetration. High-excess pore pressure at gassy sites was confirmed at other sites where gas occurrence was suspected.
PM27-A, performed where gas hydrates were previously identified from a gravity core, KSF-20, collected during the NERIS1 cruise, which showed a decrease of vertical effective stress at about 2.4 mbsf, and a sudden increase of corrected cone resistance, friction and excess pore pressure at the same depth. Measurement results confirm the existence of gas hydrate, which is characterized by a low unit weight, decrease of the vertical effective stress, high strength resistance (increase of qt and fs) and low permeability (increase of ∆u2), Fig. 5.
 |
|
Fig. 5. Site PM27-A: a) mass density, b) vertical effective stress, c) corrected cone resistance, d) friction and e) pore pressure as a function of depth.
|
|
PM23-A, performed where carbonate concretions were identified from gravity cores collected during the NERIS1 cruise, showed a sudden increase of corrected cone resistance and friction at 4 mbsf. The excess pore pressure generated by the rod penetration was, for several levels at PM23-A, lower than the hydrostatic pressure. High permeability of carbonate concretions and dilatancy generated by friction are probably the origin of the negative pore pressure. The measurement results confirm the existence of the carbonate concretions, which are characterized by high strength resistance (increase of qt and fs), high permeability (decrease of ∆u2) and normal density characterized by a linear increase with depth of the vertical effective stress, Fig. 6.
 |
|
Fig. 6. Site PM23-A: a) mass density, b) vertical effective stress, c) corrected cone resistance, d) friction and e) pore pressure as a function of depth.
|
|
Sonic CPT testing. Four sonic CPTs were carried out in three different environments. Two sonic CPTs (PV39-A and PV40-A) were completed where evidence from the NERIS1 cruise shows gas-hydrate-charged marine sediment, one sonic CPT (PV39-B) where evidence showed carbonate concretions, and one sonic CPT (PV40-B) in a reference area far from disturbed zones.
The maximum range of measurement of the P-wave sensor is 2,000 m/s, causing P-wave measurements to be blocked-up for two sites, PV39-A and PV40-A, due to depths exceeding 2,000 m/s in hydrate.
Gas hydrate was encountered at about 8 mbsf at PV39-A. It is interesting to note that at site PM27-A, 20 m from site PV39-A, gas hydrate was met at about 3 mbsf, indicating heterogeneous distribution of gas hydrate within the sediment.
At PV39-B, there is an abrupt increase of P-wave velocity, about 20 m/s, at about 14 mbsf that is probably related to the presence of carbonate concretions. At an adjacent site, PM23-A, the carbonate concretions were met at around 4.5 mbsf.
At PV40-A, gas hydrate was encountered at about 1 mbsf, while it was met at about 6 mbsf at adjacent site PM33-B, and shows evidence of the co-existence of the gas and the gas hydrate.
Reference site PV40-B shows uniform values of P-wave velocities over the first 12 m corresponding to the first reflector from seismic data. The mean value of Vp is about 1,465 m/s, which fits well with the upper values of Vp above the carbonate concretions at PV39-B.
Laboratory measurements. Results of the classification tests show two layers with a clear boundary at about 5 mbsf. The upper layer is more silty than the lower one. The high clay content of the lower sediment layer induces a decrease of the P-wave velocity from 1,490 m/s in the upper layer to about 1,480 m/s in the lower one.
A disparity was observed between mean P-wave velocities obtained from in situ testing using the sonic CPT (about 1,480 m/s) and the velocity obtained from laboratory tests (about 1,465 m/s) that is partly related to the temperature changes between in situ (≈ 4°C) and laboratory (20°C). Using two different sensors, even with the same characteristics and frequency, has also contributed to this difference.
Results of the shear tests show a clear limit between the upper and lower sediment layers, where the upper layer showed a greater shear/stress ratio than the lower layer. Compressibility tests showed a trend where void ratio decreased with vertical effective stress, and permeability decreased with void ratio decrease.
Results of the acoustic sediment testing showed a relationship between capillary pressure and P-wave velocities. Two stress paths, C1 and C2, represent an increase in effective confining pressure and capillary pressure, respectively. An increase in confining pressure caused a decrease of void ratio, which in turn, caused an increase of P-wave velocity. An increase in capillary pressure, stress path C2, caused a decrease in P-wave velocities from 1,503 m/s to 1,017 m/s.
DISCUSSION
By using a model developed by Van Genutchen and porosimeter curves from a study by De Gennaro et al,14 the relationship between water saturation and P- and S-wave velocities was extrapolated. Seven void parameters were determined, and their retention curves allowed the correlation of water saturation to capillary pressure (using stress path C2).
Velocity anomalies. In marine environments with suspected gas hydrate, positive velocity anomalies, or those higher than water-compacted sediment, are attributed to gas hydrate, while lower velocities are attributed to free gas. Several methods were developed to translate velocity anomalies, and in this work, we have used the Helgerud et al. three-phase effective medium theory method.15
The Helgerud et al. model considers gas hydrate as either a component of the matrix or an element filling pore space. The gas hydrate recovered from gravity cores was often massive and rarely disseminated in the sediment pores. Figures 7a-b show the top of the gas hydrate occurrence zone at site PM27-A, which is at about 3 mbsf. The presence of gas hydrate at PM27-A is shown by a decrease of mass density of hydrate-bearing sediments and an increase of cone resistance, qt. Hydrate fraction h and internal friction angle  (°) were calculated from the mass-density and the cone resistance qt. Figure 7c shows the effect of the hydrate fraction on the increase of the internal friction angle and illustrates that internal friction angle increases occurred at low hydrate fraction (< 2%). (°) were calculated from the mass-density and the cone resistance qt. Figure 7c shows the effect of the hydrate fraction on the increase of the internal friction angle and illustrates that internal friction angle increases occurred at low hydrate fraction (< 2%).
 |
|
Fig. 7. In situ CPT measurements showing variation as a function of depth of sediment mass-density (a), cone resistance qt (b) and hydrate fraction h (c).
|
|
Parameters used in the Helgerud et al. model were identified based on laboratory geotechnical tests performed on core N2-KSF43, and calculations showed gas saturation corresponding to P-wave velocities obtained from experimental capillary pressure tests. An agreement can be observed between calculated predictions and experimental results concerning the effect of gas content on the P- and S-wave velocities.
Based on properties identified in laboratory tests, the P-wave velocity anomalies obtained from seismic data were used to determine distribution and saturations of gas hydrate and free gas using the Helgerud et al. model. Saturation of pore space varies significantly along the study area. The highest hydrate saturations correspond to 30% of pore space averaged over the first 15 m, while highest gas saturations correspond to 1% of the pore space. It is important to mention that the gas and gas hydrate fraction corresponds to the mean value over the first reflector, which represents the first 15 m below the seafloor.
Difference between seismic and in situ data. Two main targets, A1 and B1, were selected to compare the free gas and gas hydrate prediction from the seismic data to the in situ testing, Fig. 4.
|
|
Fig. 4. Bathymetry map showing gravity cores locations (KS), CPT (PM) and sonic CPT (PV) measurements positions.
|
|
A1 concerns a pockmark where, according to seismic data, the northern and western sections are characterized by gas hydrate, and free gas occurs at the eastern and southern sections of the pockmark. Piezocone results from site PM33-E show free gas existence. Piezocone results for PM33-F are comparable to PM33-E, with both showing excess pore pressure generated by the rod penetration due to free gas. The other test site located in A1, PM-33G, is similar to reference site PM-33D and has neither free gas nor gas hydrates present.
The second target, B1, concerns a peanut-shape pockmark. In this pockmark, 5 CPTs (PM22-B, PM22-C, PM23-A, PM23-B and PM23-Bbis) and 1 sonic CPT (PV39-B) were performed. Cores recovered during the NERIS1 cruise from the pockmark showed the presence of carbonate concretions. However, seismic data predicts gas hydrate occurrence at the same pockmark. All CPTs measurements performed in the peanut-shape pockmark showed a high, corrected cone resistance with low excess pore pressure, indicating carbonate concretions, even though the high P-wave velocity indicated gas hydrate. In this instance, P-wave velocity values alone were not enough to distinguish between gas hydrates and carbonate concretions.
CONCLUSION
The main aim of this work was the definition of a protocol to characterize free gas, gas hydrates and carbonate concretion occurrence. Analysis of P-wave velocities obtained from the seismic data and in situ testing show that:
- High excess pore pressure during CPT rod penetration was observed in areas showing low P-wave velocities from seismic data that were suspected to have free gas. During rod penetration, expansion of gas bubbles and low permeability of gassy sediments were probably the causes of high excess pore pressure.
- Comparison between in situ testing using the piezocone, recovered cores and P-wave velocities derived from the first reflector of seismic data has shown that seismic data is a valuable tool to identify high-risk areas characterized by abnormal low or high P-wave velocities. However, it was impossible to discriminate between gas hydrate and carbonate concretions from high P-wave velocity anomalies alone.
- CPT testing determines the difference between gas hydrate and carbonate concretions by measuring excess pore pressure and density. Gas hydrate is characterized by a low density (<1) and high excess pore pressure, and carbonate concretions showed a low excess pore pressure (in some cases lower than the hydrostatic pressure). The reasons for these differences are 1) low permeability of the hydrate phase impedes the dissipation of pore pressure generated by the cone penetration and 2) high permeability of carbonate concretions favors pore pressure dissipation and dilatancy of sediment generated by friction.

ACKNOWLEDGEMENT
The support by officers and crew during NERIS1 and NERIS2 cruises is greatly appreciated, as is the dedication of the penetrometer staff during the NERIS2 cruise. The authors acknowledge Didier Drapeau, Martin Hovland and Anne M. Tréhu for useful suggestions and remarks.
LITERATURE CITED
1 Hovland, M. and J. W. Gallagher, “Gas hydrate and free gas volumes in marine sediments: Example from the Niger Delta front,” Marine and Petroleum Geology, 14(3), 1997, pp. 313-328.
2 Brooks, J. M., Bryant, W. R., Bernard, B. B. and N. R. Cameron, “The nature of gas hydrates on the Nigerian continental slope,” Ann. N.Y. Academy of Science, 912, 2000, pp. 76-93.
3 Damuth J. E., “Neogene gravity tectonics and depositional processes on the deep Niger Delta continental margin,” Marine and Petroleum Geology, 11, 1994, pp. 320-346.
4 Cohen, H. A and K. McClay, “Sedimentation and shale tectonics of the northwestern Niger Delta front,” Marine and Petroleum Geology, 13, 1996, pp. 313-328.
5 Haskell N., Nissen S., Hughes M., Grindhaug J., Dhanani S., Heath R., Kantorowicz J., Antrim L., Cubanski M., Nataraj R., Schilly M. and S. Wigger, “Delineation of geologic drilling hazards using 3-D seismic attributes,” The Leading Edge, Tulsa, 1999, pp. 373-382.
6 Nissen, S. E., Haskell N. L., Steiner, C. T. and K. L. Coterill, “Debris flow outrunner blocks, glide tracks, and pressure ridges identified on the Nigerian continental slope using 3-D seismic coherency,” The Leading Edge, Tulsa, 1999, pp. 595-599
7 Graue, K., “Mud volcanoes in deepwater Nigeria,” Marine and Petroleum Geology, 17, 2000, pp. 959-974.
8 Deptuck, M. E., Steffens, G. S., Barton, M. D. and C. Pirmez, “Architecture and evolution of upper fan channel belts on the Niger Delta slope and in the Arabian Sea,” Marine and Petroleum Geology, 20, 2003, pp. 649-676.
9 Heggland, R., “Vertical hydrocarbon migration at the Nigerian Continental Slope: Applications of seismic mapping techniques,” presented at AAPG Annual Convention, Salt Lake City, May 11-14, 2003.
10 Le Chevalier, V., “Application of seismic attribute for deep offshore seabed features characterization: preliminary results for the NERIS project,” ENSPM report, 2002, pp. 1-30.
11 Arnaud J., Rappin D., Dunand J-P and V. Curinier, “High-density picking for accurate velocity and anisotropy determination,” presented at Annual International SEG Convention, Denver, Colorado, Oct.10-15, 2004, pp. 1627-1629.
12 Cauquil, E., Curinier, V., Legeron-Cherif, S., Piriac, F., Leron, A. and N. Sultan, “Deep-water seabed characterization using geostatistical analysis of high density/high resolution velocity field,” presented at AAPG International Conference, Paris, Sept. 11-14, 2005.
13 Meunier, J., Sultan, N., Jegou, P and F. Harmegnies, “First tests of Penfeld: a new seabed penetrometer,” presented at International Offshore and Polar Engineering Conference, Toulon, France, 2004, pp. 338-345.
14 De Gennaro, V., Delage, P. and E. De Laure, “Comportement des sols marins grande profondeur,” Projet CLAROM no. CEP&M 7510/02, final report, 2004, pp. 1-41.
15 Helgerud, M. B., Dvorkin, J., Nur, A., Sakai, A. and T. S. Collett, “Elastic-wave velocity in marine sediments with gas hydrates: effective medium modeling,” Geophysical Research Letters, 26, 1999, pp. 2021-2024.
|
THE AUTHORS
|
|
|
Nabil Sultan earned a PhD in geotechnical engineering from Ecole Nationale des Ponts et Chaussées, Paris, received in 1997. He joined Institut Français de Recherche pour l’Exploitation de la Mer (IFREMER) in 2000. His areas of interest are laboratory and field tests, geomechanics, gas hydrates and slope stability analysis.
|
|
| |
Tania Marsset is a researcher at IFREMER. She received her PhD in Geology in 1988 from University of Paris 6 and a Masters in computer sciences in 1990 from Institut d’Informatique Industrielle of Brest. She is a specialist in seismic stratigraphy of sedimentary bodies.
|
|
| |
Antoine-Mathieu Vernant earned his MS in geotechnics from Ecole Centrale de Paris in 2004 and an MS in applied geology from the University of Besançon in 2005. He joined Cathie-Associates in Brussels in 2006.
|
|
| |
Eric Cauquil is a seabed survey engineer specializing in deepwater environments for Total. He graduated with a PhD in earth sciences from Paris University, France, in 1992. Since 1996, Cauquil has been in charge of worldwide deepwater geophysical surveys for Total exploration and development projects.
|
|
| |
Vincent Curinier received an MSc in geophysics in 1999 at the EOST Strasbourg, France. He has been working with Total since 2000 where he worked as a research geophysicist, processing geophysicist and recently, as an interpretation geophysicist in Gabon since 2006.
|
|
| |
Jean-Louis Colliat earned his PhD in geotechnics from the University of Grenoble, France, in 1986. He joined Geodia in 1986, then Elf in 1991, and Total in 2000. His main interests are offshore geotechnical engineering.
|
|
|


