SPECIAL FOCUS: EXPLORATION
Graphical analysis of laminated sand-shale formations in the presence of anisotropic shales
A graphical crossplot can describe petrophysics better than a set of equations and allow instant visualization of the solutions.
Chanh Cao Minh, Schlumberger; Jean-Baptiste Clavaud and Padmanabhan Sundararaman, Chevron; Serge Froment, Emmanuel Caroli and Olivier Billon, Total; Graham Davis and Richard Fairbairn, CNRI
Laminated sand-shale models with anisotropic shales have been discussed extensively. The interpretation methods are written in elaborate mathematical equations. However, there has not been a clear procedure to determine key parameters such as shale anisotropy, to guide the choice of solution, and, more importantly, to recognize the circumstances in which a solution is robust or sensitive to errors.
A graphical crossplot gives better insights into petrophysics than a set of equations, while interactivity allows instant visualization of the solutions, thereby helping the petrophysicist in the most effective way.
Objectives of graphical analysis are:
- To determine the shale anisotropy parameters and whether it is necessary to create multiple zones
- To define the region boundaries where each analytical solution is applicable
- To illustrate the effect of data outliers on the results
- To quickly perform sensitivity tests.
Pay region and non-pay region are subsequently defined, which allows a global assessment of the hydrocarbon potential of the thin-beds sections directly from the chart.
INTRODUCTION
Klein et al. were first to lay out the interpretation framework of electrically anisotropic reservoirs (i.e., thin sand-shale laminations) in 1997.1 This was adapted by Shray et al. and Fanini et al. in 2001 with the addition of other logs.2 However, the basic shortcoming of their models was the assumption of isotropic shales that seldom exist in reservoirs under normal compaction.
The effect of anisotropic shales was treated by Clavaud et al. in 2005.3 Anisotropic shales are described by two independent parameters, Rshh and Rshv, representing the shale horizontal and vertical resistivity, respectively.
However, introducing one more unknown, Rshv, to an already under-balanced set of Rv, Rh equations further complicates the algebraic solutions. Erroneous anisotropic shale parameters can lead to either optimistic or pessimistic results with few means to verify.
Here we emphasize the graphical solutions of Rv, Rh equations adjusted for shale anisotropy. Just as one picks a shale point from a density-neutron crossplot and visually has a feel for the shale volume, likewise it can be shown that one can pick an anisotropic shale point and visually have a feel about the shale volume, the sand layer resistivity, and its corresponding water saturation. The graphical method allows the petrophysicist to choose parameters, perform Quality Check (QC) and quickly assess the potential of the thin-beds reservoirs with just one look at the crossplot data.
GRAPHICAL ANALYSIS
The equations of an isotropic sand-anisotropic shale system (Fig. 1) are described below:
Rv = FsandRsand + FshRshv
1/Rh = Fsand / Rsand + Fsh / Rshh
1 = Fsand + Fsh
where Rv and Rh are the vertical and horizontal resistivity, respectively, Rsand and Fsand are the sand layer resistivity and volume fraction, respectively, and Rshv, Rshh and Fsh are the shale layer vertical and horizontal resistivity and volume fraction, respectively.
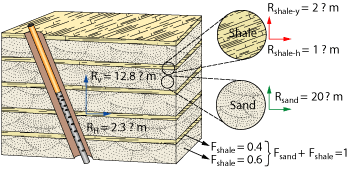 |
Fig. 1. Isotropic sand-anisotropic shale model.
|
|
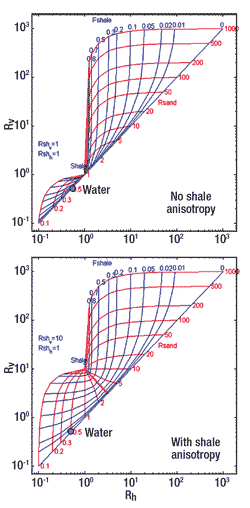 |
Fig. 2. Graphical representations of equation 1 for an isotropic shale (top) and an anisotropic shale (bottom). The shale anisotropy effect is to move the shale point to the northwest. The blue family of curves represents various Fsh values, while the red family of curves represents various Rsand values.
|
|
Figure 2 illustrates the forward model of Eq. 1 for a particular set of Rshv and Rshh. The top plot is the original Klein plot. The bottom plot is the generalized plot to account for shale anisotropy and forms the basis of the graphical analysis. The following observations are made:
Sand sensitivity. At Fsh = 0%, Rv equals Rh and the data plots on the 45° line. Isotropic hydrocarbon-bearing and water-bearing sands will plot along that line. It is important to note that sands with dispersed shales and structural shales will also plot on the 45° line, although they are not clean (i.e., “isotropic” does not equal “clean”).
Water line. Assume the wet-zone resistivity is 0.5 Ω-m as shown by the cyan dot. The progression from the clean water point to the shale point with increasing shale content follows a curved path along the red curve corresponding to Rsand = 0.5 Ω-m (and not a straight line joining the water point to the shale point). This establishes the water-bearing curve. Any data point that lies above that curve will have Sw < 1.
Data domain. The data region is therefore bound to the east by the 45° line, to the north by the maximum measured sand resistivity, to the west by the anisotropic shale position and Fsh = 100% curve, and to the south by the water-bearing curve discussed above.
Domain boundaries. The thick red line originating from the shale point is Rsand curve defined by the equation RvRh = RshvRshh (which is a hyperbola in linear axes or a line in logarithmic axes). In logarithmic axes, this unique Rsand line is normal to the Fsh family of curves and intersects at right angle the 45° line at coordinates
Its significance is as follows:
a. For  (data point above the line), the solutions to Clavaud’s equations 4 and 5 are the positive root for Rsand and negative root for Rshale. (data point above the line), the solutions to Clavaud’s equations 4 and 5 are the positive root for Rsand and negative root for Rshale.
b. For  (data point below the line), the solutions to Clavaud’s equations 4 and 5 are the negative root for Rsand and positive root for Rshale. (data point below the line), the solutions to Clavaud’s equations 4 and 5 are the negative root for Rsand and positive root for Rshale.
c. For  (data point on the line), the positive and negative roots of Rsand are equal, and the positive and negative roots of Rshale are also equal. In other words, the quadratic equations in Rsand and Rshale are perfect squares. (data point on the line), the positive and negative roots of Rsand are equal, and the positive and negative roots of Rshale are also equal. In other words, the quadratic equations in Rsand and Rshale are perfect squares.
d. The line divides the butterfly chart into two distinct regions: 1) the top wing representing obvious, good, highly anisotropic, low-Sw, hydrocarbon-bearing sands, and 2) the bottom wing representing non-obvious, marginal, mildly-anisotropic, high-Sw, hydrocarbon-bearing sands as well as water-bearing sands.
The above discussion applies to solving equation 1 with Fsh as input (which gives the most complicated expression). Solving equation 1 with both Rshv and Rshh as input is much simpler and does not require switching between the positive or negative roots (only positive roots are valid). Thus, we have defined the possible envelope of the Rv, Rh data. A simple look at where the data plots on the chart shows whether the thin beds are pay or non-pay, Fig. 3.
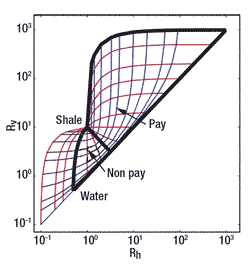 |
Fig. 3. Domain boundaries of Rv, Rh data with defined pay region and non-pay region drawn in thick black lines.
|
|
Shale sensitivity. It can be seen that when Fsh exceeds about 90%, the Fsh isolines are nearly vertical/horizontal around the shale point. There is not enough sensitivity to determine accurately high shale volumes with the resistivity anisotropy technique.
Changing Rshv is equivalent to distorting the Fsh, Rsand grid about the 45° line by moving the shale point up or down. It can be seen that for data in the pay region, Fsh results remain little changed, while Rsand results will change in anisotropic zones. For data in the non-pay region, the reverse conclusion applies.
Changing Rshh is equivalent to distorting the Fsh, Rsand grid about the 45° line by moving the shale point left or right. For data in the pay region, Rsand results remains little changed, while Fsh results will change in anisotropic zones. For data in the non-pay region, the reverse conclusion applies.
Quicklook Sw. The Rsand family of curves can be re-scaled in Sw- assuming the porosity in the thin sands is the same as the porosity in the isotropic thick sands. When the user clicks on an isotropic water point on the crossplot, the wet resistivity, Ro, is defined. Then, Sw is calculated as  assuming Rw and Archie parameters are the same in all sands. Thus, Swcan be read off the chart opposite Rsand values as shown in Fig. 4. assuming Rw and Archie parameters are the same in all sands. Thus, Swcan be read off the chart opposite Rsand values as shown in Fig. 4.
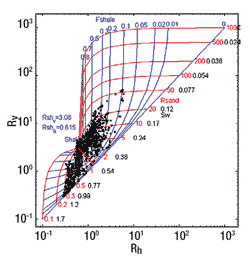 |
Fig. 4. Quicklook estimation of Sw from the chart.
|
|
Interactive Rv, Rh crossplot. The graphical analysis consists of the following steps:
1. Crossplot Rv, Rh data.
2. Select the shale point with the mouse. A fast forward-modeling routine is called to display the butterfly overlay.
3. Input Ro with the mouse for a quick estimate of Sw.
4. Observe pay and non-pay regions. Make decisions. Perform interactively sensitivity tests such as changing shale point and visualizing data clusters on the crossplot and their corresponding depth intervals.
5. The routine also solves for Rsand, Fsh with shale resistivities input, and for Rsand, R sh with shale fraction input if available.
6. If additional porosity data and Archie parameters are available, the routine automatically re-computes Sw.
7. Generate results plots.
The above steps are illustrated in the examples below.
EX. 1: SIMILAR THIN-BEDS AND SHALES ANISOTROPY
The Rv, Rh data seen previously is displayed in Fig. 5 together with other openhole logs. In this example, the shales anisotropy is the same as the thin-beds anisotropy. A clean, isotropic water-bearing sand can be seen about 1,080 ft.
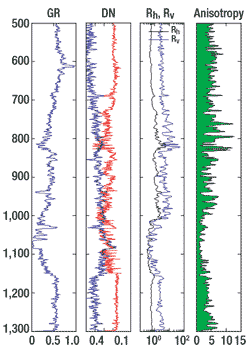 |
Fig. 5. Rv, Rh data displayed with other openhole logs for Example 1. Shales anisotropy and thin-beds anisotropy are similar, as seen in track 4.
|
|
The workflow is as follows:
1. First, we choose the shale point from the crossplot, Fig. 6. With Rshv, Rshh values specified, Fsh and Rsand curves are generated to form the overlay.
 |
Fig. 6. Interpreted Rv, Rh crossplot. Data corresponding to shales, water zone and pay zones are shown in green, cyan and magenta, respectively. It is interactively selected from the crossplot. The corresponding depth intervals are shown in left-track 3 of Fig. 7.
|
|
2. The lowest resistivity isotropic data point on the 45° line is suggested as Ro (which can be overridden by the user). Rsand lines are then re-scaled in terms of Sw values and displayed as seen in Fig. 6. Pay zones are instantaneously indicated by data points plotted in the upper wing of the butterfly chart with Swranging from 7.7 su to 30 su.
3. Equation 1 is then solved with shale resistivities input to provide the Rsand curve (red) displayed in track 3 and Fsh curve (red) displayed in track 1 of Fig. 7. Note how well Fsh tracks the normalized GR log in blue.
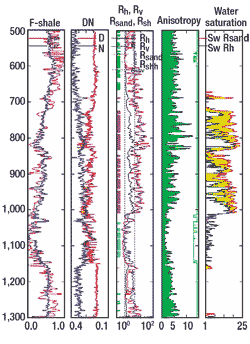 |
Fig. 7. Graphical analysis results. The graphical method successfully evaluates hydrocarbon-bearing thin-beds intervals from shales intervals with similar anisotropy. The green rectangular line on the right side of track 4 indicates whether the data will plot on the upper or lower wing of the butterfly chart.
|
|
4. With porosity logs shown in track 2, Sw is recomputed with both Rsand
(Sw Rsand red) and Rh (Sw Rh black) for comparison purpose, and displayed in track 5 of Fig. 7. The hydrocarbon gain is highlighted by the yellow area.
5. Water zones (cyan), shales zones (green) and thin-beds pay zones (magenta) are interactively selected with the mouse from the crossplot (Fig. 6) and displayed on the left of track 3, Fig. 7.
6. Movie answer is generated to QC the results, Fig. 8.
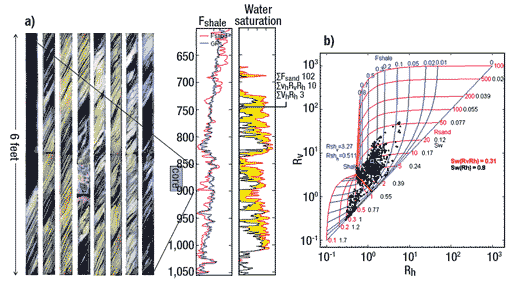 |
Fig. 8. Graphical analysis movie answer and QC display. A horizontal moving bar in the Sw track lists the cumulative sand volume (∑Fsand), the hydrocarbon volume from Rv, Rh (∑VhRvRh) and the hydrocarbon volume from Rh (∑VhRh). The Rv, Rh data point at this depth is shown as the bold cyan square on the self-updating crossplot on the right, thus allowing graphical CQ of the result. The user can move the movie slider to any desired depth. A 48-ft (8 x 6-ft) section of core photographs taken over the thin beds is shown on the left (not part of the movie).
|
|
7. Verification with image logs/core.
What happens if shale anisotropy is not accounted for? Figure 9 shows the results of such an analysis where Rshh = Rshv = 0.4 Ω-m. The crossplot on the left shows that the shale points now belong to the pay zone (upper wing of the butterfly chart). As a result, erroneous hydrocarbon saturations are computed in the shales as seen in the water saturation track on the right.
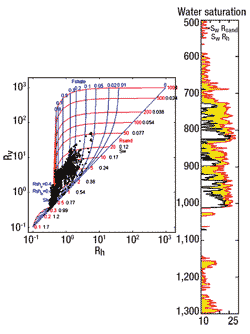 |
Fig. 9. Unaccounted shale anisotropy leads to erroneous hydrocarbons indications. The correct saturation is shown in Fig. 7.
|
|
EX. 2: MULTIPLE SHALE POINTS
Figure 10 shows Rv, Rh crossplot data and openhole logs. There is no water zone in this example.
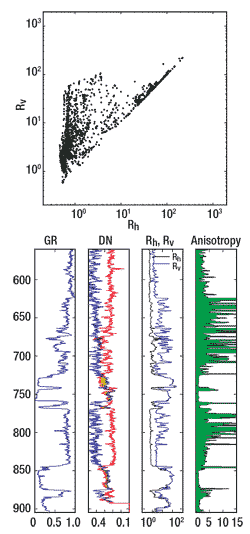 |
Fig. 10. Example 2 Rv, Rh crossplot data showing multiple shale points (a) and OH logs (b). Track 4 shows two main zones of anisotropy above and below 750 ft.
|
|
Separating the interval into two zones at 750 ft and re-crossplotting the data highlight the two shale points as shown in Fig. 11. In both zones, all data plot in the upper wing of the butterfly chart, indicating both zones have good thin-beds pays. The crossplots show that the maximum Rsand in both zones is about 100 Ω-m, which would not have been possible if a single shale point was used. It is also evident that the top zone has more good thin beds than the bottom zone.
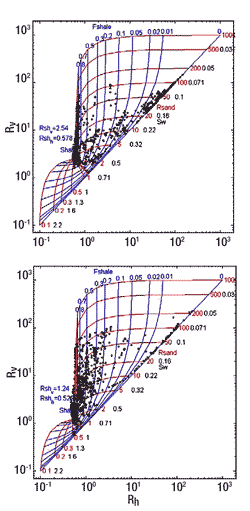 |
Fig. 11. Bottom-zone interpreted Rv, Rh crossplot data (a) and top-zone interpreted Rv, Rh crossplot data (b).
|
|
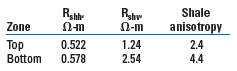
What are the effects if only one shale point was used? Figure 12 shows the hydrocarbon gain (yellow area) computed with a single set of top shale parameters in track 4 compared with the hydrocarbon gain (yellow area) computed with a single set of bottom shale parameters in track 5. The conclusion is that using the wrong shale parameters can make the result either too optimistic or too pessimistic. Note the seemingly insignificant differences between the top and bottom shale resistivities, Table 1.
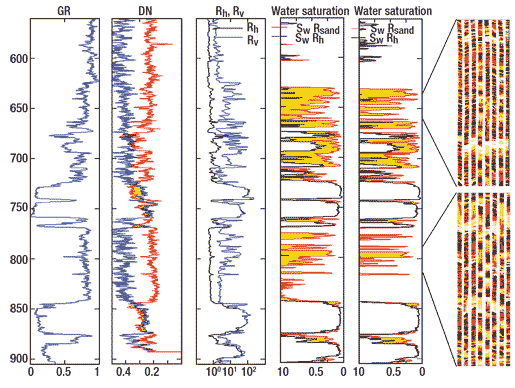 |
Fig. 12. Example 2 water saturation comparison between top shale parameters (track 4) and bottom shale parameters (track 5). Optimistic or pessimistic results are obtained when a single shale point is used. High-resolution resistivity images are shown on the right.
|
|
| TABLE 1. Shale parameters used in example 2. |
 |
|
CONCLUSION
The graphical analysis of thin sand-shale laminations in the presence of anisotropic shales is a simple, robust and intuitive way to interpret Rv, Rh data.
Its interactivity allows the petrophysicist to visualize possible scenarios, perform quickly sensitivity tests and QC the results with confidence.
The chart shows directly the domain boundaries of Rv, Rh data, with well-defined pay region and non-pay region, that allow global assessment of the thin beds’ hydrocarbon potential. 
ACKNOWLEDGEMENTS
This article was prepared from “Graphical analysis of laminated sand-shale formations in the presence of anisotropic shales” presented at the SPWLA 48th Annual Logging Symposium, Austin, Texas, June 3-6, 2007. The authors thank the oil and gas companies for the permission to use the data shown in this article, and the anonymous reviewers who helped to improve the article’s content and readability.
LITERATURE CITED
1 Klein, J.D. et al., “The petrophysics of electrically anisotropic reservoirs,” The Log Analyst, 38, No. 3, May-June 1997.
2 Fanini, O. et al., “Enhanced, low-resistivity pay, reservoir exploration and delineation with the latest multicomponent induction technology integrated with NMR, nuclear, and borehole image measurements,” SPE 69447 presented at the SPE Latin American and Caribbean Petroleum Engineering Conference, Buenos Aires, Argentina, 2001; Shray, F. et al., “Evaluation of laminated formations using nuclear magnetic resonance and resistivity anisotropy measurements,” SPE 72370 presented at the SPE Eastern Regional Meeting, Canton, Ohio, 2001.
3 Clavaud, J.B. et al., “Field example of enhanced hydrocarbon estimation in thinly laminated formation with a triaxial array induction tool: A laminated sand-shale analysis with anisotropic shale,” presented at the SPWLA Annual Logging Symposium, New Orleans, Louisiana, 2005.
|
THE AUTHORS
|
|
Chanh Cao Minh is the petrophysics adviser for Schlumberger with 29 years’ experience. He was an engineering manager at the Sugar Land, Texas, campus of Schlumberger Product Center.
|
|
|
Jean-Baptiste Clavaud is a research petrophysicist with the Formation Evaluation Development team of Chevron Technology Corp. Clavaud earned a PhD degree in geophysics from the University of Paris.
|
|
|
Padmanabhan Sundararaman earned a PhD degree in organic chemistry from Florida State University. He is the chief petrophysicist at Chevron in Angola.
|
|
|
Serge Froment is the head of Operation Geology at Total E&P Angola since August 2005. He joined Total’s group in 1983 and worked as operation geologist and new venture geologist.
|
|
|
Emmanuel Caroli is the chief petrophysicist at Total E&P Angola. He joined Total’s group in 2003 and worked for two years on the development of geochemical reacting reservoir models dedicated to acid gases sequestration.
|
|
|
Olivier Billon is an exploration geologist for Total E&P Angola. He previously worked as a wellsite geologist in Brunei, Cameroon and Congo and a petrophysicist at the Paris headquarters.
|
|
|
Graham Davis is the chief petrophysicist at Canadian Natural Resources (CNR) International. Before joining CNR he was a local petrophysics network leader at BP and previously held positions for Shell and Enterprise Oil.
|
|
|
Richard Fairbairn works on CNR’s international portfolio of interests, primarily in the North Sea and western and southern Africa. Previously, he worked for Shell and consultancy companies.
|
|
|

