SPECIAL FOCUS: 54TH REEDHYCALAG RIG CENSUS
Rig building continues while fleet utilization declines
Though the global rig fleet continues to expand, utilization in the US and Canada drops significantly, while remaining stable in other global markets.
Steve Berkman and Tory Stokes, ReedHycalog, Houston
Healthy industry conditions over the past few years have prompted additional owners and rigs to enter the drilling market. The rapid expansion of the rig fleet, especially due to newbuilds, continues to be noteworthy. This year however, as fleet capacity accelerates, utilization has fallen in many areas due to market softening and fleet expansion, according to the 54th annual ReedHycalog Rig Census.
ReedHycalog continues to work closely with RigData, Nickle’s Rig Locator and ODS-Petrodata to summarize the US, Canadian and global offshore mobile rig fleets. The international land rig fleet has also been examined for the third consecutive year, as we compile an overall picture of the dynamic global rig market.
CENSUS STATISTICAL HIGHLIGHTS
Key statistics from this year’s census include the following:
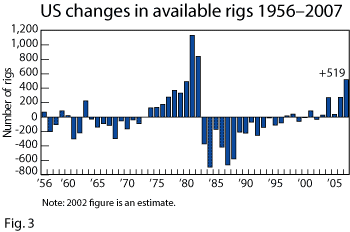
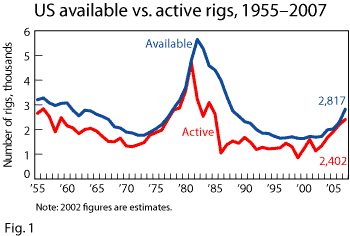
- The US rig fleet had a net gain of 519 rigs this year, increasing the total fleet by 23% to 2,817 units. This net increase is the result of 614 rig additions and 95 deletions during the past year, Fig. 1.
- Newly manufactured rigs, at 349 units, were the largest addition to the US fleet.
- The total number of US rigs meeting the census definition of “active” was 2,402, versus 2,200 last year, an increase of 9%.
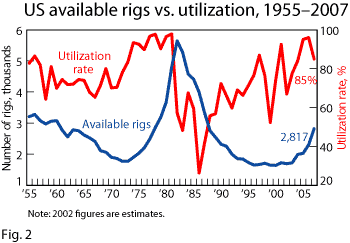
- US rig utilization dropped significantly to 85% from 96% in 2006, Fig. 2.
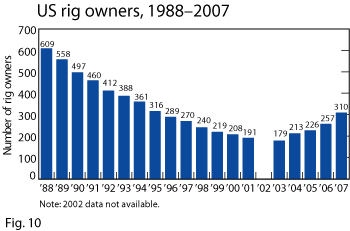
- The total number of US rig owners increased by 53 companies this year to 310.
- Lease operators now own 11% of all drilling rigs, compared with 5% a year ago.
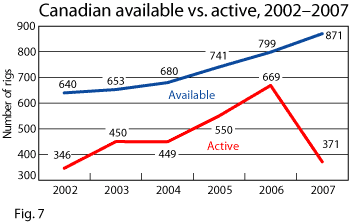
- The Canadian available rig fleet attained another record high, up to 871 units from 799. This includes 86 newly manufactured rigs that came online this year.
- Canadian rig activity plummeted, however, pushing utilization down to 43% from 84%.
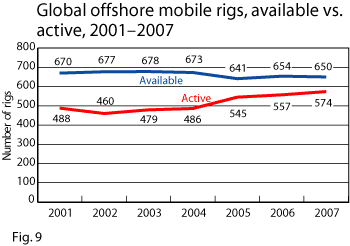
- The global offshore mobile fleet was relatively stable, dropping by just 4 units to 650.
- Global offshore mobile utilization rose slightly to 88%, versus 85% last year.
- Outside the US and Canada, utilization was down 1% to 94% for 2007.
|
| |
|
| |
RIG AVAILABILITY: LARGE NUMBER OF NEWBUILDS ENTER US FLEET
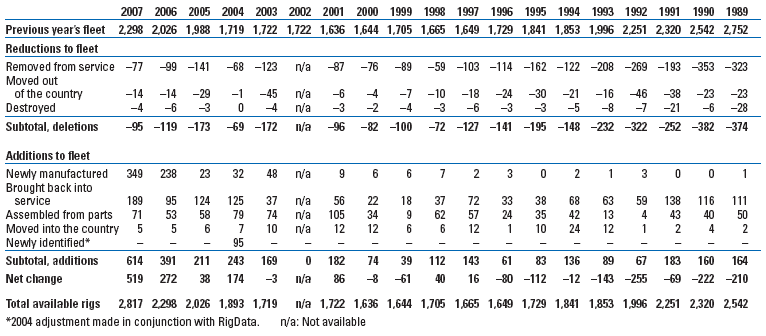
Rig-building programs that were established a few years ago due to favorable drilling economics are now turning out large numbers of rigs. Furthermore, owners are reactivating and refurbishing older units at an increased rate. With the assistance of RigData, census takers reported the US fleet gained 614 rigs over the past year, up from 391 units added in 2006. The 614 rigs added to the fleet more than offset reductions. Fleet additions fall into one of four categories, Table 1:
- Newly manufactured rigs
- Rigs brought back into service
- Rigs assembled from parts
- Rigs moved into the country.
TABLE 1. Changes in the available US fleet
Click Table to Enlarge |
 |
|
Most of this year’s gain has come from rigs that were newly constructed. Adding last year’s 238 newly manufactured rigs to this year’s 349, a total of 587 units have entered the US fleet in just two years, with even more on the way. Of the 349 new units added this year, owners reported building 344 land rigs, three platform units and two jackups.
The number of US rigs brought back into service climbed for 2007, 189 units versus 95 that were reactivated in the previous year’s census. Each of these units had been accounted for in previous years, but they were subsequently removed due to becoming inactive or inoperable. As market conditions improved, these rigs were reactivated or refurbished and put back into service.
Rigs brought into the fleet this year for the first time that were assembled from component parts numbered 71. This was up from 53 a year ago. Although there are still some rigs created from reconditioned components when rigs are needed to replace aging equipment, an increasing percentage of rigs added to the fleet are newbuilds.
This year’s census counted five rigs that were brought into the US from other countries, the same number as were imported in 2006. Rig movement out of the US is covered below.
US RIG ATTRITION DECLINES
Marginal rigs will always be removed from service after their useful life cycle. Units removed from the US fleet over the past year totaled 95, a further decline from the 119-unit drop in 2005-2006. Deletions to the fleet were reported in three categories, Table 1:
- Rigs removed from service
- Rigs moved out of the country
- Destroyed rigs.
Census rules have always excluded rigs from the available count that have been stacked for a significant amount of time, require a large capital expenditure to be operable or have been auctioned for parts or cannibalized. These conditions make up the category, “Rigs Removed from Service.” This continues to be the largest category of deletions, with 77 rigs this year versus 99 in 2006. The number of rigs removed from service appears to be on the decline.
As worldwide markets remain strong, rigs often move out of the US into other countries. These rigs are tracked in the census each year. In the 2007 census, 14 rigs were noted as moving out of the US, the same as last year. Half of these rigs were headed to the Middle East/Persian Gulf area. Considering that 14 rigs moved out of the country this year, while just five moved in, there was a net decline of nine units resulting from rig moves, the same as last year.
Rigs that were destroyed comprise the last category for deletions. Serious mishaps can cause irreparable damage to rigs, with this year’s fleet seeing a loss of four units. This compares with last year when an active Gulf Coast hurricane season in late 2005 impacted the 2006 census by an claiming six offshore rigs.
Total rig additions numbered 614, while deletions totaled 95. The net change in the rig fleet over the past year was a 519-unit increase, showing a considerable boost in rig availability, Fig. 3.
CANADIAN FLEET CONTINUES TO EXPAND
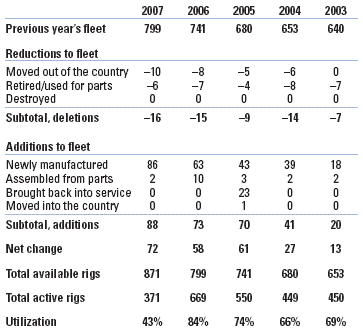
Similar to US fleet expansion, the Canadian market continues to add rigs to its burgeoning fleet. According to data provided from Nickle’s Rig Locator, in 2007 Canada’s numbers rose by 88 units through rig building alone. Last year’s overall increase was 73 units. All rigs entering the fleet for the second year in a row were either newly manufactured or assembled from components. Newly manufactured rigs numbered 86 units, compared with 63 the previous year. Rigs assembled from parts made up the remaining two rigs added. For the second year, the fact that no rigs were brought back into service leads to the conclusion that few workable rigs remain available for reactivation in Canada.
Reductions to the Canadian fleet this year numbered 16 units, with 10 rigs leaving the country and six being retired or used for parts to keep other rigs running. Subtracting these 16 units from the 88 additions leaves a net increase of 72 rigs and a total available count of 871. This is another year of unsurpassed growth for Canada, showing a second year’s overall increase of 9%, Table 2.
| TABLE 2. Changes to the Canadian rig fleet |
 |
|
GLOBAL OFFSHORE MOBILE FLEET IS STAGNANT
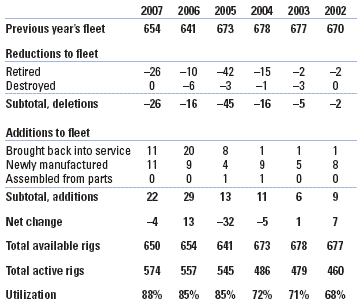
Although the global offshore mobile rig fleet experienced a significant number of additions this year, rigs removed from service offset those additions. All rigs that entered the fleet this year were either brought back into service or newly manufactured units. Reactivated rigs numbered 11, compared with 20 that were brought back into service in the previous census. Rigs that have been down for a number of years are sometimes brought out of retirement due to improved drilling conditions. Newly manufactured rigs continue to enter the market, with 11 added to the global offshore mobile fleet this year, compared with nine last year. These 11 are a small portion of what has been announced and are anticipated to enter the fleet over the next few years. ODS-Petrodata estimates that more than 150 units have been placed on order or are under construction as of this writing. No new rigs entering the fleet this year were described as “assembled from parts.”
Reductions to the global offshore mobile fleet numbered 26 this year, an increase of 10 units over last year. Twenty-six rigs were retired in 2007, versus 10 in 2006. These out-of-service rigs are considered “cold-stacked” and have not worked for more than five years. It is possible that these rigs could be put back into service in the future, but it would take time and a significant investment to do so. Therefore these rigs cannot be counted as “available” by census rules. No global offshore rigs were removed from service due to being destroyed during the past year, Table 3.
| TABLE 3. Changes to the Global Offshore Mobile Fleet |
 |
|
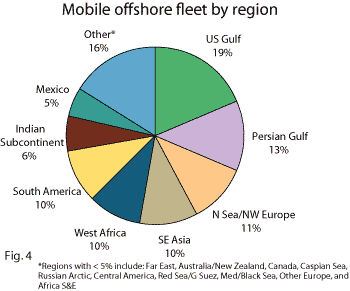
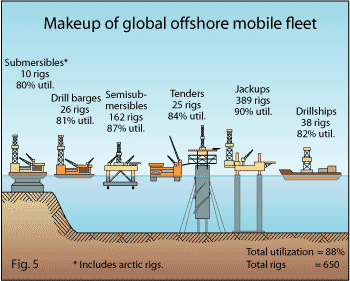
Overall, the net decrease in global offshore mobile units was four rigs, bringing the available count slightly down to 650. The worldwide offshore fleet is widely distributed with the US still dominating, followed by the Persian Gulf, then the North Sea/Northwest Europe, Fig. 4. The fleet makeup by rig type is shown in Fig. 5, but does not include platform and inland barges in the distribution.
US ACTIVITY RISES WHILE UTILIZATION DECLINES
Rig activity for the 2007 census sends mixed signals, with active rigs still increasing while utilization slumps. The active rig count climbed another 9% to 2,402 this year as overall drilling conditions remained favorable. Last year’s rigs identified as working during the census period numbered 2,200. The methodology used to count active rigs for the ReedHycalog census is different from other active weekly rig counts. The census counts a rig as active if it has “turned to the right” at any time during a defined 45-day period, (this year’s period was between May 2 and June 15). Therefore, the ReedHycalog statistic will always be higher than other reported rig counts, because a longer time period is used to monitor activity.
The 415 available rigs that were not working during the census period were classified according to the length of time they have been idle. Rigs stacked less than one year numbered 400; one to two years, 15; and two to three years, 0. Some of the rigs not actively drilling may be under contract and awaiting the start of their projects, or are being moved to their next drilling location. Census aging rules state that any rig stacked for longer than three years will be removed from the available fleet, although most rigs tend to be decommissioned for other reasons before being deleted due to their stacked condition. Rigs removed from the fleet for this reason fall into the deletions category “removed from service.”
One figure often quoted in the census is full-year utilization, which is the total percentage of available rigs that drilled at some time during the past year. Adding the 400 rigs stacked less than one year to the 2,402 active units in the census provides this number. This full-year utilization figure indicates that owners put 2,802 out of 2,817 rigs, or 99.5% of available units, to work over the past year, about the same as last year.
Examining census figures by region shows different
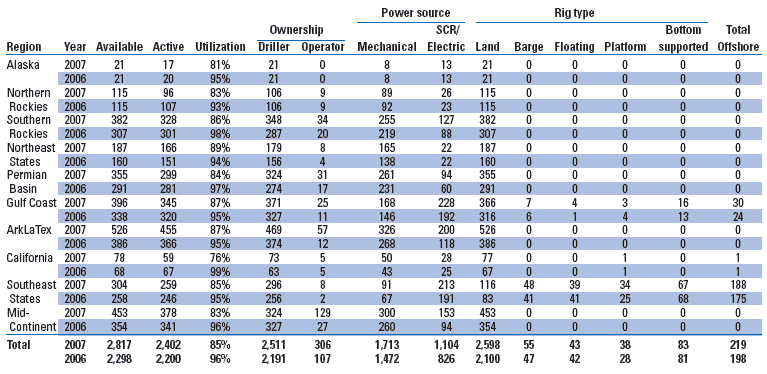
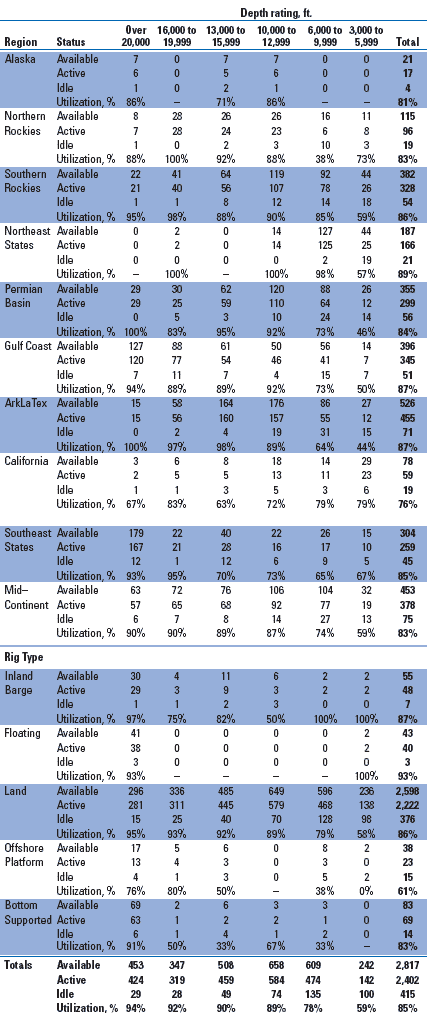
areas experiencing ups and downs in rig activity. This regional breakdown, comparing statistics for 2007 and 2006, is shown in Table 4. Again, the ArkLaTex region showed the largest increase and the highest overall number of active rigs, a total of 455 units. This is an 89-unit increase for 2007, after a 71-unit increase in 2006 and a 63-unit increase in 2005.
TABLE 4. US regional census results
Click table to enlarge
|
 |
|
Rig utilization, the supply and demand balance of rigs, is often quoted as an indicator of industry health. This ratio of active to available US rigs dipped this year, as utilization was calculated to be 85%, down from 96% in 2006. This decline can be attributed to a combination of factors including the softening of the gas market and continued additions to the available fleet.
Utilization losses were reported in every region for this census. Figures for each region are as follows:
- Alaska, 81%
- Northern Rockies, 83%
- Southern Rockies, 86%
- Northeast States, 89%
- Permian basin, 84%
- Gulf Coast, 87%
- ArkLaTex, 87%
- California, 76%
- Southeast States, 85%
- Mid-Continent, 83%.
Last year, many areas felt the effects of demand exceeding supply for some rig types. Although this remains the case in a few specific markets, utilization numbers show that all regional areas have gone from figures in the 90s to in the 80s or below, indicating that every region has some surplus capacity.
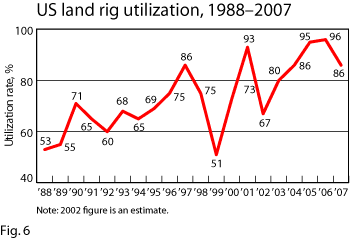
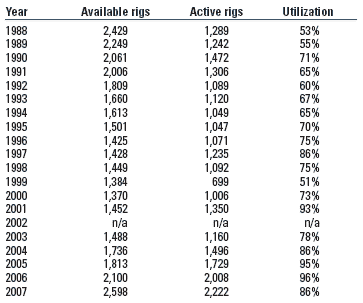
Examining US land and offshore rigs separately, gross utilization for land rigs was down 10% to 86% from 96% in 2006, Fig. 6, Table 5. The US offshore utilization ratio made an even greater decline, to 82% from 97% the previous year. Floating rigs remain in greatest demand, with 93% utilization at census time. Rigs showing the lowest utilization are the offshore platforms at 61%. Rig availability broken down by depth capacity revealed that units in all depth ranges experienced utilization drops this year. Those rigs capable of drilling from 3,000 to 5,999 ft showed the largest decline, sliding from 90% to 59%, Table 6. This is in part due to the recent weakness in coalbed methane drilling.
| TABLE 5. US land rigs, number and utilization. |
 |
|
| TABLE 6. US rig utilization by depth capacity |
 |
|
CANADIAN ACTIVITY SLOWS
Canada has experienced a marked decline in drilling activity for 2007. Most of this slowdown can be attributed to the drop in natural gas prices, and the resulting reduction in gas drilling. During the spring census period between May 2 and June 15 this year, Canada reported just 371 rigs as active. This was a 45% decline, or 298-rig drop, from the same time period in 2006. This is a significant reversal after two years in a row of 22% activity increases. The Canadian utilization rate also slid to 43% from 84% in 2006, Fig. 7.
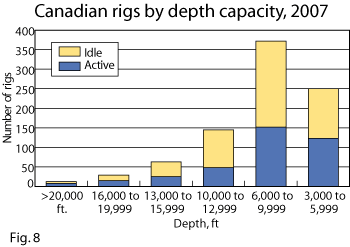
The bulk of the Canadian active and available fleet resides in the 6,000-to-9,999-ft range. Fleet availability and activity by depth capacity show that utilization remains highest in the >20,000-ft range (67%) and is now lowest in the 10,000-to-12,999-ft range (33%), Fig. 8.
INTERNATIONAL LAND RIG MARKET REMAINS ROBUST
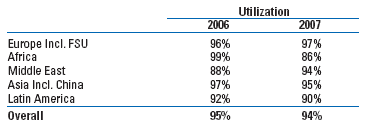
ReedHycalog has been tracking international land rig activity for the past three years and as additional statistics have become available for other countries, they have been included. Utilization rates, comparing 2007 with 2006, are shown in Table 7 for the primary international regions and a comparison between these two years has been attempted. Overall, utilization was similar to a year ago, down just one percentage point to 94% for 2007. Further explanations of differences in calculations are dealt with below.
| TABLE 7. International utilization |
 |
|
Russia and China counts were included beginning in 2006, but showed 100% utilization, which greatly increased Europe and Asia’s overall percentages when they were incorporated. Last year, Russia and the FSU added nearly 500 rigs to this count while China added over 1,100 rigs. This year’s data shows an even better picture of the Russian land market by including rigs working for non-Western companies.
Africa experienced a utilization decline primarily due to some shallow, swamp rig/barge inactivity in Nigeria because of current unrest and security issues. Otherwise, most international areas remain very tight with 90%+ utilization. This has remained steady due to the fact that many international projects are more focused on oil drilling, where prices remain high and are larger projects that span many years.
As mentioned in previous years, it has been observed that some international areas have large numbers of available rigs, but these units are typically of older technology and may not be universally mobile or marketable. Also, in some cases, available rigs are actually under contract awaiting a project start, and are realistically unavailable for other work.
MARGINAL ACTIVITY RAISES GLOBAL OFFSHORE
The global offshore mobile fleet (excluding platform and inland barge rigs) experienced a 3% rise in activity during the 2007 census period. Total working rigs numbered 574 units during the spring 45-day active period, up from 557 in 2006. With available rigs showing a four-unit decline and active rigs a slight increase, overall utilization was calculated to grow to 88% from 85%, Fig. 9.
OTHER US INDUSTRY TRENDS
As the drilling industry picked up steam over the past few years, many newly established companies have entered the arena. This year, in particular, a large number of companies were noted as having rigs counted in the census for the first time. Today the industry is back up to 310 owners with an increase of 53 companies added over the past year. Just five years ago, a low of 179 rig owners was counted, Fig. 10.
The census has always tracked rig ownership by drilling contractor versus operator, with considerably more rigs being owned by contractors. The number of rigs owned by operators, however, has been on the increase. This year’s census counted 38 operators, versus 28 in 2006. Operators now own about 11% of the overall US fleet, up from 5% in the last census. This trend of more operators drilling for themselves could begin to impact competition and rig rates if the movement continues.
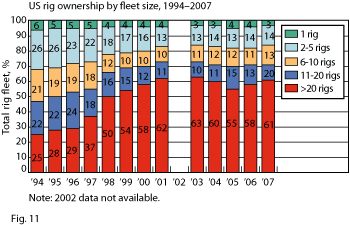
Mergers and acquisitions continue to impact the industry and many of the large companies continue to increase their rig holdings. Census statistics show that companies with more than 20 units in their fleets have made the most gains in rig possession over the past year, now owning 61% of all drilling rigs, another gain of three percentage points, Fig. 11. However, many small owners find it profitable to operate in select markets and many of the new companies counted this year have a single rig.
CONTRACTORS CONCERNED ABOUT RIG RATES
A survey of drilling contractors is conducted annually at the same time that the census statistics are being tabulated. This survey often confirms industry trends, but can also reveal interesting viewpoints regarding the state of the industry. Contractors are asked to rank some major issues of importance and estimate a number of changes to their business, both past and anticipated. Forty-four contractors participated in this year’s survey, about 14% of US rig owners, and representing 25% of the US fleet and 6% of the Canadian fleet. These companies represented a wide mix in both number of rigs owned and regional area.
For the past 17 years, respondents have been asked to rank a set of issues by importance to their business. What a difference a year makes. Last year was the first time that rig rates did not rank as one of the top three contractor concerns. This year, however, rig rates was not only in the top three, but was the number one concern. The lower utilization rate noted in the census this year indicates that the rig demand is lower and prices have suffered.
Slipping to number two this year was crew availability. This issue often ranks either number one or number two. With the influx of new rigs entering the fleet, maintaining a sustainable, skilled workforce is a constant problem for rig owners. Furthermore, hourly crew labor rates have increased an average 7% over the past year. This is a cost that continues to escalate and is especially worrisome when rig rates are not keeping up.
The third highest concern was the availability of rig parts. Contractors have been increasingly troubled by attempts to locate rig parts to keep their fleets operating. And, although a significant portion of the fleet is new, a supply of rig parts is always needed to keep the fleet in optimal condition. In addition, delays due to equipment shortages can be expensive and can even cost a company a contract if parts are not found.
Expenses for maintenance as well as labor continue to rise for contractors. On average, maintenance costs climbed another 6% this year. This is however, lower than last year’s increase of 14%, possibly due to the fact that new builds have reduced maintenance costs.
Although census results show rig activity up 9% during the census period, contractors responding to our survey told us that their rig activity has actually been down since last year, on average by 9%. Furthermore, they expect it to drop another 3% over the next year. According to survey data, land rig rates in actual dollars have averaged $14,004/day during the period May-June of this year.
When contractors were asked at what level oil and gas prices would have to drop below to have a negative effect on their business, they estimated, on average $45.70/bbl for oil and $5.20/Mcf for gas.
RIG BUILDING CONTINUES
Most contractor survey respondents feel that work will be steady and the industry will be fairly stable over the next few years. When asked to describe their company’s plans for the next five years, 43% have no plans for change, while 40% anticipate expanding their fleets. Expected additions during the next 12 months for the 44 respondents include 11 refurbished rigs and 65 newly manufactured units for the US and Canada. Other industry sources indicate that US-based contractors are expecting at least 200 more new rigs to enter the fleet over the next few years. With more rigs on the horizon and rig rates already a concern, some contractors may be correct to worry about overbuilding, especially if additional older rigs are not retired.
FURTHER US UTILIZATION DECLINE PREDICTED
New rigs are still coming, but the pace has slowed and ReedHycalog expects that fewer rigs will be added to the fleet by the time the 2008 census rolls around. It is predicted that the US available count will climb further next year, possibly by another 250 plus units. This newly larger rig fleet has never been in better shape technically. Rig activity, however is predicted to be relatively flat. Based on this forecast, the utilization rate would drop further, down to 78%. This indicates a troubling trend for contractors where the competition is stiff and rig rates are likely to decline further.
Census Ground Rules
- ReedHycalog sales regions were used for the geographical breakdown shown in Table 4 and the accompanying map.
- Contractor-owned rigs are those belonging to companies whose primary business is offering drilling contracting services.
- To be considered active, a rig must be drilling during the 15-day period in which the census is taken, or the 30 days prior to the census for a total qualification period of 45 days.
- Only workable rotary rigs are included; cable tool rigs are excluded.
- To be considered available, a rig must be able to go to work without requiring a significant capital expenditure.
- Rotary rigs stacked for an extended time, typically three years or longer, are not counted as available.
- A rig must able to, and normally employed for, drilling deeper than 3,000 ft. Therefore, some shallow drilling rigs (mostly in the Northeast) are excluded. This is necessary to ensure that well-servicing rigs are not counted.
- Electric rigs include all those that transmit power from prime movers to electrically driven equipment.
- Inland barges include barge-mounted rigs that may be moved from one location to another via canal, bayou or river and drill in sheltered inland waters. Offshore rigs include stationary platform units (both self-contained and tender-supported), bottom-supported mobile units, and floating rigs (both drill ships and semisubmersibles).

ACKNOWLEDGEMENT
The following are recognized for their contributions to this year’s rig census: Michael Wayne, RigData; Nickle’s Rig Locator; Tom Kellock, ODS-Petrodata; Trevor Brooks, Mike Critchley, Jim Elder, Kelly Hollister, Stephanie Martin, Leonora Navarre, Greg Petterson, and Doug Smith, ReedHycalog.
|
THE AUTHORS
|
|
Steve Berkman has been marketing manager for ReedHycalog since July 2004. Prior to that appointment, he served as regional sales manager in Latin America. He has been with ReedHycalog for more than 20 years, starting as a design engineer in 1982. Mr. Berkman has been all over the world with ReedHycalog in engineering and sales positions. he received a BS degree in mechanical engineering from the University of Texas in 1981.
|
|
|
Tory A. Stokes is a consultant for ReedHycalog, after being employed by the company as a senior marketing analyst for eight years. She graduated with a BS degree in applied mathematics from Texas A&M University in 1985 and earned an MBA from the University of Houston in 1993.
|
|
|


