Computational fluid dynamics simulation for smart well completions
The limitations of multi-nodal approaches are overcome by CFD modeling.
INTELLIGENT WELL COMPLETIONComputational fluid dynamics simulation for smart well completionsCFD modeling overcomes limitations of multi-nodal approaches.Jim H. Lee, ExxonMobil Upstream Research Company New methods have been advanced to process, manipulate and use real-time data from permanent downhole monitoring (PDM) systems such as fiber optic pressure, temperature and flow sensors. These interpretative methods are centered on detailed Computational Fluid Dynamics (CFD) simulations of the wellbore and surrounding near-wellbore region. In addition to facilitating the solution of geometrically complex flow dependencies, the CFD approach accounts for the highly coupled chemical physics inherent in multi-phase systems. By running the model for different anticipated production scenarios, a series of production "type curve" analogs are generated that can be used to “predict” the time-dependent flow, pressure and thermal profiles recorded by a PDM, thereby assisting interpretation of the data. BACKGROUND Continuing improvements in quality and reliability have led to increased applications of fiber optic technology for downhole sensing applications in harsh pressure and temperature environments.1 Moving beyond routine monitoring of pressure or temperature, FO sensors increasingly are being deployed as components of intelligent well completions to enable response automation or, at least, to aid actuation. For example, an FO distributed-temperature-sensing (DTS) system might be deployed in a well with commingled flow to detect changes in production (e.g., gas or water breakthrough), upon which a sliding sleeve might be exercised to shut off production from an offending zone. However, automated remote administration of intelligent wells is still plagued by several difficulties. Indeed, manual intervention and decision making for actuation of “smart” features are still required. These hurdles stem in large part from limitations in capabilities to process and interpret sensory data; although data may be recorded in real time, it is still processed as needed on an indeterministic time basis. Traditional reservoir- and well-surveillance methods rely upon surface production data and infrequent production logging trips typically performed only during shut-in or workover and on a well-by-well basis. In contrast, a burgeoning array of FO systems promises to provide continuous acquisition of sensory data during both “normal” flowing operation and shut-in. However, conventional production-logging (PLT) analysis relies on multiple types of log data�inferring flow phenomena from a combination of pressure, spinner and temperature logs.2 Consideration of all the data can be time consuming and laborious, typically introducing (and requiring) significant subjectivity in the analysis. This is especially difficult to extend to real-time FO data, particularly if only one property is measured (e.g., temperature but not pressure or rate). Although FO technology continues to advance rapidly, temperature sensing is still the primary and often single measurement recorded by FO systems. An important question that arises, then, is how to interpret FO thermal data and infer downhole flow phenomena. Inherently related is the need to predict the thermal profile under variable producing conditions. Many efforts to solve this problem have focused on using multi-nodal models.3 At each node (corresponding to a different depth), a description of the macro-structure of the well and the surrounding near-wellbore region is specified. Rock properties, fluid pressures, fluid temperatures, wellbore pressures and wellbore diameters are typically specified. Pipe-flow correlations and simple energy balances may be used between nodes to assemble the flow behavior at each node into a contiguous wellbore flow and thermal profile. The input parameters are adjusted until a match with the measured thermal profile is obtained. While the approach has the advantage of simplicity, there are several inherent assumptions that render these models inapplicable for modeling more complex wellbores. The primary assumption is that unidirectional pipe-flow correlations apply between nodes. This is appropriate for wells with single reservoir depletion and simple commingled wells with no crossflow�i.e., those cases where a radially invariant temperature and flowrate may be assumed across the wellbore at any given axial depth. Single-phase flow is often assumed. While some models account for multi-phase oil/gas/water inflows, a homogeneous mixture flow regime is often assumed, which may not be appropriate (especially for deviated wells). An energy balance accounts for radial heat transfer, but typically assumes negligible axial conductive heat transfer, which is true for simple cases. Axial heat transfer in the near-wellbore region is often ignored as well. Given the above assumptions, a reasonable match between a multi-nodal model and a measured thermal profile can be obtained through iteration for any given time. However, even these simplified models cannot guarantee a unique solution. This limitation is especially important in wellbores with complex flow patterns, where a match at any single time interval may not result in a match at a later time interval if the true physical couplings between the reservoir and wellbore are not honored but only approximated. Thus, non-uniqueness, the sensitivity of the thermal profile to even small changes in production, and data uncertainties in the formation and reservoir may severely limit the multi-nodal approach in predicting the thermal profile. APPROACH ExxonMobil developed a work process to evaluate the pressure, temperature and flow characteristics in complex well completions by modeling the entire completion interval in detail, including the inner wellbore instrumentation and the surrounding near-wellbore region, by discretization into a 2D or 3D computer model. The resulting mesh may include valves or tubing geometry that result in countercurrent flow between the annulus and tubing. The full set of Navier-Stokes equations of fluid dynamics (which nodal correlations only approximate) can then be solved in each cell of the mesh. The energy equations account for convective and conductive heat transfer both radially and axially in both the wellbore and near-wellbore region. In addition to complex geometric flow dependencies, the computational fluid dynamics approach facilitates solution of the highly coupled physics present in multi-phase systems, particularly gas compressibility, which affects heat transfer and, in turn, the thermal profile in the wellbore. In the near-wellbore region, true reservoir permeabilities and porosities are honored and used to populate the model. Running the CFD model for different anticipated production scenarios generates a series of type-curve analogs, which can be used to predict the time-dependent pressure, thermal and flow profiles recorded by an FO system. These profiles can reduce the time required for post-measurement analysis of real-time data. They also can assess the utility of a thermal sensor in light of anticipated reservoir and wellbore behavior. Multi-nodal approaches often center on taking measured flow or thermal profiles and matching the profiles through adjustment of a plurality of wellbore and reservoir parameters. This “inverse modeling” approach is well-suited to a service company, which may have limited access to reservoir or formation data. In contrast, an operating company may have well-developed characterizations of fluid and reservoir properties; these can and should be used to constrain the input parameters of any wellbore inflow model. Thus, the CFD-based methodology is characterized by a heavy emphasis on “forward modeling,” wherein the input data is specified first to predictively assess the form of a flow, pressure or thermal profile. Linked to a reservoir simulator, the effect of field depletion on fluid properties and wellbore drawdown can be predictively assessed, with flow, pressure and thermal wellbore profiles contrasted through time. Another important distinction of this work process is its applicability to extremely complex completions, such as those with commingled flows or countercurrent flows in the tubing and annulus. While other methods are adequate for simple completions (e.g., single contributing inflow zone with unidirectional flow), they may fail when applied to systems where flow and thermal profiles exhibit significant radial variation within the wellbore. These variations can result from wellbore crossflow, unique flow patterns around valves, chokes, sleeves and other downhole instrumentation, or from countercurrent heat exchange between the tubing and annulus. The CFD approach provides a numerical solution to the full set of Navier-Stokes equations of fluid dynamics, which characterize the flow behavior exactly. Computationally expensive, CFD methods have most often been applied to short-length scale studies such as flow around a valve or foil, or attachment and detachment of turbulent eddies to walls. Simply, CFD methods are not an intuitive choice for the long asymmetry of deep wells, because extensive computational resources are still required despite the exponential growth of computational power. The concept of coupling a porous media model of the reservoir to a wellbore model wherein the full Navier-Stokes equations are solved is a novelty of the present work. PROCEDURE The work process is illustrated in Fig. 1. A computer model of the wellbore geometry is first created based on a well schematic or completion design. The computer model typically includes both the macro-scale geometry of the casing and tubing dimensions and the details of the downhole instrumentation, such as packers, mandrels, valves, control lines and perforations. The geometrical computer model is then discretized and meshed at a resolution fine enough to capture the details of the flow profile. The level of resolution may vary from several feet of tubing in the axial direction to a few inches or less around perforations, valves and orifices where turbulent eddies may be expected to affect the local flow characteristics or induce pressure losses. The surrounding near-wellbore region is modeled as a porous medium with a radial extent ranging from a few feet to hundreds of feet as required.
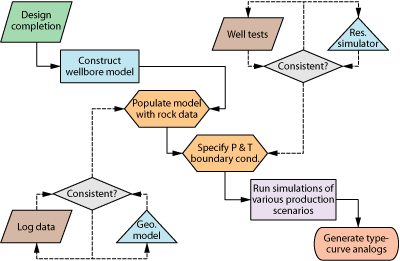
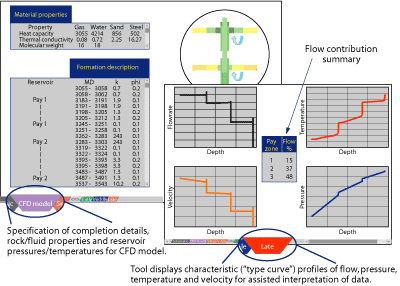
Creation and solution of a CFD model of the wellbore and surrounding near-wellbore region may be accomplished through the use of in-house or commercially available codes and algorithms for solving the Navier-Stokes equations. Here, ExxonMobil can leverage proprietary solver algorithms for coupled nonlinear equations. Furthermore, historical visualization and mesh-creation hurdles have been mitigated by development of graphical user interfaces for pre-processing and computer-aided design software that, together, partially automate mesh creation for CFD applications. Any of these CAD/CFD software packages is sufficient to replicate the inner instrumentation of the wellbore. Although computational power limitations are mitigated by advances in processor technology, numerical solution of the Navier-Stokes equations over the long length scales of completion intervals (hundreds to thousands of feet) still requires access to significant computational resources. In populating the near-wellbore region of the CFD model, input properties for the porous medium are derived from geological characterization of log data. In the absence of log data, well test data can be used, albeit with some loss of resolution. In either case, the ability to populate each cell of the CFD model with permeability, porosity and conductivity data enables heterogeneities in the data and their impact on flow to be honored. Reservoir pay zones are defined in the near-wellbore region. For sandstone formations, shale layers can be explicitly modeled as impermeable flow boundaries�axial heat transfer is still allowed. Varying degrees of formation connectivity may be specified for carbonates. Fluid pressure, temperature and compositional boundary conditions are specified for each pay zone at the radial extent of the near-wellbore region. These may be specified with simple linearized functions or with more complicated depth-correlated relationships, depending on the reservoir. The pressure and temperature boundary conditions may also be updated from a reservoir simulator to account for changes in production with time. Fluid compositions are varied to match the evolution in gas-oil ratio and watercut with production changes such as coning or waterflood encroachment. Using available rock and reservoir data to constrain the input values into the model provides a significant advantage for applying the CFD model predictively through time. Reservoir simulations provide an expectation of reservoir performance that can be correlated with well performance to support the model results. Preferably deployed as representative “type curves,” forward modeling forecasts of wellbore flow, pressure and thermal profiles arm operations staff with an understanding of the production profile’s likely evolution. Having even a qualitative understanding of how the shape of the flow, pressure or thermal profile correlates with anticipated production scenarios circumvents the potentially time-consuming process of post-measurement data analysis. This can potentially generate major response-time reductions in the field; an inverse-modeling approach first requires acquisition of data, then lag-time for interpretation. Iterative discussions between operating and service companies may follow before a response to a critical change in production scenario is agreed upon and executed (e.g., determining that a change in the thermal profile is due to water onset and deciding to exercise a sliding sleeve to shut off water production from a specific zone). If, however, a measured pressure, thermal or flow profile is anticipated by a characteristic type-curve analog, even a rough on-site correlation may prove sufficient to progress an operating decision. Optimally, these two approaches will complement each other to provide best-in-class well performance with minimal downtime. APPLICATION Despite the complexity of creating advanced CFD models to capture the underlying physics of the reservoir and wellbore, the results of the simulations may be deployed quite easily. At the simplest level, flowrate, pressure or thermal type-curve analogs may be generated for various unique production scenarios to establish baselines for comparison. These curves may be graphically tabulated or correlated to different production events. As an example, three different thermal profiles might be generated to represent “early,” “middle,” and “late” life corresponding to low-pressure drawdown, high-pressure drawdown and high-pressure drawdown with water incursion (multi-phase flow dynamics), Fig. 2.
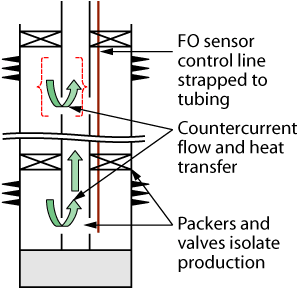
One application of the above scenario is the characterization of the thermal profile of a wellbore in which countercurrent flow down an annulus and up through tubing results in radial heat transfer across the tubing, Fig. 3. A nodal approach is not amenable to analysis of the radial temperature distribution across the wellbore because the localized heat transfer coefficient varies with flowrate, time and location. Therefore, countercurrent heat exchange can render interpretation of a fiber optic temperature sensor extremely difficult.
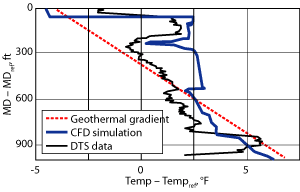
To further complicate matters, the gas well under discussion is produced from more than nine non-communicating reservoirs with separate gas-water contacts. Packers were used to segregate the production zones into three pools. Each pool flows down into an annulus and then through a controllable valve before commingling with fluid from below and flowing up through tubing to surface. To simulate thermal profiles, a CFD model was created encompassing 1,800 ft of the wellbore in the completion interval. The downhole inflow valves and packers were modeled at design depths, and the perforated intervals were modeled on an openhole basis, recognizing the need to revise the model after the completion was run. Formation properties and reservoir pressures were extracted from reservoir simulations for early-, middle- and late-life production. Late-life production was defined as the onset of water production. An assumed geothermal gradient from a temperature survey was used as the temperature boundary condition. The chief concern in any computational simulation is obtaining a converged solution. In this case, the complex flow and heat transfer induced by the downhole instrumentation is complicated by multi-phasic interactions among the gas, condensate and water. Using a single-phase mixture with a single set of averaged bulk properties may prove unsatisfactory since the intended purpose of the planned FO DTS system is to monitor thermally for the onset of water production. Because the temperature profile is dependent on the contrast in thermal properties between water and hydrocarbon, explicit modeling of the condensate was ignored and a water-gas system was modeled in this preliminary work. For the cases of early and mid-life production when water is not present, single-phase gas simulations were performed. Solution of the Navier-Stokes and energy equations provided a quantitative characterization of the pressure, temperature and velocity profiles within the wellbore. Fiber optic DTS is typically strapped to the tubing; profile contours were compiled at different radial positions within the wellbore to examine the impact of fiber placement. In addition to anticipating changes in the thermal profile over the entire completion interval, the simulations demonstrated that water breakthrough in lower zones could impact flowrates in upper zones because of changes in fluid density and wellbore hydraulics. These results can be used to better design completions and optimize fiber placement outside the tubing if needed. Work on the well under discussion is still ongoing, with the completion having been run and fiber optic data now becoming available for comparison. After reconstructing the mesh to mirror final perforation intervals and instrumentation depths as installed, the initial results of the CFD wellbore simulations match trends in the thermal profile very well, Fig. 4.
These results reflect no further adjustment of the CFD model beyond the geometrical restructuring noted above. The strong match prior to further model refinement suggests that the physical couplings between the reservoir and near-wellbore region are indeed honored. Interestingly, the thermal profile contours beyond the DTS within the annulus vary widely in range and have provided additional insights into the evolution of the thermal profile. Although the example above pertains specifically to analysis of fiber optic thermal data, the general applicability of the approach is far greater since the transport equations are solved in addition to the energy equation; flow and pressure profiles are also fully determined. Ultimately, as confidence in a match between simulation and measured data improves, CFD simulation results could be used to allocate zonal contributions to flow. Furthermore, preliminary work on fully transient simulations shows promise in facilitating evaluation of short-term flow conditions such as those resulting from stimulation and cleanup operations.4 CONCLUSIONS Holistic CFD modeling of the wellbore and near-wellbore region is a powerful tool for evaluating complex flow paths and heat transfer. Axial and radial dependencies can be probed to optimize design, and sensitivities can be run to forecast the effect of production changes. Improvements in both speed and grid resolution will drive application in the design of new wells and production history matching of existing wells. The realization that interpretation typically lags measurement will become an important challenge in real-time asset management, where high data sampling frequency and automated response are the goals. Deployment of CFD simulation results as type-curve analogs holds promise in facilitating rapid responses to changes in well production, while reducing post-measurement analysis time to a minimum. Of particular value where FO sensors are increasingly likely to be deployed, the work process offers a means to evaluate pressure, temperature and flow profiles within the wellbore to assist interpretation.
|
||||||||||||||||||||||
- Coiled tubing drilling’s role in the energy transition (March 2024)
- Using data to create new completion efficiencies (February 2024)
- Digital tool kit enhances real-time decision-making to improve drilling efficiency and performance (February 2024)
- E&P outside the U.S. maintains a disciplined pace (February 2024)
- U.S. operators reduce activity as crude prices plunge (February 2024)
- Drilling advances (January 2024)
- Applying ultra-deep LWD resistivity technology successfully in a SAGD operation (May 2019)
- Adoption of wireless intelligent completions advances (May 2019)
- Majors double down as takeaway crunch eases (April 2019)
- What’s new in well logging and formation evaluation (April 2019)
- Qualification of a 20,000-psi subsea BOP: A collaborative approach (February 2019)
- ConocoPhillips’ Greg Leveille sees rapid trajectory of technical advancement continuing (February 2019)


