DEEPWATER TECHNOLOGY
Acquiring low-contamination samples in high-differential-pressure reservoirs
Eni optimized overbalance and adjusted mud properties to stabilize a GOM wellbore, reducing sample acquisition time and rig cost.
Charles Russell and Nicola Luise, Eni Petroleum; Jaedong Lee, ProductionQuest and Harry Dearing, NewPark Drilling Fluids
Eni Petroleum saved over half of the rig cost by reducing the time to collect a clean sample from 5 hr to less than 2 ½ hr. This was achieved by minimizing invasion, plugging the near-wellbore pore space with a special mud, and optically monitoring the sample cleanup in real time.
Filtrate contamination from Synthetic-Based Mud (SBM) systems tends to obscure and influence several properties of the reservoir fluid characterization analysis. Contaminated PVT samples require correction for reliable test results. The flow assurance samples had to be as clean as possible to obtain reliable analysis, typically less than 10% contamination.1
Downhole optical sensors have been used to distinguish mud filtrate from formation oil and to estimate the contamination percentage while pumping.2, 3 Sample quality is a function of several factors including mud cake quality, time after drilling and overbalance.4 High overbalance induces more filtrate invasion and makes quality samples difficult to obtain.
Eni drilled four wells with different degrees of overbalance and encountered many formation evaluation challenges. Obtaining high-quality formation pressure tests and formation samples with low-SBM contamination was the most difficult. Although managing drilling parameters ensured good casing shoe integrity and borehole stability, optimized drilling conditions did not necessarily equal successful formation evaluation. The major problem with subsurface data acquisition was the hydrostatic pressure overbalance required.
A total of 40 samples was attempted with mixed success. SBM filtrate contamination ranged from 1.9% to 43.5%. The maximum pump-out time for one sample depth was 5 hr. The maximum reservoir fluid volume pumped out for cleanup was 139 liters.
DRILLING FLUIDS
Newpark Drilling Fluids provided the SBM, CyberDrill, for this appraisal drilling campaign. Some fluid property requirements for drilling the entire reservoir sections were High Pressure, High Temperature (HPHT) filtrate of less than 2.0 ml/30 min. and Electrical Stability (ES) greater than 600 V. These requirements were developed based on the high differential pressures encountered and a desire for fluid stability above standard. Typical requirements for SBM fluids vary, but HPHT filtrates of 4�6 ml/30 min. and ES of 350�500 V are more common.
FORMATION EVALUATION
Baker Atlas provided formation evaluation on all four wells using the Reservoir Characterization Instrument. Pre-job planning indicated that drill pipe conveyance should be used for formation evaluation. Most of the evaluations were made by drill pipe conveyance. The last wellbore drilled was logged by wireline using the capstan.
The formation tester was equipped with SampleView v. IA, a module for downhole fluids characterization. This module is a visible and near-infrared spectrum fluid analyzer, with 17 optical absorption channels. The first 12 optical channels, covering 425�1,069 nm wavelengths, are closely spaced over the highly absorbing asphaltene region, which is used to monitor contamination. During sample acquisition, the fluid’s optical properties are monitored continuously.
When optical properties stabilize, the sample has reached its minimum filtrate contamination. At that point, the pumped fluid can be diverted to a sample collection tank. For SBM, the filtrate is miscible with formation hydrocarbons. There is little resistivity or dielectric contrast between SBM filtrates and formation fluids. However, there is considerable contrast using optical sensors.
The asphaltenes present in crude oils provide a characteristic reddish-brown color. SBM base hydrocarbons contain no asphaltenes and have no visible color. However, fluid loss additives and emulsifiers can add some brown color to the filtrate. During drilling, muds often acquire some color from asphaltenes in the drilled zones. Nevertheless, the mud filtrate is rarely as dark as the native crude, unless it is very light oil. This color difference is the basis for real-time, cleanup monitoring during fluid pumping through the sampling tool.
The formation evaluation program consisted of LWD gamma ray, resistivity, bi-modal acoustic and density. Wireline logging included high-resolution resistivity, horizontal and vertical resistivity, spectral gamma ray, density, neutron, crossed-dipole sonic, formation images, nuclear magnetic resonance, sidewall cores, and formation pressures and samples. Formation pressure data and fluid samples with low-SBM filtrate contamination were crucial for project sanction. The goal was to acquire clean formation samples in the hydrocarbon-bearing reservoirs for flow assurance and PVT analysis.
PRESSURE DIFFERENTIALS
The first well’s plan called for drilling the 9 7/8-in. hole section from about 21,000 to 26,000 ft MD with mud weights from 13 to 13.8 ppg. Actual mud weights required were 10.8 to 15.1 ppg. This section had a fracture gradient of 16.8 ppg equivalent mud weight, and the mud properties included HPHT fluid loss from 1.6 to 2.8 cc and ES greater than 500 V.
The large overbalance in the first two wells was due to the casing point. The shales below the salt were high pressure (15.0−15.5 ppge). This section also had high-pressure, thin, low-volume gas sands. High-pressure shales with the gas sands required a high mud weight to drill the wells.
The reservoir sands occurred at two depth ranges. The shallower, thick, clean reservoir sands had very low pore pressures (10.1 ppge), Fig. 1. This contrast resulted in overpressures of 5,600 psi or 5 ppge. The deeper reservoir sands had less overbalance with pressures of about 1,575 psi or 1.8 ppge.
 |
Fig. 1. The large differential in the wells drilled resulted in overpressures of 5,600 psi or 5 ppge.
|
|
The first two wells cut hydrocarbon-bearing sands and defined the lowest pore pressure on the plot. A complete pressure profile in this sand was not possible, due to the maximum overbalance limitations of the formation tester and the high overbalance condition in the wellbore. In subsequent wellbores, casing seat selections were revised and mud densities reduced to decrease the overbalance. These differential pressures were about 2,614 psi or 2.1 ppge. However, this magnitude of ∆P was still substantial, and still caused problems with pressure and sample acquisition. The fourth wellbore had an overbalanced pressure of 1,575 psi or 1.8 ppge.
The first logging attempt was made on wireline. After logging from TD, the wireline became stuck. Overbalance caused cable-sticking across the massive sands. The wireline and tools were recovered, but the remaining evaluation used pipe-conveyed logging.
A large number of pressure and sampling attempts were made in the first wellbore. Of the 126 pressure tests attempted, 27 were unsuccessful. The large pressure overbalance was greater than the tool’s maximum pressure differential of 6,000 psi or 4.8 ppge. After pulling out of the hole, tool examination revealed a greatly worn packer/probe section; the packer material was ripped off the probe. Differential pressure pulled on the packer after each pressure and sampling set, Fig. 2.
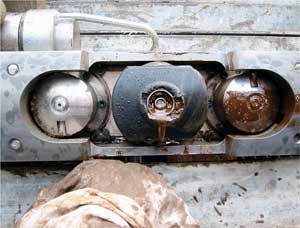 |
Fig. 2. The packer/probe section shows damage from differential pressure exceeding 2,000 psi.
|
|
SAMPLE ACQUISITION
In Well 1,the formation tester was configured with four, six-tank carriers for 24 samples. Three tank carriers had 840-cc PVT-sample chambers, and the other three had 450-cc, single-phase chambers. The single-phase chambers are equipped with a nitrogen charge to compensate for pressure reduction from temperature decrease during tool retrieval. Eighteen samples were attempted at seven depths before stopping, due to lost seals. The rubber packer was destroyed from the high-pressure differential as it pulled off the sand face 126 times. Three samples were recovered at the surface, but several samples were lost, due to the extreme differential pressure. The maximum pressure differential was about 6,080 psi.
Recovered samples were transferred at the surface. Contamination was greater than 10% for all three chambers, and sample quality did not improve with additional pumping. In this high-overbalance situation, additional pumping may not result in better quality samples, due to filtrate invasion.
Well 2. The planned mud weight for drilling the 8½ in. section ranged from 14�14.5 ppg. The mud weight required to drill ranged from 14.8�15.1 ppg. ES ranged from 327�674 V. In this wellbore, engineers attempted 46 pressure tests and five sample attempts. Seven pressure tests were in the tight zones, and the seal was lost twice. The maximum pressure differential was 2,183 psi. The formation tester was configured for three, six-tank carriers with twelve 840-cc, PVT-sample chambers and six 450-cc, single-phase chambers conveyed on drill pipe. Eight samples were attempted at four depths.
Three samples (two 840-cc and one 450-cc) were taken in a gas reservoir with 3.6% SBM contamination against a 2,188-psi differential pressure. About 27 liters were pumped out over a 118-min. period.
One water sample was obtained from another depth after 13 l were pumped in 28 min., Fig. 3. This chart has different characteristics with two distinctive peaks in channels 14 and 17, indicating that the flowing fluid is mostly water.
 |
Fig. 3. Spectral responses for a water sample from the second wellbore, showing peaks on channels 14 and 17.
|
|
The last four samples were attempted in two additional reservoirs. About 20 l were pumped over 50-min., and the SBM contamination was from 18.0−29.9%. The pressure differential was less than 1,144 psi. The optical densities showed an increasing trend, indicating further pumping could have yielded a better quality sample.
Further pumping does not guarantee samples with less than 10% contamination. In general, after pumping for a very long time (24 hr), the well reaches a “terminal” sample quality that will barely improve with continued pumping. This quality is not 100% purity, but it is the best that can be obtained.
To estimate sample quality, the module’s forecast algorithm was applied; it suggested that the sample was about 6% below the terminal sample quality. This indicated that invasion was too high to obtain a relatively clean sample.
Well 3. An FIT of 15.5 ppg EMW was obtained at the 9.875�in. shoe. This section from 24,900�27,340 ft MD was drilled with 12.0 ppg mud. Tight emulsion properties were maintained with HPHT less than 2 cc and ES from 325 V in the shallow section to 800 V in the deeper section. Prior to drilling the deeper reservoirs, the mud was treated with 8.5�9 lb/bbl of fine CaCO3.
Several procedures were modified to optimize formation sampling operations. The strategy for this wellbore included casing point optimization, allowing the reservoirs to be drilled with a lower mud weight. In the deeper reservoir, the mud was treated with CaCO3 sweeps. Sampling acquisition strategy consisted of longer pump-out times and pumping more volume at each sample depth. In the most critical reservoir, the pump-out time was 5 hr and 139 liters.
There were two separate runs. For the first, the tester was configured for three six-tank carriers, consisting of twelve 840-cc, PVT-sample chambers and six 450-cc, single-phase chambers on wireline. Eighteen samples were attempted at six depths. Twelve samples were taken in five different depths with differential pressures of 1,486−1,564 psi. Contaminations were 9−11% at four depths and one at 26%. The responses in Fig. 4 show a higher rate of change (still cleaning up). The module’s algorithm indicated that the sample was about 16% below the terminal sample quality. At another depth, six sample tanks were filled after pumping out 60 l of fluid for 2.5 hr, with differential pressure of 2,485 psi and contamination of 32.7%.
 |
Fig. 4. Temporal responses based on two channel differences from a sampling attempt in the third wellbore (run 1), 25.7% contamination after 40 liters were pumped out.
|
|
The plots show the differences in two channels. Using channel differences helps to remove any baseline offset caused by light scattering off passing particulates or bubbles that makes all channels look darker and raises the baseline. Channel differences also enhance the sample’s absorbance vs. wavelength. The plots show responses over 15 min. (10 min. before sampling and 5 min. after sampling).
For the second run, the tester was configured with one six-tank carrier, having six 840-cc, PVT-sample chambers, on wireline. Six sample tanks were filled after pumping out 106 l of fluid over 4 hr. The differential pressure was 2,485 psi, and the average SBM contamination was 27.0%.
Well 4. This well was designed as a bypass to core. The bypass was kicked-off and drilled to the first core point depth with 11.0 ppg mud. The hole was circulated, and a 450-bbl CaCO3 pill was built at 33 lb/bbl. The pill was placed in the drillstring and a conventional core was taken. This section was drilled and cored with HPHT water losses from 1.2−2.0 cc and ES of 550�650 V.
The sampling was to obtain clean oil, following the procedures used for Well 3. Reservoir fluid samples were obtained as soon as possible after cutting the core, using long pump-out time and volume for each sample depth, and placing the probe below shale laminations to limit vertical filtrate inflow.
The formation tester was configured with one six-tank carrier, having six 840-cc, PVT-sample chambers, on wireline. Six tanks were filled after pumping out 100 l of fluid for 3.5 hr. The differential pressure was 1,450 psi, and the average contamination was less than 5% after 30 min., Fig. 5.
 |
Fig. 5. Temporal response based on two channel differences from a sample attempt in the fourth wellbore. Contamination is less than 2 % after 101 liters of pump-out.
|
|
The temporal plot shows sample quality was satisfactory after 25 l of pumping. The difference of optical densities after 25-l and 100-l pumping is merely 0.1, which is about 3.8% contamination improvement.
RESULTS
Forty formation samples were attempted in the four wellbores. The goal was to obtain high-quality PVT samples for hydrocarbon characterization and flow assurance determination. The targeted sample contamination was less than 10%. Notice on the plot that some of the samples were highly contaminated, even after high fluid volumes were pumped out of the formation, Fig. 6.
 |
Fig. 6. Sample contamination versus pump-out time for all samples attempted in the four wellbores.
|
|
Some of the samples with longer pump-out times resulted in discouragingly high contamination. The samples from Well 2 are gas and had good cleanup with less than 5% sample contamination.
These plots show that there is no clear relationship between the pump-out time and pump-out volume, versus the sample cutoff quality. Here the sample cutoff quality is the minimum desired contamination level in the sample. The results show that longer pump-out time and more pump-out volume can lower the contamination level, but they do not result in satisfactorily clean samples. The message implied is that the target formation should be under the right condition�with a shallow invasion depth.
Due to the extremely high pressure differential of the reservoir sands, pressure and sample acquisition were challenging. After trying several different techniques, clean formation samples were recovered at the surface and analyzed, Fig. 7.
 |
Fig. 7. Plot of volume pumped versus sample contamination on the last sampling attempt in the fourth wellbore.
|
|
All the best practice techniques for obtaining a clean sample were applied on this attempt. The hydrostatic pressure differential was reduced, with 1,574-psi differential and 38.4% SBM contamination after pumping out 0.5 l. Samples were taken after pumping out 50 l, 75 l and 100 l, with sample contamination of 4.0%, 2.7% and 1.8% respectively, Fig. 8.
 |
Fig. 8. Plot of pump-out time versus sample contamination on the last sampling attempt in the fourth wellbore.
|
|
After pumping 30 min., a sample was obtained with contamination less than 5%. After pumping for 210 min. and 100 liters, a sample was acquired with 1.8% contamination. This shows that when the filtrate invasion is small (a relatively clean sample with very small pump-out volume), the sample improves with further pump-out, and the sample quality can be almost contamination free.
After all the methodologies were implemented, a clean sample was obtained after pumping for only 30 min., Table 1. After pumping for 30 min. and a volume of 50 l, sample contamination was 4.0%. After pumping 100 l over 210 min., contamination was 1.8%.
| TABLE 1. Pumped fluid volumes and laboratory-measured sample contamination with their associated costs. |
 |
|
The old standard of pumping a certain volume or for a given time resulted in much greater costs than necessary. This table shows that a clean sample was obtained after pumping for 30 min. Based on a $70,000/d rig rate, rig cost was about $4,167, compared to pumping 210 min. for $30,556. At current rig rates, the costs for 210 min. are $47,396. According to the data, if the module was used to determine when a clean sample was acquired, the company could realize great savings.
Several milestones were reached in these four wellbores. Eni deployed the largest number of sample tanks run at one time (24 tanks, each 840 cc). The crew successfully took pressure measurements in the highest overbalance conditions, had the best pressure test/gradient accuracy and performed real-time formation rate analysis on raw pressure test data.
CONCLUSIONS
After testing several different procedures, Eni obtained clean formation fluid samples from subsalt, deepwater GOM wells. Deep invasion of mud filtrate induced by high overbalance initially hindered sampling. The knowledge gained after drilling the first two wellbores was applied to obtaining clean formation samples and good-quality formation pressure data. The overbalance was optimized, and the mud properties were adjusted to plug the pore space in near wellbore formation for a stable wellbore with minimal filtration. Reduced sample acquisition time resulted in substantial rig-cost savings. 
ACKNOWLEDGEMENT
The authors thank Eni Petroleum and Baker Atlas managements for permission to publish. Special thanks to R. Perry and R. Robinson of Baker Atlas for their diligence in the pursuit of high quality formation pressures under adverse conditions. The authors thank Steve Daniels and Rocco DiFoggio for reviewing this material.
LITERATURE CITED
1 Lee, J., J. Michaels and R. DiFoggio, “PV tests for bubble-point pressure and quality control,” presented at the 2003 SPWLA annual symposium, Galveston, Texas, June 2006.
2 Shammai, M., A. Shaw, D. DiFoggio, B. Gordon, K. Ferworn and J. Ford, “Improving formation sampling and testing efficiency�Tomorrow’s
in-situ PVT laboratory,” presented at 14th Annual Deep Offshore Technology International Conference, Nov. 13-15, 2002.
3 Hashem, M. and G. Ugueto, “Wireline formation testers: Uses beyond pressures and fluid samples�A viable replacement of production
tests,” presented at the 43rd SPWLA symposium, June 2-5, 2002.
4 Sarkar, A. K., J. Lee, and E. Kasap, “Adverse effects of poor mudcake quality: A supercharging and fluid sampling study,” SPE REE, June 2000, vol. 3, no.3, pp. 256-262.
|
THE AUTHORS
|
|
Charles L. Russell earned a BS degree from Midwestern State University with post-baccalaureate studies at University of Houston. He has over 25 years of experience with service and oil companies. Mr. Russell has co-authored technical papers and served on four wireline advisory boards. He is subsurface manager at Eni Petroleum in Houston, responsible for formation evaluation, wireline and LWD, conventional coring, petrophysics, and reservoir pressure and fluid acquisition for GOM and Alaska.
|
|
| |
Nicola Luise earned a BS degree in geology from the University of Florence in Italy. He has worked as a data engineer in Italy, Libya and the North Sea, as a geological specialist for Eni in Italy and as senior operations geologist for the company in the GOM before becoming a senior geologist working in Alaska Exploration.
|
|
| |
Jaedong Lee earned BS and MS degrees in petroleum and mineral engineering from Seoul National University and a PhD degree in petroleum engineering from the University of Tulsa. He has analyzed wireline formation tests and formation fluid sampling, and developed near-wellbore simulators. Lee is a reservoir engineering manager at ProductionQuest, a Baker Hughes company. He serves as an SPE technical editor and associate editor of Petrophysics for SPWLA.
|
|
| |
Harry Dearing earned a BS degree with honors in engineering from the University of Texas. Prior to joining Newpark Drilling Fluids, he worked for a large service company, a drilling consulting company and a major energy company. Dearing is vice president, Technology, for Newpark Drilling Fluids, LLC., with responsibilities for research, product development, technical services and training.
|
|
|


