Deepwater
Technology
Multiphase and wet gas metering provide a
low-capex solution
Combining virtual and physical meters provides wider control
of flowline networks for deepwater fields.
�ge Rasmussen, FMC Technologies, Kongsberg, Norway
The
benefits of metering the contribution from each well in a field may,
in general, be quantified by how efficiently the production system
is utilized at any point in time, and ultimately by the overall field
recovery factor. Recent studies by Statoil, Hydro and the Norwegian
Petroleum Directorate (NPD) show a 15% to 20% difference in recovery
factor from subsea to platform wells. 1, 2 Multiphase and wet gas metering
play an important role in closing this gap.
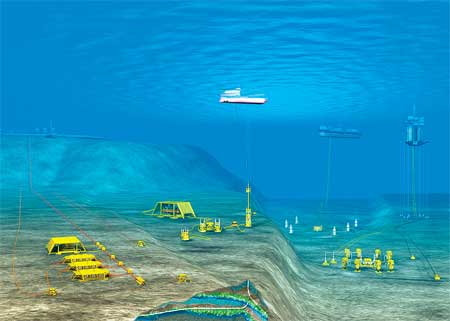
More and more offshore field developments, particularly in deep water,
are opting for a solution, where a large number of wells are tied back
to a limited number of flowlines, since this will provide the lowest
capex solution, Fig. 1. To add to the complexity, artificial lift may
be provided through a limited number of gas lift lines, or by a limited
number of booster or multiphase pumps. All these elements contribute
to increasing the number of variables to be optimized simultaneously,
which leads to an increase in the overall complexity of the production
optimizations. The basis for performing day-to-day production optimization
is having an accurate model of the full-flowing network, and accurate
measurements of current flowrates and flowing conditions at any point
in the flowing network. A combination of physical and virtual metering
may provide accurate metering and updated models, in addition to the
capability of performing short- and long-term optimization within the
same framework.
 |
|
Fig. 1. Various subsea and platform-based field layouts. |
|
MOTIVATION
As developments move toward deeper water, the previously identified
issues become even more pronounced. Due to increasing cost and complexity
of operations with increasing depth, the potential benefit increases
proportionally, whereas the initial investment in an overall metering
and optimization system remains almost unchanged.
Enhanced potential through targeted
interventions. As stated above,
Statoil, Hydro and NPD have found an average difference in overall
recovery factor, between 15% and 20%, for a field completed with subsea
wells compared to a field with dry wellheads on a platform. 1, 2 For
deepwater developments, it is anticipated that the average recovery
factor will decrease as a function of water depth. 3 Obviously, the
main reason behind the decrease in recovery factor is the added cost
and complexity of performing interventions on subsea wells, factors
that are accentuated even further for deepwater developments. Improvements
in multiphase or wet gas measurement capabilities will not affect the
cost of subsea interventions. These improvements will, however, enable
the operator to target the correct wells. Increasing the amount of
information available from each well will enable the operators to target
the correct wells, and to ensure that the correct intervention type
is performed. Together with developing technologies such as light well
interventions, quality flowrate measurements may contribute to increasing
the recovery factor from subsea and deepwater production systems.
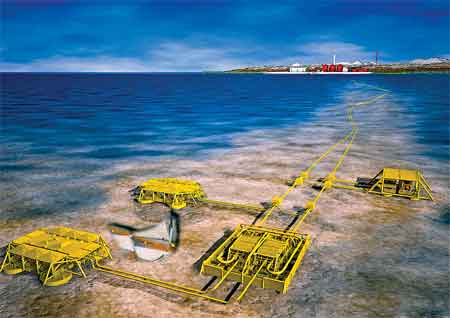
Enhanced potential through production
optimization. To add production
capacity to existing facilities, or to develop fields at a minimum
investment, we are seeing a trend toward more complex field layouts,
Fig. 2. A typical manifold layout for a subsea development may be seen
as a 4-or-6-slot manifold tied back to the production facility through
one or two flowlines. To expand this layout at a minimal cost, it is
much cheaper to daisy chain a second manifold on the back of an existing
one, than to include a second stand-alone manifold with separate flowlines.
For a new field, a two-manifold daisy chain configuration reduces the
necessary number of flowlines and risers.
 |
|
Fig. 2. Increasingly complex subsea layouts are required by fiscal realities. |
|
Obviously, the flowline and riser sizes will increase, but the flexibility
of such a configuration will only be moderately reduced compared to
the two-manifold/four-riser option. This solution's drawback is the
added complexity of producing through the networks. Taking into consideration
the need for artificial lift, either as gas lift or through boosting
or multiphase pumping, the complexity of optimizing production increases
significantly. The potential benefit from accurate measurements of
production from each well increases significantly with the geometry's
complexity.
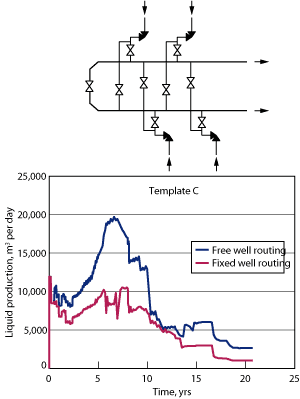
Figure 3 shows an illustration based on production profiles from the
Troll B field. The figure shows the difference between best-case flexible
routing (blue line), and fixed-well routing (magenta line) over life
of field for a four-well manifold tied back to the platform through
two flowlines. The curves show a comparison between a fixed routing,
and an optimized flexible well-to-line routing. To be able to realize
the potential that lies within optimizing field production, it is essential
to have accurate knowledge of produced flowrates from each well at
all times. Any optimization tool is dependent on an accurate model
of the production system. The quality of flow optimizations is linked
to the quality of the model, which in turn is dependent on the accuracy
of the measured flowrates.
 |
|
Fig. 3. Optimized vs. fixed routing production. |
|
Enhanced reservoir modelling potential. Values from Statoil on Gullfaks
field show an increase in expected ultimate recovery factor from 46%
in 1996 to 61% in 2004. 4 The increase is attributed to several factors,
including advances in reservoir modeling. The reservoir models are
based on a variety of data from 4D seismic to production logging. However,
accurate drainage and injection distribution measurements are a necessary
building block to provide accurate reservoir models.
CURRENT ALTERNATIVES
Operators contemplating subsea developments must make a choice between
specifying just physical meters or going with a virtual metering option.
The advantages and disadvantages of these options are described in
the following passages.
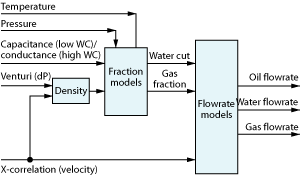
Physical meters. All subsea multiphase or wet gas flow meters (MPFM
or WGM) face the common challenge, that the property they seek to measure,
the volumetric or mass flow of each of the flowing phases, does not
lend itself to direct measurement by currently available technology.
To measure the volumetric or mass flow directly, the fluids must first
be separated, and then measured. As this is not a practical subsea
solution, or even practical for most topsides applications, the meters
are restricted to measuring primary variables, and companies resort
to calculation software to calculate flowrates based on the primary
measurements. This requires a model description of the fluid flow,
and an algorithm to calculate flowrates based on primary measurements.
Figure 4 shows a typical logic diagram for a WGM/MPFM. 5
 |
|
Fig. 4. WGM/MPFM logic diagram.5 |
|
The primary sensing elements used range from direct measurements,
such as pressure and temperature, to more advanced sensing elements
that require calculation and interpretation, such as velocity cross-correlations
and Gamma densitometers. Different vendors use different combinations
of primary sensing elements that give strengths and weaknesses for
different combinations of the three flowing phases. A meter designed
to calculate three flowing phases is, as a matter of principle, dependent
on a minimum of three primary sensing elements to achieve a mathematically
defined problem.
Each primary sensing element is subject
to an inherent error or inaccuracy. The total error of the multiphase
or wet gas calculations will reflect the sum of the errors of the
individual sensing elements, and the error of the applied flow model.
A differential pressure measurement across a reduction in flowing
area is, together with pressure and temperature sensors, probably
the most widely employed primary measurement in WGM and MPFM technology.
To give an accurate reading of the overall mass flow from a venturi
meter, the flow calculations algorithm must have an accurate description
of the density of the each of the flowing phases. If the PVT model
used in the flow calculations does not accurately depict the actual
flowing properties, the results will contain certain errors. This
reflects the greatest challenge to multiphase metering today�the
effect of changing fluid properties, and the inability to detect
these changes.
To be able to meet their specified accuracy, many meter vendors require
special circumstances, such as in-line calibration, or a requirement
of only saturated water production at start-up (no free water production).
Due to the complexity of many of today's production systems, it may
not be possible to achieve reference measurements for meter calibration.
In addition, most of the primary sensing elements detect a variable
that is dependent on flowing fluids' PVT properties. The calculation
software must reflect the correct PVT properties to yield a correct
flow split. For most reservoirs, the fluid composition will vary over
time. This, in turn, will result in decreased accuracy. Some meters
have facilities for providing fluid samples to rectify this problem.
This leaves the operator with the challenge of collecting and analyzing
samples at a regular interval.
Virtual metering. The term, virtual metering,
may be described as the concept of calculating flowrates, based on
all available sensory information distributed throughout the production
network. Virtual metering may be performed online or offline�the
only prerequisite is that all sensory information is gathered within
the same timeframe, to facilitate the computational models used.
The basic idea is to combine the sensory input with the numerical
flow models.
The virtual meter calculates a flow field through the entire production
system. The flow field will inherently contain the calculated sensor
responses at all sensor locations. The discrepancies between measured
and calculated properties are quantified within an object function,
and the object function is minimized through an iterative search. The
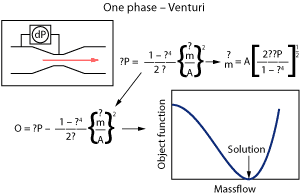
procedure is described in its simplest form in Fig. 5. 6 It shows how
the analytically solvable problem of single-phase flow through a venturi
can be solved iteratively by imposing an object function.
 |
|
Fig. 5. The concept of the object function. |
|
The one-dimensional problem lends itself
more easily to illustration than the three-dimensional problem consisting
of three flowrates�oil,
gas and water�flowing through a production well with multiple sensors.
The principle, however, is the same.
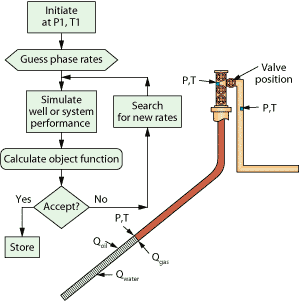
Figure 6 shows the operating principles of a virtual meter. All required
information is fed into the model, either on an on- or offline basis.
The model makes an initial guess of the rates and calculates the equivalent
sensor responses. The discrepancy between the measured and calculated
system responses is quantified through the object function and evaluated.
The procedure is repeated iteratively, until the value of the object
function reaches one of a set of cut-off criteria.
 |
|
Fig. 6. Oil well with standard instrumentation.6 |
|
To obtain a well-posed mathematical problem, there must be at least
one measurement per unknown, the unknowns being the three flowrates.
The previous figures demonstrate the procedure with one and three unknowns.
The system can be expanded to a full converging network of wells and
lines. Recent software implementations have included the production
separator measurements and/or the fiscal export measurements. By increasing
the number of available measurements, the calculations will become
over-determined, and the virtual meter will become increasingly redundant
toward errors and failures in individual sensors.
One of virtual metering's major benefits is the accessibility of data
and calculations. Where most physical meters provide the results directly,
the virtual meter allows for a higher degree of interpretation and
user interaction. Not only the flowrates are reported for each time
step, but reporting and trending of the error function also give an
indication of the calculations' quality. A typical scenario for a virtual
meter is loss or error in one or several sensors. If the remaining
number of sensors no longer provides adequate information to obtain
a unique solution, the software allows for a reduction of the number
of unknowns to obtain a mathematically defined problem. Typically,
this may be done by introducing restrictions to the water-to-liquid
or gas-to-oil ratios. The restrictions or limitations may be imposed
as a function of any variable available to the calculations. The obvious
example would be to introduce a fixed, time- or rate-dependent correlation
to describe the changes in ratios. A different alternative is to use
the knowledge obtained through reservoir simulations to describe the
ratios as a function of bottomhole pressure and/or temperature.
A prerequisite to apply restrictions in the ratios is that the software-based
solution has the ability to include sporadic or non-continuous measurements
as part of the analysis. As opposed to a physical meter, the model
used in the virtual meter will continuously be updated toward all available
measurements, including sporadic non-continuous information, such as
direct well tests or deduction tests. A trend in any production characteristic
seen from one well test to the next may be extrapolated into the future
to aid the calculations. In the same way that trends and developments
may be utilized for predictions, the virtual meter also has the ability
to revisit previously calculated time periods. Contrary to a physical
WGM or MPFM, the virtual meter contains storage facilities to recalculate
all data. Should calculated flowrates be based on a perceived trend
or a sensor response that at a later stage is proven erroneous, all
results may be recalculated, based on the updated data. As stated in
the motivation section above, the primary benefit of accurate metering
on a day-to-day basis is the input provided to perform short-term optimization.
The long-term benefit of providing accurate information to the reservoir
models will be ensured, even if rate calculations are redone at a later
stage.
As described for the physical meters, virtual meters are also dependent
on an accurate description of fluid properties. Should the actual flowing
fluid differ significantly from the compositional description used
in the software, this will result in a reduction in the quality of
calculations. There is no technology available that can provide continuous
or intermittent sampling of fluid properties or composition, subsea.
To get an accurate composition, a laboratory test is the only quality
solution. The quality of results will also depend on the quality of
the analyzed sample. Sampling and analysis of fluid composition and
properties form a whole separate field, but a field that has great
bearing on the quality of the results obtained from a virtual or physical
meter. Due to the virtual meter's ability to continuously report an
error function, it will give an indication of the quality of calculations.
This may, in turn, be interpreted as an indication of the need for
updated fluid characteristics.
Data validation. FMC's virtual meter, FlowManager, uses a number of
data validation operations prior to utilizing any data for flow calculations.
All imported data are evaluated statistically to ensure that the values
are probable. The statistical evaluation employs simple principles,
such as maximum and minimum deviation, and rate of change to verify
sensor quality. The software also contains features for recognizing
certain scenarios, where multiple sensors should detect the same quantity.
As an example, a WGM is typically mounted upstream of the production
choke. The conditions at this position are essential for production
control and optimization, so a typical field will have stand-alone
pressure and temperature sensors at about the same location. Continuously
comparing the sensor values, and comparing these values to the model
responses, gives an indication of both error and a trend in error development
(drift) for each of the sensors.
A different example is sensors that only sporadically should show
the same value. For the typical FMC subsea tree, the upstream choke
sensors are mounted between the master and wing valves. Intermittently,
the wing valve will be closed, while the master and choke valves are
open. For this scenario, the upstream and downstream choke pressures
should be nearly identical. If they are not, this will indicate an
error in one or both sensors.
By analyzing the production system, it is probable that a large percentage
of sensors may be subject to intermittent verification. By using this
information actively, the quality of reported flowrates will increase
significantly.
COMBINED SOLUTIONS
The main challenges for both physical and virtual wet gas and multiphase
meters are the quality of individual sensing elements, and the fluid
properties that calculations are based on. By combining WGM or MPFM
technology with a virtual meter, the system may become over-determined,
and to a certain degree redundant toward errors in individual sensors.
To calculate flowrates at any point in the production system, a virtual
meter depends on having at least three measurements to find a unique
solution. The same applies to a physical meter that depends on a minimum
of three measurements to calculate three flowing phases. By importing
data from the primary sensing elements of the physical meter into the
framework of a virtual meter, the number of available measurements
will increase.
Any fluid or flowing property that can be both measured and modeled
is available to be included in a virtual meter. In this sense, a virtual
meter can be used as an addition to, and a substitute for, traditional
multiphase meters, if adequate measurements are available. The virtual
meter can incorporate individual sensor readings that a multiphase
flowmeter consists of, or it may use the calculated rates directly.
Readings from the multiphase meters are incorporated with all other
measurements within the production system, to give a best fit solution
for the entire package. In many fields where multiphase meters are
employed, lack of reliability caused by discrepancies between the sum
of all meters and the fiscal measurements causes uncertainty in all
measurements. The virtual meter is not limited to giving a spot reading
at the sampling position. Thus, it may be used as a supervision tool
to establish the most likely source of error.
To enable the software to use separator measurements, or the results
from a multiphase meter, it is necessary to have a solution that allows
for a controlled difference between the measured and calculated quantity.
The software contains a weighted object function. Assigning different
weights to the different measurements allows the user to accentuate
or discard certain measurements. In an over-determined system, this
feature gives an operator the possibility to use the system for sensory
evaluation.
Additional benefits. Measuring the flowing
phases does not in itself provide added value�the value comes from
how this information is used in production planning, production optimization
and in reservoir modeling. Traditionally, operators have used data
from well tests to calibrate models of wells and pipelines for production
planning and optimization. Employing a combined solution will give
a continuous verification of well model quality, as the sum of all
production is verified continuously toward topsides separator measurements.
It will also employ all available information to provide, as accurately
as possible, a prediction of the flowing phase rates at any point
in the production system. Both production planning and optimization
will improve, due to the improved accuracy of the employed models.
By employing such a tool, the added benefit of having a full mathematical
description of the flowing network may be used to perform a variety
of tasks. Online production optimization may be performed on a regular
basis by production engineers, or it may be performed as a fully automated,
set interval optimization that provides the best possible choke settings
for production and gas lift chokes, and routing recommendations. The
optimization run by the software is designed around enforcing various
system constraints and optimizing toward these constraints. The software
also contains facilities for closed-loop choke control. This means
that a field may be run in fully automated mode, where choke positions
are taken directly from the optimization recommendations.
Employing the complete system may not only improve the field's overall
efficiency and recovery factor, it may also limit the manpower needed
to run the field, and enable more personnel to work remotely.
CONCLUSIONS
Virtual and physical metering are rapidly developing technologies
facing many of the same challenges. The main challenge for multiphase
flow metering at the current state of technology is the inability to
directly detect changes in the compositions of the produced fluids.
However, by incorporating the two metering principles in a common framework,
the number of available measurements may be sufficient to detect changes
in fluid properties, if not to detect changes in the composition directly.
The two technologies also face common challenges related to sensor
quality. At the very least, this issue should be dealt with by using
continuous statistical surveillance of all sensors' reported values.
By evaluating trends over time, and taking advantage of distinct situations
where multiple sensors are exposed to similar or identical conditions,
the data quality, and subsequently the value of each sensor, will increase
significantly.
Incorporating all available data from the production system, including
the WGMs/MPFMs, in the framework of a virtual meter paves the way for
closing the gap between obtaining relevant data, and turning the information
into increased revenue. 
LITERATURE
CITED
1
Karstad, P. I., “Subsea
IOR challenge and technology solutions,” Statoil presentation
at SPE, April 2004.
2 http://www.npd.no/English/Aktuelt/havbunn_utv_grad.htm
3 Laherrère, J. H., “Future sources of crude
oil supply and quality considerations,”
DRI/McGraw-Hill/French Petroleum Institute conference,
June 1997.
4 Hesjedal, A., ”Increased oil recovery on Tampen,” Statoil
presentation
to Morgan Stanley, North Sea Conference, May 2005.
5 Cunningham, C., E. Fjøsna and K. Berg, “Combined physical
and virtual multiphase metering for redundancy and synergies,” Deep
Offshore Technology Conference, November 2004.
6 Rasmussen, Åge, “Field applications of model-based
multiphase flow computing,” North Sea Flow Measurement Workshop,
October 2004.
|
THE
AUTHOR |
|
Åge
Rasmussen is a specialist engineer in Flow Management for FMC
Technologies. He holds an M.Sc. degree in Fluid Mechanics from
the Norwegian University of Science and Technology (NTNU). Mr.
Rasmussen joined FMC's FlowManager department in 2000, and has
since been involved with all aspects of the software, from model
calibration to software development. He currently works out of
FMC's Australia office in Perth, providing flow assurance and
field development support for FMC's customers in the Asia Pacific
region. |
|
| |
|

