TECHNOLOGY
Shell and PDO hone skills in UBD reservoir characterization
PDO combined technologies to unlock the potential of Oman’s mature fields.
John Bowling, Blade Energy, and Darren Murphy, PDO
Since 2002 when Shell introduced underbalanced drilling into Oman, Shell affiliate, Petroleum Development Oman (PDO), has had a continuous Underbalanced Drilling (UBD) campaign. Initially, improved oil production and lower unit total cost (UTC) were the primary drivers for PDO. However, while drilling the fourth well in the campaign, a water influx was encountered. Evaluation of the inflow data revealed that the influx was through a conductive fracture. This information was a surprise to the asset team, because the reservoir was modeled as a homogenous unfractured reservoir.
The discovery of non-matrix reservoir behavior marked the start of the development of Underbalanced Drilling Reservoir Characterization (UBD RC) within PDO. Shell has previously recognized that UBD RC and improved productivity are now the key drivers for drilling UBD at PDO. UBD RC is the big step between defining rock properties and saturations, and understanding reservoir fluid movement. UBD RC is used to answer two fundamental questions: “Does this well produce oil?” and “Where is the water coming from?”
WHAT IS UBD RESERVOIR CHARACTERIZATION?
UBD Reservoir Characterization (RC) is essentially well testing while drilling. It combines conventional LWD (gamma, resistivity, porosity and density) data, bottomhole circulating pressure and mud logging data, with flow composition data and drilling data. This is done to form an overall picture of what is happening along the hole while drilling (depth-based) with what occurs during drilling (time-based). Figure 1 shows all the inputs that go into UBD RC.
 |
Fig. 1. Ideal Reservoir Characterization Process, showing all the inputs required for accurate interpretation.
|
|
Combining depth-based LWD data that is familiar to geologists and petrophysists with time-based data, UBD data is a large step between defining rock properties and understanding the moveable fluid in the reservoir. To do this, a single curve was needed, which normalized flow data with pressure, time and depth. This curve shares the same units as productivity index per length (PI/L), but it is derived differently and called Rate Integral Productivity Index (RIPI). RIPI is derived from cumulative production and cumulative time, and normalized with instantaneous draw-down pressure based on an assumed (or known) reservoir pressure per meter drilled.
RIPI is not a true Productivity Index, in the traditional well testing sense. It is a comparison of changes in flow for each new meter drilled. Trends and changes in RIPI can be matched with petrophysical data to reveal a clearer view of the reservoir and its production behavior. This is done by analyzing trends along the well path. Fluid produc-tion rates, reservoir pressure, and fluid composition and bottomhole circulating pressure can, therefore, identify con-tributing fractures and high/low permeability features.
As UBD RC has matured, it has been applied to real-time decision-making, allowing immediate actions to be taken. These actions typically include:
- Steering the well
- Extending the well beyond plan
- Well completion design with EZIP and open-hole clads
- ESP pump sizing.
Specific advantages that UBD RC has over conventional RC, using Logging While Drilling (LWD) data, are obvious now in Shell and PDO. These include:
- Know the PI of wells before production
- Identify contributing fractures that may or may not contain water
- Identify high-productivity intervals
- Provide data to TD while LWD data are subject to sensor offsets
- Identify flushed zones that appear to have good saturations but produce only water
- Redefine the resistivity that produces hydrocarbons.
For this reason, LWD logs are used to support interpretation of UBD data.
THE ABC’S FOR UBD RC
The secret to accessing information from UBD RC lies in plotting curves of cumulative flow against time or depth, and comparing them with other petrophysical and drilling data described above, to assess changing reservoir behavior and potentially different reservoir features. As both experience in interpreting and improvements in present-ing data has developed, so too has confidence in the ability to detect features. Figures 2, 3 and 4 show how bottom-hole flowing pressure and RIPI react to changes in reservoir quality.
 |
Fig. 2. Reservoir quality and an oil-bearing fracture-effects on bottomhole flowing pressure and RIPI.
|
|
 |
Fig. 3. Changes in reservoir quality and flow composition-effects on bottomhole flowing pressure.
|
|
 |
Fig. 4. A water-bearing fracture in a good reservoir.
|
|
ERROR SOURCES/REFINING RC
UBD is a dynamic system that provides a wide range of data from various sources at different frequencies. Some data are gathered automatically at 1-min. intervals, and some data are measured manually at 30-min. intervals. Fur-thermore, drilling with jointed pipe requires shutting the pumps down every 30 m for a connection. This upsets the entire circulating system pressure, causing unstable flow, and fluid and gas slugging. The pressure dynamics in a UBD well can easily mask flow features in the well and add a great deal of difficulty into reservoir characterization.
The other major issue for UBD RC is the lag time calculation. At present, an inaccuracy of up to 8 m is estimated for wells with no emulsion issues. If there are emulsion problems, then 30-min. manual readings must be used, and the inaccuracy of lagging increases up to 15 m, based on the drilling ROP. It is due to the difficulty in lagging multi-phase UBD wells that LWD data are needed to support the interpretation of flow data.
To get a full understanding of flow data, a composite plot is generated showing UBD and LWD data together. Presentation of the UBD RC plots has improved with each new well drilled. The depth-based completion plot is sup-ported by a time-based flow and drilling parameters plot to explain operational issues affecting the bottomhole circu-lating pressure, Figs. 5 and 6. The time-based plot can also be used to spot trends while drilling to improve opera-tional efficiency and help diagnose drilling-related problems.
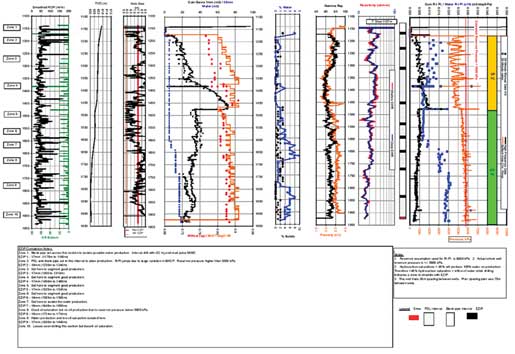 |
Fig. 5. Completion Composite Plot. From left to right, Channel 1 is ROP and off-bottom distance; Channel 2 is TVD; Channel 3 is Density Caliper; Channel 4 is Cumulative Flow and Temperature; Channel 5 is Percent water and solids; Channel 6 is Neutron Porosity and Gamma; Channel 7 is Resistivity; Channel 8 is the open-hole completion schematic; and Channel 9 is Rate Integral PI and bottom hole Circulating Pressure.
|
|
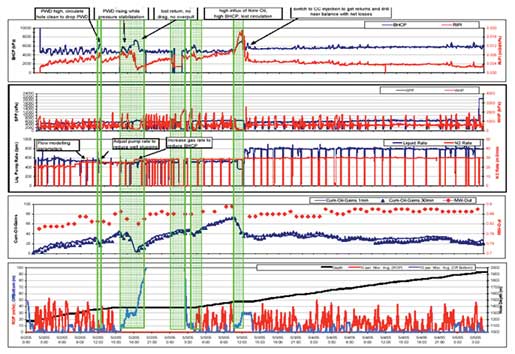 |
Fig. 6. Drilling Composite Plot. From top to bottom, Plot 1 is bottomhole circulating pressure and Rate Integral PI; Plot 2 is standpipe pressure and wellhead pressure; Plot 3 is liquid and gas Injection rates; Plot 4 is cumulative gains and fluid weight-out; and Plot 5 is ROP, measured hole depth and off-bottom depth.
|
|
CONCLUSIONS
UBD RC is a new tool that has been developed and implemented by Shell and PDO to improve all aspects of planning, drilling, completing and producing a well. The benefits of UBD RC include:
- Real-time identification, location of contributing fractures and features
- Real-time identification of fluids and fluid type produced from different reservoir segments
- Real-time identification of high-permeability zones.
- Provision of information to enable the well path to be steered, based on fluid returns or non-returns
- Real-time correlation to LWD data
- Enable the entire well planning team to collaborate more effectively
- Updating reservoir models for fractures and flow characteristics
- Real-time UBD RC is complementary to mechanical profile control for the decision-making process and placement of mechanical profile control equipment. Ultimate recovery is improved by identifying and isolating fracture flow to the onset of water production.
- UBD RC has its limitations, but technical developments in data acquisition will help improve these results. Shell and PDO has already realized considerable value in UBD RC, even though the development is in its infancy. The value to PDO is that it answers the questions most important to an oil producing asset-“Does this well produce oil?” and “Where is the water coming from?” Armed with the answers to these questions, corrective action can be taken.

ACKNOWLEDGMENT
The authors would like to thank Oman’s Ministry of Oil and Gas, Shell, Total and Partex for allowing publication of this article. From PDO, Abdulsattar Al-Murshidi and Said Houqani, and from Shell, Ian Davidson and John Ramalho.
REFERENCES
Gauthier, P.J., H. Hussain J. Bowling, J. Edwards, B. Herold,” Determination of water-producing zones while drilling underbalanced horizontal wells-Integration of sigma and real-time production data,” SPE paper 105166, 15th SPE Middle East Oil & Gas Show and Conference, Kingdom of Bahrain, March 11-14, 2007.
Mederios, R. S., D. Biswas and P. V. Suryanarayana, “Impact of thief zone identification and shut-off on water production in the Nimr field,“ SPE/IADC paper 91665, presented at the SPE/IADC Underbalanced Technology Conference and Exhibition, Houston, Oct. 11-12, 2004.
Murphy, D., I. A. Davidson, R. Busaidi, J. Wind, C. Mykytiw and L. Arsenault, “Applications of underbalanced drilling reservoir characterization for water shut-off in a fractured carbonate reservoir-A project overview,” SPE paper 93695, presented at the 14th SPE Middle East Oil & Gas Show and Conference, Kingdom of Bahrain, March 12-15, 2005.
Suryanarayana, P. V., S. Mason, P. Frink, “Reservoir characterization In low-pressure oil reservoirs using flow while drilling data,” PDO, Jan. 24, 2004.
Suryanarayana P.V., R. N. Vaidya and J. A. Wind, “Use of a new rate-integral productivity index in interpretation of underbalanced drill-ing data for reservoir characterization,” Production and Operations Symposium, Oklahoma City, March 31-Apr. 3.
|

