Drilling Report
Curmudgeonly comments
A plea for more professionalism in drilling.
Leon H. Robinson, PetroSkills, Houston
This might insult many authors and engineers who are publishing. But I am not trying to get your vote – just return a dignified profession back to something with pride. Presented are five gripes from the author, based on a lifetime of experience.
QUIT PUBLISHING ADVERTISEMENTS CAMOUFLAGED AS TECHNICAL PAPERS
Current methods of investigating variables in petroleum engineering literature seem to fall in two categories:
- Reports describe computer outputs with no possibility that the data can be reproduced by an independent investigation.
- Data is acquired to validate a postulate without exploration of all variables involved.
In science and engineering laboratory reports, students are graded on clarity of writing, good data analysis and reporting that is complete enough so that data can be reproduced. This is college freshman level stuff. However, many technical articles fail this basic criterion. Frequently, publications do little more than to report that some company has a new product or can perform a calculation that solves a problem. The new development is proprietary and not discussed in the article or paper. This isn’t a technical paper or article, it is advertising.
One of my “favorites,” is a report that simply says, by solving some well-known equations, like the equation of continuity or Schrodinger’s equation, the answer is obvious and the results are discussed in depth; but, the equations or proofs are non-existent. Companies authoring advertisements disguised as reports or technical papers should instead purchase advertising space in magazines, not clutter up literature with “litter ature.”
Unfortunately, in paper after paper, the results are proclaimed with no data or procedures that would allow an independent evaluation of the information. Having a computer program that calculates a number does not qualify as validation. What variables were considered? What tests were performed to explore all of the variables? What measurements were made? What specific equations were solved and how?
Criteria for publishing technical papers need to be strengthened. The biggest change is to return to basic high-school level guidelines for writing a lab report. Teachers pound on the concept that someone skilled in the art should be able to reproduce your data and conclusions after reading your report. This means that if I tell you I solved material-balance and energy-conservation equations in my proprietary computer program, I should not be able to publish that type of statement in a technical publication without showing how the equations were solved.
CONSIDER EVERYTHING
– avoid self-fulfilling postulates
To set the stage, let’s recall what Aristotle said. He proclaimed, as a postulate, that heavy objects fell faster than lighter objects because of gravity. As proof, he dropped a feather and a steel ball simultaneously. Obviously, the steel ball reaches the ground much faster. Proof! – right? Fortunately, Galileo came along a few centuries later and suggested that some experiments might shed light on the situation. Now, let’s look at the modern parallel.
Joe Never-wrong, driller for Always-Stuck Drilling Company, knows that annular velocity washes out boreholes. When he slows the pumps down to reduce annular velocity, the borehole does not erode as much. Proof! But suppose all of the variables involved are examined.
Interestingly, the percent change from decreasing the downhole flowrate is lower for annular velocity than it is for nozzle velocity, hydraulic impact or hydraulic power. What we find is less washout results after decreasing the nozzle shear rate below 100,000 reciprocal seconds, or reducing the impact force below 2,000 Newtons, or reducing the hydraulic power below 200 kW. The criterion of shear rate was selected because the units are invariant with respect to English, SI or metric scales. Unfortunately, all of the variables were not explored sufficiently to identify which entity is responsible for hole enlargement. However, enough data was collected to determine that annular velocity was not eroding wellbores. This is only one example, but the concept of proposing a postulate and acquiring only data to verify that postulate is rampant in our literature.
Failure to explore variables in an analysis results in many different interpretations. For example, for many years, many accepted the fact that high annular velocities eroded boreholes, even in hard rock. Proof? Slow the pumps down and the wellbore comes back to gauge. This is difficult to justify when annular velocities have drilling fluid passing parallel to the surface at about the speed you walk. Yet, with 537 rock-bit drilling, the nozzles fail to make hole, even though the fluid is aimed at the hard rock and hitting it about 100 times faster than the annular velocity. Examine what a change in flowrate does to percent changes in annular velocity, nozzle impact force or nozzle fluid power. Annular velocity may change by 10 to 15%, but the impact force changes by at least twice that amount.
An example of this is the data acquired to verify that annular velocity washes out holes. Proof: When the annular velocity is decreased, the wellbore does not erode as much. How is the annular velocity decreased? By decreasing the flowrate, does anything else change? Actually, the percent change in impact force or hydraulic power is an order of magnitude larger than the change in annular velocity.
As an alternate condition, consider matching pressure-drop calculations with standpipe pressures to validate the calculations. The process is to calculate pressure losses in surface equipment (relatively small), pressure losses inside drillstrings, through nozzles, and up the annulus. The sum of these numbers sometimes matches daily report pressures. The problem is that annular pressure losses, calculated at 30 to 40 psi, are actually measured in the 300-to-400-psi range, and the pressure loss through the nozzles is around 300 to 400 psi less than calculated. Also, the accuracy of the pressure drops through the nozzles is suspect, because the diameter is not actually measured, nor was the downhole flowrate determined by calibrating the mud pumps. Jumping to conclusions is a great exercise for too many engineers.
An interesting SPE paper stated that differential pressure sticking was not related to filter-cake deposition. Proof? An analysis indicated that stuck pipe did not correlate with fluid loss; so the filter cake did not cause stuck pipe. Problem? Well, the static, room temperature filter-cake fluid loss does not correlate with the dynamic filter-cake fluid loss, and filter-cake thickness does not correlate with filter loss.
This comes as a shock, perhaps, to chemical engineers who are accustomed to working with Newtonian fluid filtration. Run a simple test. Blend bentonite and lignosulfonate into a mud cup filled with water to achieve a fluid loss around 9 to 10 cc in 30 min. Split the sample and add a handful of dirt to one. Fluid loss will be lower with the sample with dirt (or drilled solids), and the filter cake will be significantly thicker, Fig. 1. Drilled solids will lower fluid loss and also increase filter-cake thickness. Were all of the variables examined when considering records to find effects? Not in this case.
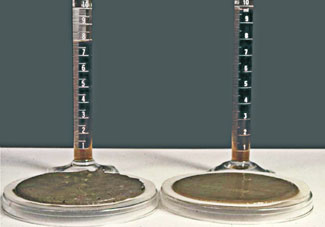 |
Fig. 1. Fluid loss will be lower with the sample with dirt (or drilled solids), and filter cake will be significantly thicker.
|
|
In the figure, the filter cake on the left comes from the fluid containing the drilled solids. The fluid loss, shown in the cylinder behind the filter cake, was lower than the fluid loss from the clean drilling fluid. This means that specifying fluid loss does not specify a thin cake. To continue the concept of a good filter cake a little more, the fluid loss through the filter cake on the left will increase as the pressure differential increases. The bentonite filter cake (no drilled solids) will have about the same filtration rate with a 500-psi differential pressure as with 100-psi differential, because it is compressible.
DON’T OVERWORK THE PROBLEM?
One of the phrases that has become commonplace in management vocabulary these days is “Let’s not overwork the problem.” Translated to projects, this, in effect, means “verify the postulate and don’t worry about the interaction of other variables.” This seems to be the work ethic imposed by the vaunted business units to eliminate excess work and complete projects on time and within budget. Unfortunately, overworking a problem is very difficult to do. All possible variable interactions should be explored, or at least some effort made, to account for all effects.
INACCURATE ACCURACY
Another pet peeve of mine is the engineering community’s lack of understanding of significant figure accuracy. For example, consider calculating the speed of a car that has traveled 300 mi at a constant rate for 430 min. What is the speed of the vehicle in miles per hour? Speed equals the distance traveled divided by the time to travel. Using a calculator, the answer appears as a number:
Is this the correct answer? It depends on the accuracy of the initial condition. If 300 and 430 are whole numbers, then there are three significant figures, which is the maximum accuracy, i.e., 41.9 mph, and it is found by rounding. If the numbers are approximate, then the accuracy could be much less or much greater, depending on the number of significant digits in the inputs. The most accuracy that can be had in multiplication and division is equal to the number with least number of significant digits. In addition and subtraction, it’s equal to the least number of decimal places.
Suppose the distance was measured at 300.4 mi and the time at 430.2 min. (these numbers round-off to the ones given). The calculator would present speed as 41.89679 mph. However, if the mileage was 300.4 mi and time was 430.24 min., the speed would be 41.892.
Which is correct? 41.89 or 41.90? Why is there a difference? The minimum number of significant digits is four and governs the answer. However, the intermediate division step should carry one more significant digit before rounding; thus, 41.897 rounds to 41.90, and 41.893 rounds to 41.89. So, the range of uncertainty occurs in the fourth significant figure. Failure to follow basic significant-digit rules leads to errors.
Data is frequently presented with two or three significant figures. For example, the acceleration of gravity often used is 32 ft/sec2 instead of 32.17 ft/sec2. By the way, the value of g is not a constant, but varies with location around the world. All force equations should be adjusted for this variation by using the proper values of the acceleration of gravity.
To illustrate the importance in drilling, consider calculating pressure losses through drillbit nozzles. Bit nozzles are measured in 32nds of an inch. The tolerances on these, however, are 1/64ths, one half of the 32nds.
The calculation of pressure losses depends upon the fourth power of the nozzle diameter. If a 12.0-ppg drilling fluid is pumped through a three-nozzle bit at a rate of 400 gpm, the pressure loss through the nozzles is calculated for three undersize, three oversize and three accurate nozzles.
For three 12/32 nozzles, the pressure loss range could be anywhere from 1,600 psi to 1,200 psi. The range of differences becomes smaller as the nozzle sizes increase, Fig. 2. The range of error could be significant and may explain why some hydraulic programs work with incorrect equations.
 |
Fig. 2. For three drillbit nozzles, the pressure loss could be 1,600 to 1,200 psi (or 450 to 625 psi), depending on the accuracy of the nozzle size measurement. The range of differences becomes smaller as nozzle size increases.
|
|
As an aside, drilling engineers are not as guilty of this misapplication of significant figures as are reservoir engineers. They use eight significant-figure answers to get some of their equations to converge, yet do not know the porosity of most formations (one of the factors in the equation, to more than one significant figure. Porosity measurements on core samples might vary between 21 and 26% volume in a single core. They take an average and then calculate volumes of fluid in a reservoir in the range of thousands of barrels, to the nearest barrel.
UNDERSTANDING INFORMATION FROM THE RIG
Many engineers cull daily drilling reports for information and draw far-reaching conclusions from sophisticated, clever and elegant statistical data analysis. However, the reports may not reflect accurate information and, no matter how sophisticated the statistical model, bad data results in bad decisions. A new engineer was challenged to watch for good Weight-On-Bit/ RPM data during a week of training at a drilling rig. He was enamored with all of the pages of data available in the bit records and planned to start a long program to analyze the data. He was offered a free dinner for his wife and himself at a fancy restaurant in Houston when the field trip was over, provided that he could find one time when the driller was running the WOB and the rotary speed recorded on the saddle blanket (IADC daily report form).
He checked drillers during daylights and nights. No free meal. Why? Simple; these drillers were dedicated to their job! They searched for the best WOB and rotary speed to make the bit drill as fast as possible (they were looking for the flounder, or founder, point, where the ROP stops responding linearly with increasing WOB; this is taken to be the optimum WOB for ROP.)
But the drilling program called for a specific WOB and a specific rotary speed. Rather than try to argue with office engineers, they wrote down what was expected. This is the big disconnect between office engineers and field personnel.
In another case, in Oklahoma, two identical rigs were drilling in the same field. One rig continually drilled their wells faster and cheaper. Both indicated that the drilling program was followed exactly as designed by the engineers. After visiting the rigs and watching operations for several days, it became clear that one rig was running a different bit weight and a different rotary speed than the program called for. Although the mud weight was reported accurately, some of the other drilling fluid properties did not match the morning reports. The morning reports matched each other and the drilling program.
Inquiry about why the disparity between real life and reported conditions revealed that the personnel were comparing the two rig supervisors on the basis of performance. The supervisor of the faster rig wanted to know why he should be expected to teach the slower rig how to drill when he could get a better rating and more pay raises with his performance.
The importance of seeing things on the rig was vividly illustrated in another event in Texas. The drilling engineer believed that extended nozzles would improve drilling rate. The drilling supervisor on the rig had very bad experiences with the extensions breaking off during the bit run. This required a fishing run with a magnet or a reverse-circulation junk basket to retrieve the large chunks of metal. The complaint fell on deaf ears, and the rig supervisor in the office ordered his supervisor to run the bit. The 143D4-in. diameter, milled-tooth bit was drilling at about 60 to 70 ft/hr. The new bit with extended nozzles was picked up and started drilling at about 40 to 45 ft/hr. Under questioning about why the bit was not drilling faster, the rig supervisor answered all questions truthfully. The mud weight and flowrate remained the same, WOB and rotary speed were the same. All conditions were the same as the previous bit run.
After drilling for about 18 hours, the office finally gave the rig orders to return to the old style of bit. When the bit arrived at the surface, the office engineer asked about the shape and wear of the teeth and the bearing conditions. Again, the rig supervisor answered all questions truthfully. The new bit returned to the drilling rate of 60 to 70 ft/hr. The office engineer was left perplexed and proclaimed that extended nozzle bits did not improve drilling rates and he now had proof.
If the office-bound engineer had been on the rig, he might have noticed a metal bar was locked onto one cone which prevented it from turning or any of the teeth on that cone from touching the hole bottom. He did not think to ask if a piece of metal was wedged on the bottom of the bit; and this information was not volunteered, Fig. 3. The engineer never did find out about this problem until he left the company. After several experiences like that, I have great skepticism about validity of the analyses of records from daily activities unless the activity is personally scrutinized while it is happening.
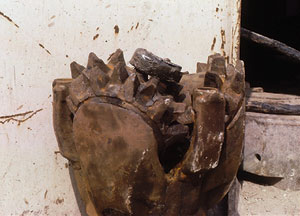 |
Fig. 3. No one thought to ask why the bit performed so poorly. Note metal bar stuck in cone on the left.
|
|
In other cases, “record wells” are drilled “on paper.” The way it works, particularly with a small rig drilling lots of short, fast holes, is that the well is not reported as having spudded until the drill collars are buried. Then, at TD a few hours or days later, the “finish” is moved up a few hours, especially if the TD occurs in the middle of the night or very early the next morning. By shaving a few minutes or hours off the duration of the well on both the front and back end, the standing record can be broken and can be very difficult to duplicate with a “real” record in the future.
FINAL WORDS
Many years ago, the drilling supervisor on a drilling rig had almost dictatorial power to conduct operations. He had probably started as a roughneck, worked his way up to derrickman, driller, and then tool pusher. The formal education level was generally at the high school level, although many did not graduate from high school. They instead went through an “apprentice” type program known as on-the-job training. Over the years, they learned by watching others and all types of “old wives’ tales” were propagated. This had good features and bad features. Solutions were practical and, where difficult to confirm, frequently more intuition than science. For example, additives in the preflush in front of a cement job would be difficult to evaluate on a rig. Persuasive salesmen can develop a good market for products that can not be easily evaluated when used.
The changes in the last 20 years have evolved because fewer and fewer of the supervisory staff had actual field experience. Now, many drilling engineers seldom get to rigs. Many of the so-called “studies” now in the literature are the result of reading reports and documents that presumably have captured field data on day-to-day operations. Solving a problem from the office is difficult.
That is the reason, for example, that good hole-cleaning must be determined at the rig. Good hole-cleaning is defined by the shape of the cuttings coming to the surface; not the number of cuttings arriving at the surface or whether hole problems exist. If a shaker screen is loaded with cuttings, and the cuttings have all of their edges rounded off, the hole is not being cleaned. If torque and drag are increasing, it could indicate failure to clean the hole – or – it could indicate many other things.
That is also the reason that calculations should be made from basic principles and thoroughly explained. Later, once you know the science behind the material, you can write your own computer programs. 
|
THE AUTHOR
|
 |
Leon Robinson retired in 1992 after 39 years with Exxon Production Research. He is a drilling instructor with Petroskills, chairman of the API Task Group 5 (Solids Control), SPE Drilling Waste Management Steering Committee member, Program Committee member for the 2007 National AADE Technical Conference, and chairman of the IADC Technical Publications Committee. Robinson earned a BS degree in 1949, an MS degree in physics in 1950 from Clemson University and a PhD in engineering physics from North Carolina State.
|
|
|

