|
Vol. 227 No. 10 |
| |
 |
Do nanofibers improve filter performance?
Coalescing filters separate small liquid droplets from gas streams or from another liquid phase. Extensive modeling gives an optimum answer.
George G. Chase, Priyavardhana Srinivasan and Saravanan Andan, Microscale Physiochemical Engineering Center, The University of Akron, Ohio
Recent experimental works have demonstrated the benefits of adding nanofibers to microfiber nonwoven filter media. In this work, single fiber efficiencies and drag are applied to model filter performance for steady-state coalescence of oil drops from air streams. The model results show the same trends as observed in the experiments, namely that the addition of small amounts of nanofibers significantly increase the Quality Factor. New results from the model and experiments show that there is an optimum amount of nanofiber.
INTRODUCTION
Recent work shows improved performance of nonwoven filter media by the addition of small amounts of nanofibers.1 The purpose of this work is to determine whether there is an optimum amount of nanofibers to add to the filter media.
Our approach to this project is to model the filter using single-fiber capture mechanisms and single-fiber drag forces. The coalescence filter is assumed to operate at steady state with a uniform saturation of 10% (a typical value from our experimental data). The filter performance is determined using the Quality Factor. The model results are compared with experimental data.
Our model results show that there is an optimum amount of nanofiber. The highest Quality Factors occur when the ratio of nanofiber surface area to microfiber surface area is in the range of 1.0 to 2.0. Our experimental results agree with the optimum occurring in the same ratio. Qualitatively, the model and experimental results are similar, but the model over-predicts the value of the Quality Factor due to simplifying assumptions used to developing it.
DESCRIPTION OF COALESCING FILTERS
Coalescing filters are used throughout industry to separate small liquid droplets from gas streams or from another liquid phase. Several factors influence the efficiency and economics of the separation. In general, droplets in the 0.1- to 0.8-micron (µ) range are the most difficult to remove. Polymer nanofibers, made in our laboratory, provide a flexible and adjustable system for optimizing the filter structure to capture particles in the size range that has the highest probability for passing through the filter.
Unlike other filter media whose primary purpose is to stop particles from moving with the fluid stream, coalescing filter media have the additional requirements of making the drops coalesce into larger drops and of providing a means for them to drain out of the medium. In operations such as gas compression, coalescing filters may be used upstream of the compressor to protect the equipment. They may also be used downstream to collect compressor oil. The compressor oil is typically an expensive synthetic oil used in the compressor as a coolant, sealant and lubricant. Coalescence filters are used to recover and recycle the oil back to the compressor. Recovering even smaller droplets also reduces airborne emissions in many processes and helps in regulatory compliance.
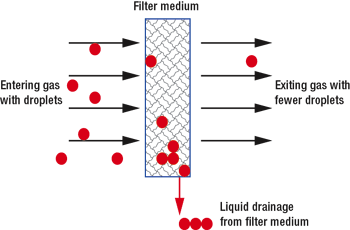
There are a number of mechanisms that control the coalescence filtration process.2 The process is sketched in Fig. 1. Single-fiber capture mechanisms3 control the rate at which drops are captured within the filter media. The filter media act to slow the movement of drops, helping them to collide. Microscopic observation of the coalescence process shows that most of the drops visible to the microscope (20- to 200-µ range) are captured on the fibers.4 When the captured drops form beads on the fiber that are large enough to see with an optical microscope, bead growth is rapid.5 Drag of the gas phase, together with gravity forces, causes the enlarged drops to migrate out of the filter media.
 |
Fig. 1. Coalescence filtration removes drops from the flow stream and drains the drops from the filter.
|
|
Several parameters, including pressure drop and capture efficiency, characterize the performance of filter media. It is convenient to have one parameter that accounts for multiple effects. Brown3 recommends using the Quality Factor, QF, defined by:
where is the penetration defined as the ratio of the particle concentration passing through the filter to the particle concentration entering the filter, and DP is the pressure drop. The nature of capture efficiency is such that if you double the thickness of a filter medium, the penetration decreases by the square of the thickness, hence the logarithm of the penetration is proportional to the thickness. Conversely, the pressure drop is directly proportional to the filter thickness. Hence, ideally, the Quality Factor is independent of the medium thickness and provides a means of direct comparison between various media. is the penetration defined as the ratio of the particle concentration passing through the filter to the particle concentration entering the filter, and DP is the pressure drop. The nature of capture efficiency is such that if you double the thickness of a filter medium, the penetration decreases by the square of the thickness, hence the logarithm of the penetration is proportional to the thickness. Conversely, the pressure drop is directly proportional to the filter thickness. Hence, ideally, the Quality Factor is independent of the medium thickness and provides a means of direct comparison between various media.
MODEL DESCRIPTION AND RESULTS
The numerical model applies volume-averaged continuum equations to account for conservation of mass for the gas and liquid phases. Capture rates are calculated for the dominant mechanisms of Brownian diffusion and direct interception using literature correlations.3
The gas-phase momentum balance is applied to determine the pressure drop. Drag correlations for flow around fibers are determined from literature correlations.3 The capture and drag correlations account for continuum, slip or molecular flow regimes, depending on the Knudsen number for the materials.
To compare performance results with filter media without nanofibers, the Quality Factor for a medium is divided by the Quality Factor of a medium with no nanofibers. Hence, improved performance occurs when this ratio is greater than unity.
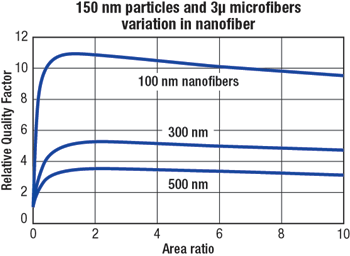
Figure 2 shows the calculation results for capture of 150-nm particles on 3-µ fibers with varying amounts of nanofibers for three different sizes of nanofibers. The amount of nanofibers is shown by the ratio of nanofiber area divided by microfiber ratio on the horizontal axis. The areas of the fibers are calculated as pi times fiber diameter times total fiber length. The Relative Quality Factor (RQF) plots show a rapid increase in RQF with small amounts of nanofibers. The graphs show the maximum for area ratios to lie between 1.0 and 2.0, followed by a gradual decline in RQF for larger area ratios of nanofibers.
 |
Fig. 2. RQF for capture of 150 nm particles in a filter medium of 3 µ and augmented with varying amounts of nanofibers. The plot shows an optimum occurs for area ratios between 1.0 and 2.0.
|
|
EXPERIMENTAL DESCRIPTION AND RESULTS
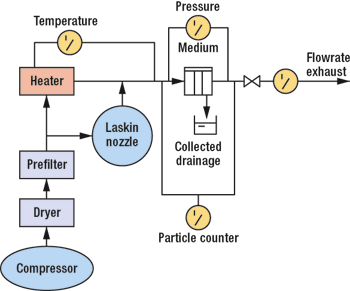
The experimental setup is shown in Fig. 3. A detained description of the experimental setup is contained elsewhere.1 The filter media are challenged with a distribution of particle sizes shown in Fig. 4, as measured using a Scanning Mobility Particle Counter (TSI). The average particle size is between 150 and 200 nm.
 |
Fig. 3. Experimental setup. Air is pretreated, combined with particles from the Laskin Nozzle, and passes through the filter sample. Pressure drop, flowrate, liquid drainage and particle size distribution are measured.
|
|
 |
Fig. 4. Particle size distribution of the particle challenging the filter samples in the experiments.
|
|
The filter media are formed by vacuum molding an aqueous slurry of glass microfibers, nylon nanofibers and an acrylic binder to hold the fibers together. The glass fibers are 2 to 5 µ in diameter, and the nanofibers have diameters of about 150 nm. The glass fibers are obtained commercially,6 and the nanofibers are produced locally by a process of electrospinning.7
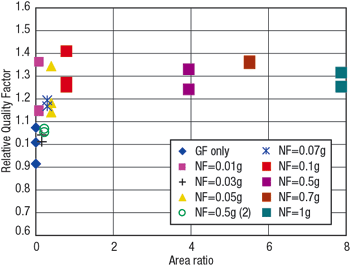
The experimental results plotted in Fig. 5 show a rapid increase in RQF for small area ratios. The RQF passes through a maximum for area ratio of about 1, and gradually declines for larger area ratios, similar to the model results. Qualitatively, the model and experimental results show similar performance in the Relative Quality Factor. The RQF increases sharply for increasing area fraction of nanofiber area to microfiber area.
 |
Fig. 5. Experimental values of Relative Quality Factor vs. area ratio of nanofibers to microfibers.
|
|
Quantitatively, the model over-predicts the RQF, most likely due to the simplifying assumptions used to form the model. For the materials used in the experiments, the optimum RQF occurs for 0.1 grams of nylon nanofibers added to 2.0 grams of glass fibers, or about 5% nanofibers by mass. In general, we can conclude that, at an area ratio of about 1 to 2, the RQF reaches a maximum and then gradually decreases for larger area ratios. 
ACKNOWLEDGEMENTS
This work was made possible through support from the Produced Water Society, the Coalescence Filtration Nanomaterials Consortium, and from the National Science Foundation, grant CTS0310429.
LITERATURE CITED
1 Chase, G. G. and D. H. Reneker, “Nanofibers in filter media,” FPSJ, Vol. 16(2), pp.105 – 117, 2004.
2 Sherony, D. F. and R. C. Kintner, D. T. Wasan, “Coalescence of secondary emulsions in fibrous beds, in surface and colloid science,” Vol 10, Egon Matijevic ed., Plenum Press, NY, pp. 99 – 161, 1978.
3 Brown, R. C., Air Filtration, Pergamon Press, Oxford, 1993.
4 Chokdeepanich, S. and G. G. Chase, “Microscopic observation of droplet coalescence in a fiber matrix,” Advances in Filtration and Separation Technology, Vol. 14, N. Bugli, W. Chen and S. Reynolds eds., American Filtration and Separations Society, Northport, AL, pp. 851 – 856, 2000.
5 Yarin, A. L., and W. Liu, S. V. Diophode, G.G. Chase, D.H. Reneker, “Liquid drop growth on a fiber,” AICHE J., Vol. 51(12), pp. 3109 – 3113, 2005.
6 www.hollingsworth-vose.com.
7 Reneker, D. H. and I. Chun, “Nanometre diameter fibers of polymer, produced by electrospinning,” Nanotechnology, Vol. 7, pp. 216 – 223, 1996.
THE AUTHORS
|
 |
George Chase is a professor of chemical engineering at The University of Akron, Ohio. He is a former chair of the American Filtration and Separations Society. He is area chair of the Fluid Particle Separations section in the American Institute of Chemical Engineers. He earned a BS degree in chemical engineering in 1978 and PhD in 1989, both from Akron. Chase has more than 180 journal and proceedings papers, three book chapters and five patents.
|
|
 |
Priyavardhana Srinivasan earned an MS degree in chemical engineering in 2005 from The University of Akron. She currently works for Parker Hannifin Corp.
|
|
 |
Saravanan Andan earned a BS degree in chemical engineering at Regional Engineering College, Tiruchirappalli, India, in 1999. He worked as a process engineer at Manali Petrochemicals LTD, Chennai, India, from 1999-2003. He is presently a PhD student at The University of Akron.
|
| |
|
|


