Using high-resolution seismic for carbonate reservoir description
Advances in SeismicUsing high-resolution seismic for carbonate reservoir descriptionAn integrated study approach was used to characterize Mesozoic carbonate reservoirs offshore Mexico. The study resulted in development well locations, their drilling order and a noteworthy infill producer.Richard Salter, Dianna Shelander, Marc Beller, Ben Flack, Diana Gillespie, Nick Moldoveanu, WesternGeco Reservoir Seismic Services, Houston; and Francisco Gonzalez Pineda and Jose Camara Alfaro, Petroleos Mexicanos A high-resolution, 320 km2 seismic survey was acquired over carbonate reservoirs in Arenque and Lobina fields, offshore Mexico, Gulf of Mexico. The study was directly used to assess four potential drill locations and modify their drilling order preference. A prolific hydrocarbon infill producer was drilled in Arenque field in the primary Jurassic target. In addition, in a secondary, Cretaceous reservoir target, there was a superb character tie between the predicted porosity from seismic data and the measured well porosity. The reservoir description results also enabled an appraisal well in Lobina field to be successfully sidetracked to target a thicker section of the main reservoir facies. The details of key reservoir features were only visible when advanced processing was applied to high-quality seismic data. High-frequency, high-fidelity seismic data and a fully integrated workflow enabled reservoir properties, driven by detailed rock-physics analysis, to be used in the construction of a high-quality reservoir model and attribute maps. This article describes the new seismic technology that made this result possible, outlines the major steps taken in the workflow and illustrates examples of successful projects undertaken as a direct result of the study. INTEGRATED STUDY APPROACH The reservoir characterization study used an integrated approach, which combined new seismic survey evaluation and design (SED), high-quality seismic acquisition and advanced data processing to prepare the data for its reservoir description objectives. The project study area encompasses Arenque field (discovered 1968) and the newly discovered Lobina field (2003), located in offshore northeastern Mexico, about 40 km east of the coastal city of Tampico. Water depths range from 30 to 80 m. The main productive reservoirs are the Jurassic-aged San Andres carbonates (Jsa) and the Cretaceous Tamaulipas inferior carbonates (Kti). Jsa formation is the primary reservoir target, while the secondary target is the Kti. Survey evaluation and design. The objectives of the Lobina project SED were to define the optimum acquisition parameters, and then determine the processing sequence and seismic inversion rock-property workflows that met the requirements of the reservoir characterization study. Resolutions of about 15 m in the Jsa formation and 20 m in the higher-velocity Kti formation were deemed necessary to maximize interpretation of reservoir variations. The SED study assessed concerns with the existing seismic data by using borehole information to determine if seismic resolution could be improved. Problems apparent with the area’s previous 3D survey in 1996 limited its usefulness. Spatial resolution was a concern. The maximum and dominant frequencies of 30 Hz and 15 Hz, respectively, adversely affected interpretation of key layers. Moreover, the data was not robust enough for detailed AVO and inversion studies because of poor amplitude preservation and limited offset range. Obstructions and shallow-water limitations in the area presented design challenges for the new 3D survey, namely, whether it could be shot in the strike direction, which was optimum from an operational standpoint. To answer this critical question, two 2D seismic lines were shot in two directions, one oriented toward the dip (E-W) and the other toward the strike (N-S). After processing the lines and analyzing their results, several conclusions were drawn. Shooting could indeed be performed in the strike direction if the spatial sampling was adequate. The maximum frequency attainable was 60 Hz (at 20 dB), with the dominant frequency being about 30 Hz. Data comparisons and analyses indicated that a frequency bandwidth of 6 to 60 Hz would be sufficient to achieve the survey’s resolution objectives. To recover the higher frequencies, a “whitening” method had to be applied. Also, a good signal-to-noise ratio was needed to prevent the boosting of high-frequency noise. Seismic data acquisition. There were three primary goals for shooting the new seismic survey. First, new high-frequency, high-fidelity seismic data were needed for an overall improvement on the 1996 conventional 3D seismic survey. Second, the new survey would improve the amplitude fidelity and vertical resolution for accurately delineating previously defined prospects. It was clear that doubling the maximum recorded frequency would significantly enhance the capability of mapping key reservoir layers, allowing previously defined drill locations to be ranked and new potential well locations to be identified. Third, new seismic data were required to interpret and characterize the area’s Mesozoic reservoir units in terms of structural and stratigraphic complexity, as well as their reservoir property prediction and distribution. It was determined that Q-Marine* technology would help achieve these goals by improving the signal-to-noise ratio, seismic resolution and amplitude accuracy of the seismic data. The acquisition system preserves higher frequencies because of receiver perturbation corrections, a calibrated marine source and marine noise-attenuation improvements through Digital Group Forming (DGF). Further, its streamer steering capabilities enable more efficient operation in obstructed areas. WesternGeco Reservoir Seismic Services worked closely with the Pemex interpretation team to design a 320 km2 survey, Table 1. The high-resolution, 3D seismic survey encompassed Arenque and Lobina field areas and was acquired in September and October 2003.
Seismic data processing. Where possible, analysis and interpretation of the newly acquired seismic data were integrated with processing, so that the final analysis was completed by November 2004. Fast turnaround was a prerequisite for this study, in order to use it for ongoing exploration and development plans. Initial processing, including geometry merge, data editing and calibrated marine source (CMS) QC were performed onboard. Most of the testing was performed before the data arrived in the processing center in Denver, Colorado. Generally, the data were of excellent quality and good resolution throughout, with superb reservoir detail in the key Mesozoic intervals. A processing sequence was designed, based on the improved seismic resolution requirements, signal-to-noise ratio and amplitude accuracy of the new seismic data, Table 2. This sequence ensured a true amplitude dataset, which in turn would be inverted to produce quantitative volumes, such as P-impedance. When integrated with petrophysical analysis, this would enable the characterization of Mesozoic objectives through a description of a robust porosity measurement.
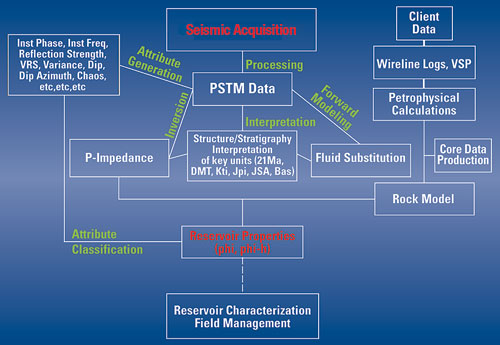
Reservoir description steps, results. After processing, it was clear that the survey had achieved its goals. Petrophysical analysis in conjunction with fluid-substitution modeling indicated that a quantitative assessment of fluid saturation distribution would be prohibited in this challenging carbonate environment. Consequently, predicting quantitative porosity using a robust post-stack inversion workflow would be the focus of this study. Quantitatively mapping porosity distribution at much higher resolution allowed ranking and high-grading of previously defined drill locations, improvement to optimally define infill locations, and identification of new, subtle stratigraphic traps. For Arenque and Lobina field areas, a novel workflow was applied, which had been tried and tested for carbonate reservoir description in fields worldwide. The important components of the workflow are described in Fig. 1.
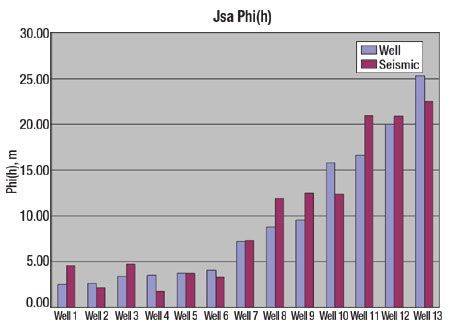
Geological review; Log editing and analysis. The study area lies in the Tampico-Misantla basin, northeastern Mexico, whose production initially began in the early 1900s from fractured Upper Cretaceous limestone, and soon afterward from karsted limestones encircling the Tuxpan Platform that forms the renowned Faja de Oro (Golden Lane) fields. Production was later established in 1956 from the Upper Jurassic carbonates and, in 1968, from the Jurassic San Andres carbonates within the Arenque field. Lobina field was discovered only recently, in 2003. The Jurassic limestone reservoir rocks were deposited in a shallow marine setting during the opening and early subsidence phase of the Gulf of Mexico. The San Andres Jsa formation comprises several intrafacies that were formed in the lows and on flanks of paleo highs, including grainstones, wackestones, packstones, mudstones and conglomerates, which often can be seen on seismic data by their acoustic signatures. Porosity development is key for productive wells, and is best developed in oolitic grainstone that formed in the shallow marine depths. Faults and paleo highs play a major role in controlling oolitic facies deposition, permeability and reservoir compartmentalization. Overall, 44 wells had long, logged sections of compressional sonic and density logs – essential to fully integrate surface seismic and well datasets. The main objective of this work component was to optimally edit and validate the sonic and density logs, producing reliable acoustic-impedance logs in the time domain. A multiwell, highly iterative editing process concentrated on the zone of interest from the Tertiary unconformity (Dmt) down to the well TD, usually the basement, but also extended all the way up to ensure a well-behaved depth-to-time function. Formation tops were used in well-to-well comparisons during the validation process. The final sonic log was calibrated to the checkshot data, and a smooth drift curve (log time-checkshot time) trendline was generated in each well, indicating that a reliable depth-to-time function had been achieved. Minor adjustments to the velocities were made to improve the tie with the seismic line around well locations. The final acoustic impedance in many of the wells was reliable and suitable for further integration with seismic data and calibration to porosity. Seismic interpretation; Post-stack inversion. The following are interpreted horizons for this study. The 21 Ma Miocene marker is the top of a thick (100 – 800 m) Tertiary shale unit, below which a prominent, easily recognizable (on high-resolution seismic) disconformity (the Dmt) occurs, defining the top of this study’s zone of interest. Beneath the Dmt and an intermittent dolomitized breccia lays the Cretaceous Tamaulipas inferior (Kti) carbonate, the secondary productive target in the study. Below the Kti is the basin’s source bed, the Jurassic Pimienta Shale (Jpi), and below this lie the primary target – the Jurassic San Andres carbonates (Jsa). The Jsa provides a significant acoustic event with an abrupt seismic velocity increase, especially compared to the overlying, slower Jpi shale. A top basement (Bas) beneath the Jsa is practically non-existent. To maximize the use of the recorded seismic frequencies, a robust post-stack inversion workflow was used. The components of this workflow have been thoroughly tested and successfully applied in numerous geological depositional systems and petroleum provinces worldwide. It has proven to be particularly beneficial in the prediction of primary porosity in carbonate reservoirs. The inversion workflow, which has several components that are discussed in an OTC paper,1,2 results in a trace-by-trace quantitative measure of absolute impedance that can be directly calibrated against the sonic and density product from the wells. Petro-acoustic calibration. The main producing interval of the primary targeted Jsa formation is the oolitic bank JKS3 member. Overall, the Jsa formation’s porosity ranges from zero in micritic mudstone rocks to a 27% maximum in the oolitic bank facies. Analysis indicates that there is no clay presence in the primary oolitc bank reservoir pore systems and that their pore-fabric varies mainly according to depositional variation. The secondary Kti formation shows from coring to have more heavily cemented oolitic bank facies. This, and the presence of other facies, add to its complexity, so porosity is not as well developed (20% maximum) and production relies more on pore-space connection by fractures. Petrophysical and core analyses were conducted on numerous wells, providing calculations for effective porosity, clay content and water saturation for the productive Jsa and Kti formations. These results showed that fluid content varied among wells, from gas, to light and heavy oil. Despite the varying fluid content and pore-fabric, the primary driver of the acoustic response, as shown by a detailed rock physics analysis within these carbonate rocks, is porosity. For both the Jsa and Kti formations, an increase in porosity corresponds to a decrease in acoustic impedance, as expected. However, for a given acoustic impedance value, the porosity in the Kti is lower than the Jsa. Lithology, pore-fabric and pore-fluid have an insignificant influence on the acoustic response within the Jsa formation, which is substantiated by its acoustic impedance vs. porosity crossplot showing very little standard deviation. Although the crossplot has more variance for the more complex facies of the Kti formation, there is still a strong dependency between acoustic impedance and porosity. The facies variations were not considered to be significant, in the gross sense, in that the crossplot still differentiates good porosity vs. poor porosity development. In a key step from seismic-acoustic properties to reservoir properties, the acoustic impedance to porosity relationship, derived from wells, is applied to the seismic data to produce acoustic porosity at each seismic trace. The function was tailored for the Jsa and Kti formations, separately, using rock physics analysis for more accurate quantification. Seismic porosity results were verified using the “blind-well” method, whereby wells not used in processing were compared to results. The absolute values matched very well, and good correlations between well logs and seismic were seen, adding confidence to the final output. Porosity mapping and evaluation. The enhanced resolution of the seismic data enabled the generated porosity volume to be used to its full extent. Within the Jsa formation, discrete porosity podding with oolitic bank geometries can be seen in section view. Mapping the maximum porosity between the gross top and base of the reservoir permits the calculation of the areal extent of individual porosity sweetspots. Within individual oolitic pods, clear porosity trends (consistent with the borehole information) show the internal architecture of the best reservoir units for targeted drilling. On a macro seismic survey scale, a porosity-height (phi-h) attribute can help in ranking future drill locations. Phi-h is a running summation of a seismic trace for the gross reservoir intervals. Therefore, a thick section of reservoir with high porosity will illuminate as an anomaly to the surrounding areas. Mapping these areas and using them, together with the seismic porosity sections, allows new prospects to be verified and drill targets more accurately defined. This effectively reduces risk and strengthens prospect ranking capability. Fig. 2 illustrates a comparison of well phi-h vs. seismic phi-h for several wells with good quality sonic and density logs. The excellent correlation is extremely encouraging. Most of the wells used in this comparison were not used for either the inversion or the calibration, and as such, were an excellent test of the quantitative aspects of the seismic data.
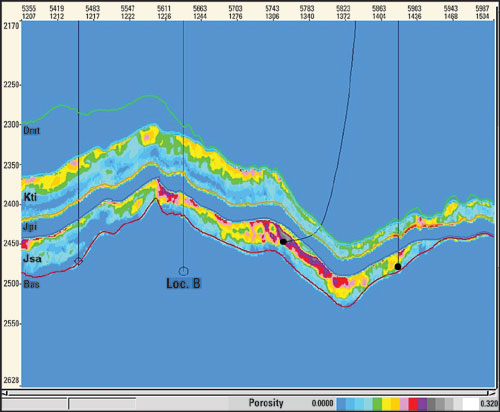
Pemex had previously identified four prospects within the seismic survey area that encompassed Arenque field, based on legacy seismic character and a structural interpretation. In a prime example of the use of the maps, the operator was assisted in ranking these four locations. With the new data, Pemex lowered the priority of two locations from its initial ranking while giving higher priority to the remaining two. The porosity development for location B is illustrated in Fig. 3, clearly showing significantly higher porosity development in the Jsa reservoir, thereby putting it at top priority to be drilled.
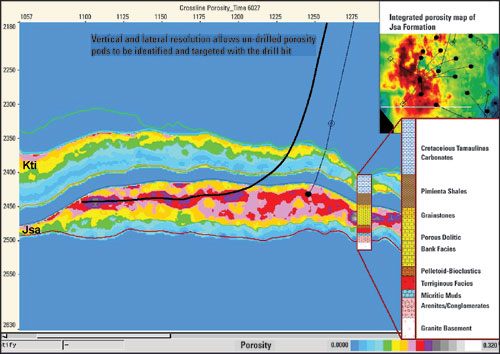
The data can also have a significant impact in defining infill drill locations and optimizing well placement in mature fields by giving a clear indication of untapped hydrocarbon potential. Map use provides the ability to clearly define individual geobodies, and thus potential infill drill locations, within a mature area like Arenque field. In another example, the enhanced vertical and lateral resolution allowed undrilled, discrete porosity pods to be identified and targeted with the drillbit to optimize well placement by maximizing contact with sweet spots within the porous oolites of the Jsa formation, Fig. 4.
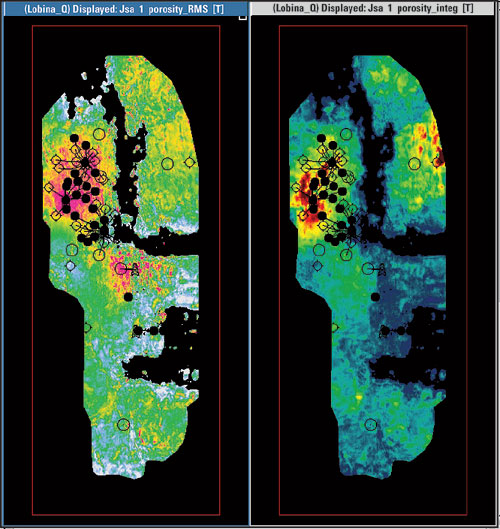
A summary of porosity development over the survey area covering both exploration and development potential is illustrated in Fig. 5. Here, the average porosity for the Jsa to basement is seen on the left and the integrated porosity on the right. These maps should be used in conjunction with the data in section and in 3D visualization to fully maximize the understanding of the porosity distribution.
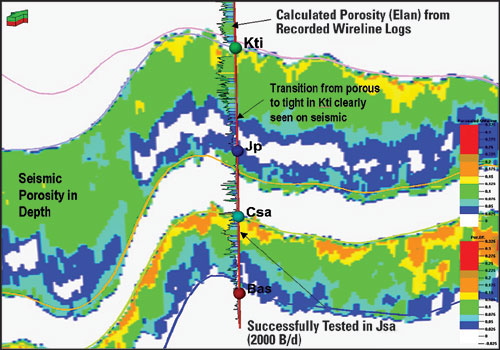
SUMMARY, FUTURE OUTLOOK The actionable reservoir description information provided by the new high-frequency, high-fidelity seismic data and fully integrated workflow enabled new prospect locations and infill opportunities in existing field areas to be identified, ranked and optimally placed. The “B” location in Arenque field, discussed previously, was drilled following the reservoir study. Excellent results have been seen with a superb character tie in the predicted porosity from seismic data with the measured well porosity, particularly in the Kti reservoir target, Fig. 6. Additionally, testing has shown the well to be hydrocarbon bearing from the Jsa formation, with 2,000 bopd production, making this an excellent step-out location from a mature field area.
This study had another immediate impact on development by enabling an optimal sidetrack to be drilled from a new appraisal well in the Lobina field area. In this well, the Jsa formation turned out to be much thinner (about 6 m) than interpreted using the 1996 data. The new data allowed placement of the sidetrack into a much thicker reservoir accumulation (35 m) more than 1 km away from the original borehole. Work continues between the teams to evaluate and use this data. Undoubtedly, wells yet to be drilled will benefit from the enhanced understanding and quantification of reservoir quality.
|
|||||||||||||||||||||||||||||||||||||||||||||||||||||||||||||||||||||||||||||||||||||||||||
- Advancing offshore decarbonization through electrification of FPSOs (March 2024)
- Subsea technology- Corrosion monitoring: From failure to success (February 2024)
- Prices and governmental policies combine to stymie Canadian upstream growth (February 2024)
- U.S. producing gas wells increase despite low prices (February 2024)
- U.S. drilling: More of the same expected (February 2024)
- U.S. oil and natural gas production hits record highs (February 2024)
- Applying ultra-deep LWD resistivity technology successfully in a SAGD operation (May 2019)
- Adoption of wireless intelligent completions advances (May 2019)
- Majors double down as takeaway crunch eases (April 2019)
- What’s new in well logging and formation evaluation (April 2019)
- Qualification of a 20,000-psi subsea BOP: A collaborative approach (February 2019)
- ConocoPhillips’ Greg Leveille sees rapid trajectory of technical advancement continuing (February 2019)

