Offshore Report
Analyzing dynamic positioning incidents
IMCA released a report that details the number of DP incidents, categorizes them, and in the process, tries to help operators stay on station.
Compiled by Perry A. Fischer, Editor
If you’ve ever toured a modern drilling or deepwater service vessel, when you get to the wheelhouse, you are usually shown the latest and the greatest Dynamic Positioning (DP) equipment – computers, monitors, GPS, backup power supply, and so on. The impression is that the systems are so redundant that station-keeping failures would be exceedingly rare. Operators know from experience that is not the case. However, each incident is unique, and making sense of them, over time, requires a special data gathering and analysis effort.
The International Marine Contractors Association (IMCA) is the international trade association representing offshore, marine and underwater engineering companies. The organization recently released a report that provides a wealth of data about DP. That report, summarized here, was prepared for IMCA, under the direction of its Marine Division Management Committee, by Global Maritime.
Global Maritime was tasked with analyzing IMCA’s DP station keeping incident data collected over the 1994 to 2003 period. This analysis extends the work already carried out annually to help determine trends and provide more detailed analysis on underlying causes.
MAJOR FINDINGS
One of the major conclusions was that the majority of DP incidents had more than one secondary cause, and that the more serious incidents, termed LOP1, tended to have more secondary causes than the less serious, LOP2, incidents. These additional secondary causes were usually associated with human factors, such that over 97% of incidents might have been reduced or eliminated by attention to these human-related causes.
Within the three categories of blackouts, thrusters and operator error the report shows:
- For blackouts, before 1999, the vessels that reported blackouts were roughly split between DSV, ROV, drilling and pipelay activities, but from 2000 onwards, 60% of the reported full and partial blackouts came from drilling vessels.
- For thrusters, a control failure of one thruster caused on average 17.5% of reported DP incidents. Most of these come from the pitch control of Controllable Pitch Propeller (CPP) thrusters; none were found from speed-control failures.
- For operator error, the DP operator-triggered incidents dominated, as expected, but the analysis tried to find evidence of good and bad DP operator action. Some evidence of both was found.
FMEA. With the effectiveness of Failure Modes and Effects Analysis (FMEA) in mind, the data was searched to see how many incidents were triggered by a single failure. Figure 1 is the result of that analysis.
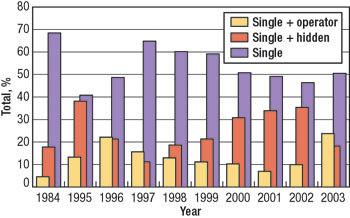 |
Fig. 1. Incident by failure type: Single + operator, Single + hidden, Single.
|
|
What was a more powerful FMEA conclusion, however, was that 97.6% of incidents had already occurred at least once before. That is, if an FMEA only considered reported incidents, the analysis would, on average, identify 97.6% of the likely DP-incident trigger causes. A comparison of the incidents reported by the different types of DP vessel has been made. While there are differences, it is likely that these are, in part at least, because of the type of work, and what is considered an incident depends on the consequences of a loss of position.
DP class type. The idea of grouping DP Class I, II and III was that, in terms of position loss, they would be “safe,” “safer” and “safest,” respectively, because of more reliability (equipment redundancy), and because of the different work these vessels would carry out. The continued validity of this concept was considered within the report.
No DP Class I vessels are included in the report, although many DP Class II vessels have reported incidents when they have not been operating in accordance with DP Class II requirements, but this is not quite the same. So the only point that could be examined is whether the installation of the equipment separation required by DP Class III has had a marked difference on the type and severity (major/ minor position loss or large excursion) of DP incidents.
From the incident data, there is no apparent difference on a first pass. A second pass was made to see if units with DP Class III notation and very high levels of thrust and power redundancy failed less than vessels with lower redundancy margins. The data did not support this. In fact, there was evidence that the full potential of this additional redundancy (and hence reliability) was not being used. The authors then searched their own data and found a number of occasions where DP Class III would have made a difference; in each case, the failure mode was an engine room fire on a DP Class II vessel. In each case, the consequences of the fire did not cause any significant pollution or injury to personnel.
Thus, the conclusion is that the only reasonable benefit of DP Class III is that it separates engine rooms, and that this is of small benefit in terms of position loss. No evidence could be found to show that the back-up DP control system had been used in earnest to stop a loss of position.
CATEGORIZATION AND DATA
Incident severity data collated by IMCA has been historically categorized into three levels of severity:
- Loss of Position 1 (LOP1) – major loss of position
- Loss of Position 2 (LOP2) – minor loss of position
- Lost Time Incident (LTI) – downtime through loss of redundancy, no loss of position.
For the purpose of the study, it was agreed that the analysis be limited to incidents resulting in a loss of position, because lost time incidents, although important in their own right, would not help to improve the levels of station-keeping incidents.
Trigger causes. The incidents reported were categorized into trigger causes (initiating events), defined as a fault that starts or results in a position loss, and secondary causes, defined as causes that could be attributed to the incident or complicate the position-loss recovery. The triggering (initiating) events have been historically split into the following types:
- DP computer – DP computer software or hardware fault
- Reference – Reference system or sensors (gyro, VRU) fault
- Power generation – Generators, power management, synchronization fault
- Thruster – Thruster control, mechanical, rudder, etc. fault
- Electrical – Switchboards, UPS, control voltage, etc. fault
- Environment – excessive wind, wave or current
- Operator error – DPO, Electrician, ERO, etc. fault
- Other – other vessel, 3rd party, external force, etc.
For analytical purposes, it was decided to redistribute the category other across the remaining categories for a first assessment.
General incident data. A total of 371 incidents had been reported and analyzed in the 10-year period, with 158 LOP1 and 213 LOP2 type position losses, Figs. 2 and 3.
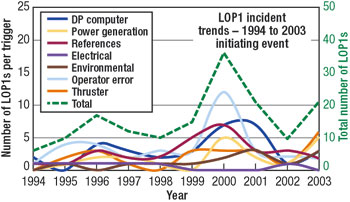 |
Fig. 2. Number of LOP1 incidents: initiating events. Trends from 1994 to 2003.
|
|
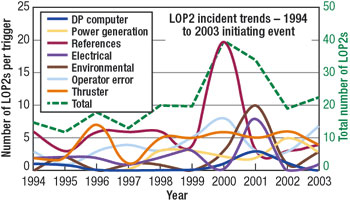 |
Fig. 3. Number of LOP2 incidents: initiating events. Trends from 1994 to 2003.
|
|
Focusing just on the totals (the dashed line, right-hand scale), there were generally more of the less serious LOP2 incident triggers – some 8% more – than LOP1 events. LTIs (not shown) number even more than LOP2s.
In addition to wide variation, the above figures show that the total number of LOP1 and LOP2 incidents is slowly increasing, in part, because of an increase in DP vessels. The data is atypically high in 2000, when operator error and references increased dramatically. This jump can be partly explained by DGPS scintillation, which caused many incidents in West Africa, Brazil and the Gulf of Mexico, and partly by a greater level of attention given to the collection of incident data in that year.
The effect of inconsistent reporting can be seen throughout the data, where increased reporting by an operator, or a one-time supply of incident reports from one operator with several vessels, is not continued in the same quantity, or ceases completely. This phenomenon is also evident within the offshore tanker fleet, where inclusion of this data part way through the 10-yr period accounts for a large jump in the number of incidents after some unexpected position losses.
While reporting consistency cannot easily be addressed after the fact, the data can be normalized for variances in activity levels. The resulting “spaghetti,” Fig. 4, brings out three more incident trends: operator error, references and DP computer.
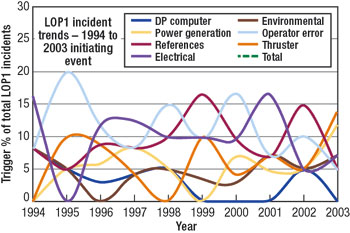 |
Fig. 4. Normalized LOP1 trends: Operator error, references and DP computer are more prominent.
|
|
When the LOP2 trend is normalized, operator error and references again are the most prominent, but there are some differences, with thruster becoming more dominant, and computer-related incidents occurring less often, Fig. 5. This is mainly due to the nature of redundancy within references and thruster and their general impact on the severity of a position loss.
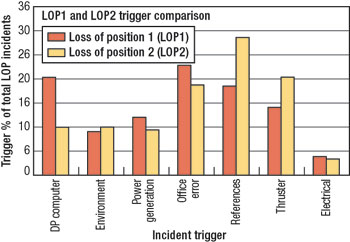 |
Fig. 5. Normalized LOP1 and LOP2 compared. Operator error and references are prominent for both, but thruster takes the place of computer-related incidents for LOP2.
|
|
SECONDARY CAUSES
An analysis was conducted for secondary causes to position loss. Every incident that results in a position loss can be attributed to additional causes, which are classed as equipment or human factors. Lost time incidents, are different and often only possess one trigger. No secondary causes are applied with LTIs.
For many incidents, there is more than one secondary cause that can be readily attributed. Most of these are human factors. For LOP1, these human factors are 63%; for LOP2, 54%. Across 10 years of data, the number of incidents identified as having additional secondary causes is shown Table 1. Two secondary causes were the most common cause of incidents.
| TABLE 1. Summary of secondary causes. |
 |
|
Secondary causes from human factors are broken down into the categories poor procedures, poor design, insufficient testing/ commissioning/ QA and operator error, Table 2. There is strong evidence that some major position losses could have been reduced to minor position losses, and that some minor position losses could have been restricted to lost time incidents. This factor is significant, in that almost every incident involves human factors at some point; only six of the total 371 did not, which suggests that over 97% of incidents might have been reduced or eliminated by attention to these human factor-related causes.
| TABLE 2. Human factor secondary causes. |
 |
|
CONCLUSIONS
The conclusions are briefly discussed by category below.
LOP1 and LOP2 incident model comparison. On average, all the incidents could be attributed to secondary causes. The difference between LOP1 and LOP2 incidents is that the LOP1 show more secondary causes than LOP2. This is expected, since the more serious incidents are often the result of many more influences. The less serious LOP2 incidents generally give less detail on which to attribute more secondary causes. Also, less serious position losses, which have been arrested by the operator, are often simple to correct.
The relevance of secondary causes such as poor procedures, poor design, poor maintenance and insufficient testing/ commissioning/ QA are that they all involve human factors. Assigning an additional secondary cause such as electrical is simple and can be easily classified; however, even in this case, the underlying causes of the failure can be from human factors. This reinforces the need for this DP incident work to find any technical cause, and to find the most important human factor cause. This should be a future focus of incident analysis work.
Blackouts. Electrical blackouts and partial blackouts continue to occur even with advances in generators, switchboards and power management systems. The number of incidents and the number of vessels using DP has increased over the last 10 years, and this could be why the number of blackouts (full and partial) reported has increased, combined with the fact that very few DP vessels have been scrapped. Nevertheless, there is a step change increase between 1999 and 2000.
Between 1994 and 1999, the vessels that reported blackouts were roughly split between the DSV, ROV, drilling and pipelay vessel types, with no one type dominating. From the year 2000 onward this changed; 60% of the reported full/ partial blackouts came from the drilling industry. The contrast was marked because well stimulation, production, offshore loading, geotechnical and multi-purpose vessels were included in the reporting group in the later years, which emphasized the dominance of DP drilling vessels. This coincided with an increase in deepwater DP drilling activity from old, as well as new, MODUs.
The status of the bus tie breaker (or breakers) for the main bus has an influence on the blackout level. The data shows that a full blackout is more likely when set up with a closed bus tie. It is important to note that the blackout cause for many of these incidents was avoidable with the bus tie closed, and one cannot be sure that a blackout would have been avoided if the bus tie had been open. Blackouts have also occurred with the bus ties open.
For partial blackouts a closed bus tie would reduce the chance of a partial power failure. Since 2000, the level of influence of the bus tie has dropped because it has little control over the partial loss of electrical power.
Thrusters. In percentage terms, the number of incidents caused by thruster failures is high, especially when all of the rules since the advent of DP are written to prevent the failure of a single thruster from causing an LOP. However, a closer examination shows that none are from frequency drives, and this has been a major advance for DP vessels.
The trend for thruster failures causing an LOP is not decreasing. Until the number of reporting vessels using CPPs decreases, this is likely to be the future trend. The effect of a single thruster failing to unwanted thrust also depends on the number of thrusters online. Decreasing the number of CPP thrusters online increases the heading and position loss effect from the failure of one CPP control system.
Operator error. Electricians and electronic technicians have historically not triggered reported incidents. However, in the last few years, this has been more evident. This is mainly due to testing and investigations taking place on critical systems while the vessel was still working on DP.
Incident type. Single failures that cause an incident averaged 60% of the total recorded, more than double that of Single + Hidden and four times that of Single + Operator, Fig. 1. The main conclusion from this analysis is that concentration on single point failures is very important but it is not enough.
Position references. Much of the incident data is adequate to show that the vessel was not set-up in the safest way or according to present good practice. It is possible that the incident form was not completed accurately. In many cases, the vessel has to be known quite well to understand the data provided. In other cases, it is clear that the set-up was not considered important, because the LOP consequences were acceptable.
By knowing and looking for past failure modes, 97.6% of incidents can be identified. Some FMEAs have been found to be inadequate because they missed “new” failure modes, while DP incident reports show that nearly all incidents are from well-known failure sources. An FMEA that successfully documented all the known failure modes applicable to a particular vessel would, on average, be 97.6% correct.
Vessel type. Cable/ pipelay vessels are more likely to suffer from DP computer software triggers, since their DP software was designed more for holding position than track-follow. Drilling incidents are dominated by power generation failures, due to deepwater operations and fluctuating loads from drilling equipment. References have been a frequent incident cause because of deepwater and the issue of scintillation/ sun spots.
Dive support vessel incidents are led by thruster failures due to the age and design of the fleet, and the importance of tight position control. Multi-purpose vessel incidents are dominated by operator error and reference incidents. The trend is similar to cable/ pipelay, although the type of operations should lead to a closer resemblance to DSV work.
ROV work is dominated by reference incidents, because the operations are predominantly away from fixed structures, and the consequences of position loss are less relevant, so less than three systems are often used.
Offshore loading, dominated by reference and thruster incidents, has a strong element of environmental induced events, which separates this vessel type from the others examined.
There appear to be differences in the failure modes of the different vessel types, but this could be an effect of reporting. A failure has to be a serious enough matter to the vessel and key DP personnel for it to be an incident, and whether it matters or not depends on the work and the consequences. 
Editor’s note: The full 53-page report is available to IMCA members at nominal cost or can be downloaded free of charge from the members-only section of the IMCA website at www.imca-int.com. Non-members can purchase it for £100 plus shipping and can be ordered from publications@imca-int.com.
|

