52nd Reed Hycalog Rig Census
Utilization of rig fleet tightens significantly
Significant gains were made in US and Canadian land fleet sizesand utilization, spurring rig construction. Tracked for the first time,international markets saw growth in utilization, while the global offshore fleet experienced a tightening of numbers.
Steve Berkman and Tory Stokes, ReedHycalog, Houston
Record oil and gas prices during the past year resulted in a dynamic rig fleet, according to the 52nd annual ReedHycalog Rig Census. The number of available rigs in the US and Canada rose again this year. The US rig fleet was up about 2%, and the Canadian fleet gained 9%, compared with 2004. However, the census indicates that the global, offshore mobile fleet decreased 10%. Fleet utilization during the spring census period tightened in all areas, with US utilization now reaching levels common in the early 1980s.
This is the second year that ReedHycalog has worked with RigData to compile the US census, Nickle’s Rig Locator to monitor Canadian activity, and ODS-Petrodata to summarize the global, offshore mobile rig fleet. We have also taken our first look this year at characterizing the international land rig fleet. It is our belief that as we continue to expand our scope and refine the methodology, this information will become a more useful barometer of the drilling industry’s state.
CENSUS STATISTICAL HIGHLIGHTS
Several key statistics from this year’s census include the following:
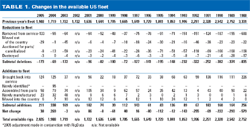
- The US fleet had a net gain of 38 units this year, expanding to 2,026 rigs from 1,988. This net increase results from 211 rig additions and 173 deletions during the past year, Fig. 1.
- The largest gain to the US fleet, 124 units, was due to rigs brought back into service after being inactive. However, a large number of rigs, 133 units, was removed from service, offsetting this gain.
- The number of US rigs meeting the census definition of “active” was 1,920. This compares to 1,674 last year, an increase of 15%.
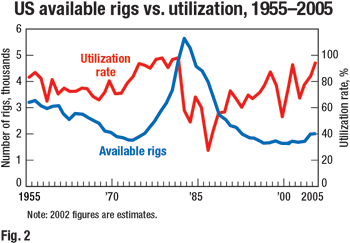
- US rig utilization shot up to 95% this year from 84% in 2004, Fig. 2.
- Based on recent US activity, day-work contracts continue to be the most prominent of all drilling contracts at 82%, gaining an additional five percentage points since last year.
- The number of US drilling contractors increased by 13 this year to 226, as more companies found it economically viable to operate rigs.
- Contractor survey results indicate that 77 refurbished and 73 newly manufactured units will enter the market during the next 12 months.
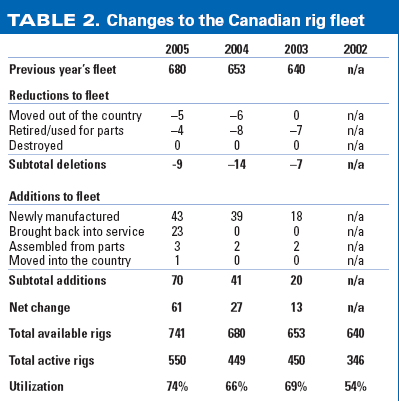
- Canada’s rig fleet reached another record high, up to 741 units from 680. This includes 43 newly manufactured rigs that were additions to the census.
- Canadian utilization climbed to 74% from 66% during the spring census period.
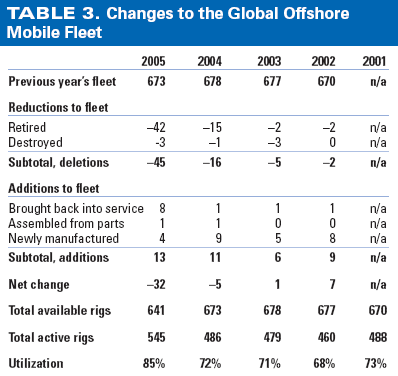
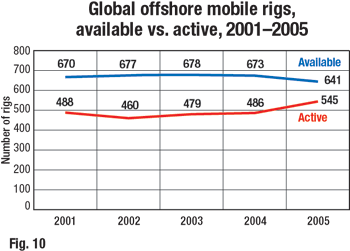
- The global, offshore mobile fleet decreased 10% this year, to 641 rigs versus 673 units in 2004. This decline was due primarily to rigs removed from service, due to long-term inactivity and cold-stacked status.
- Global, offshore mobile utilization rose to 85% in 2005, from 72% in 2004.
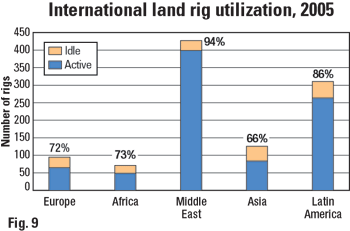
- Outside the US and Canada, utilization was 83% in 2005, with the Middle East showing the highest utilization rate for land rigs at 94%.
 |
 |
RIG AVAILABILITY
During the past few years, the drilling industry has mobilized additional rigs to meet growing incentives, due to strong commodity prices. This market upswing has even spurred contractors to reactivate rigs that have been idle for some time.
US rig reactivation expands the fleet. The US fleet gained 211 rigs in 2005, due to improved market conditions. This is a significant number of rigs entering the fleet, but fewer than the 338 added in 2004. However, 95 of the rigs added in last year’s census were considered “newly identified,” because the owners had not been in previous census tabulations. The 211 rigs added to the fleet this year more than offset reductions to the fleet. Fleet additions fall into one of four categories, Table 1:
 |
| Table 1 |
|
Click image for
enlarged view |
|
|
- Rigs brought back into service after being inactive
- Rigs assembled from parts
- Newly manufactured rigs
- Rigs moved into the country
The number of US rigs brought back into service was essentially the same this year, 124 units versus 125 reactivated in 2004. All of these rigs had been accounted for in previous years, but they were subsequently removed, due to becoming inactive or inoperable. With prices strong and capital readily available, owners are now finding it profitable to put some of their older units back into service.
Units assembled from component parts numbered 58 this year, down from the 79 rigs built from parts in 2004. As industry conditions warrant, many rigs auctioned for parts or cannibalized in prior years are later refurbished. The volume of idle equipment useful for reconditioning seems to be declining, and rig demand is now often met by newly manufactured units.
A significant number of newly manufactured rigs has entered the US market for the third year in a row. Twenty-three brand new units were added to the fleet this year, bringing total new additions during the past three years to 103 rigs, or about 5% of the entire fleet. Of 23 new rigs added this year, owners reported building 22 new land rigs and one barge unit. These units’ operating efficiency is increasing profitability and finally revitalizing an aging fleet. It is interesting to note that just 48 newly manufactured rigs entered the US market during the 14-year period between 1988 and 2001.
Six rigs were brought into the US from other countries during the 2005 census, compared with seven in 2004. Rig movement out of the US is covered below.
MARGINAL US RIGS
REMOVED FROM SERVICE
Although stronger commodity prices have prompted drilling contractors to reactivate many rigs, despite their age, attrition is still affecting the fleet to a large extent. Rigs removed from the US fleet over the past year totaled 173 units, a significant increase compared with the 69-unit drop in 2004, but more in line with the 2003 numbers. Deletions were reported in four categories, Table 1:
- Rigs removed from service
- Rigs moved out of the country
- Rigs auctioned for parts or cannibalized to keep other units working
- Rigs destroyed
Census rules have always excluded rigs from the available count that have been stacked for a significant amount of time or that require a large capital expenditure to be operable. Beginning last year, two categories, “Stacked > 3 Years” and “Large Capital Expenditure Required,” were combined and renamed “Removed from Service.” These categories were joined, since it often became difficult to determine which was the most appropriate reason for removal from the fleet. This year, 133 units were removed from service, compared with 55 rigs in 2004.
Rigs auctioned for parts, or cannibalized to support other units, numbered just eight units in the 2005 census, down from 13 in 2004. Rigs in this category have dropped over the past two years. It is likely, however, that many of the 133 rigs recently “removed from service” will soon be parted out and used to build new units that will reenter the fleet in the future as rigs “assembled from parts”.
Rigs typically move into and out of the country, and these units are tracked in the census each year. Non-US markets, especially Mexico, are experiencing strength similar to the US, as 29 units (7 land, 22 offshore) left the country this year. This is a significant increase compared to the one unit deployed in 2004. Considering that 29 rigs moved out of the country this year, while six moved in, there was a net decline of 23 units resulting from rig moves.
Rigs that were destroyed comprise the last category for deletions. Owners reported three offshore units sustaining irreparable damage, either from blowouts or hurricanes during the past year, compared with none during the 2004 census.
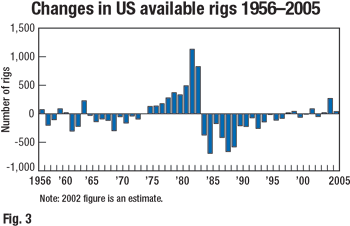
Total rig additions numbered 211, while deletions totaled 173. Therefore, the net change in the rig fleet over the year was a 38-unit increase, showing favorable operating conditions for the second consecutive year, Fig. 3.
CANADIAN RIG BUILDING CONTINUES
This is the second year that the Canadian market has been included in the ReedHycalog census. Working with Nickle’s Rig Locator for the past two years, some history has also been compiled, so that comparisons can be made. Canada’s numbers continued to improve in 2005, with the fleet gaining 70 units, primarily through rig building and reactivation. Last year’s increase was just 41 units. Newly manufactured rigs numbered 43 units this year, compared with 39 in 2004. Positive drilling conditions spurred increased activity this year, and 23 rigs were reactivated, compared with none for the past few years. Also added to the Canadian fleet this year were three units assembled from parts, and one rig that moved into the country.
Reductions to the Canadian fleet for 2005 totaled nine units, with five rigs leaving the country and four being retired or used for parts to keep other rigs running. Subtracting these nine units from the 70 additions leaves a net increase of 61 rigs, and a total available rig count of 741. This is an overall 8% increase and another record year for rig availability in Canada, Table 2.
OLDER OFFSHORE RIGS RETIRED
The Global Offshore Mobile rig fleet had an aggregate decline of 32 rigs, or 5% this year, to 641 units, versus 673 rigs in 2004. Although there were some additions this year, the overall fleet size was scaled back, due to a number of rigs that census takers ascertained should not be considered available. Information provided by ODS-Petrodata assisted in determining that these older rigs were retired. Therefore, they were removed from the census, due to their long-term stacked status and inability to be reactivated quickly.
If the current, favorable drilling conditions are not able to pull these rigs back into active status, it is unlikely that they will ever re-enter the market. The number of retired, global offshore mobile rigs was 42 this year, versus 15 in 2004. In addition, three rigs were considered destroyed and were removed from the fleet, Table 3. On a side note, these numbers do not include the rigs that will be removed from next year’s census, due to damage from Hurricane Katrina that occurred after the 2005 census was taken. Not all damage estimates had come in at the time of this writing, but it was anticipated that at least five offshore units, and possibly more, were considered either significantly damaged or destroyed by the storm.
On the positive side, 13 rigs were added to the global offshore mobile fleet this year. Eight of these were brought back into service after being reconditioned. Four were newly manufactured, and one was assembled from parts.
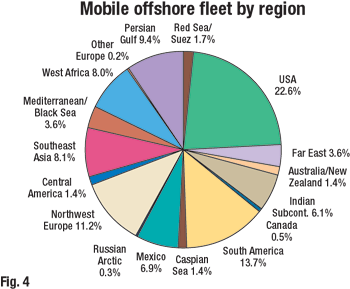
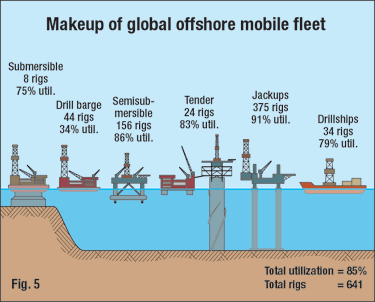
The global, offshore mobile fleet is widely distributed, with the US still dominating, followed by South America, Northwest Europe and the Persian Gulf, Fig. 4. The makeup of the fleet by rig type is shown in Fig. 5, but it does not include platform and inland barges in the distribution.
RIG ACTIVITY
As anticipated, the active rig count climbed again this year, as the industry reacted to further increases in commodity prices. With the US and Canada leading the way, utilization improved in most areas of the world.
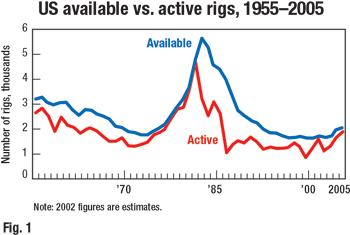
US drilling activity and utilization continue to rise. The methodology used to count active rigs for the ReedHycalog census is different from other active weekly rig counts that record units drilling during a single day. The census counts a rig as active, if it has “turned to the right” any time during a defined 45-day period (this year’s period was between May 4 and June 17). Therefore, the ReedHycalog statistic will always be higher than other reported counts, because a longer time period is used to monitor rig activity. Census statistics for 2005 show an active count of 1,920 rigs, a 15% increase over the 1,674 rigs identified as working in the last census.
The 106 available rigs that were not drilling during the census period were classified according to the length of time they have been idle. Rigs stacked less than one year numbered 59; one to two years, 26; and two to three years, 21. Census aging rules state that any rig stacked for longer than three years will be removed from the available fleet. Rigs removed from the fleet for this reason will fall into the deletions category, “removed from service.”
Another figure often quoted in the census is that of full-year utilization, which is the total percentage of available rigs that drilled sometime during the past year. Adding the 59 rigs stacked less than one year to the 1,920 active units in the census provides this number. The full-year utilization figure indicates that 1,979 out of 2,026 units, or 98% of available rigs, were put to work by rig owners over the past year, as compared to 91% in 2004.
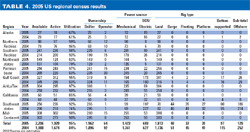
Every census region reported more rigs working than a year ago. This regional breakdown, comparing data for 2004 and 2005, is in Table 4. The ArkLaTex region experienced the largest increase in active rigs, up 63 units for 2005.
 |
| Table 4 |
|
Click image for
enlarged view |
|
|
Rig utilization, the supply-and-demand balance of rigs, is often an indicator of industry health. This ratio of active to available US rigs rose sharply this year to 95%, up from 84% in 2004. This market tightening market was expected, as the industry is rejuvenated and economic conditions improve.
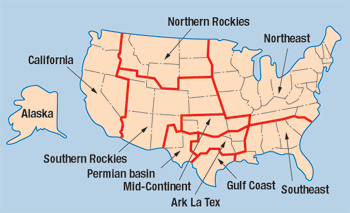
Although not every US region reported increased rig availability this year, each experienced improved utilization for 2005. Utilization figures for each region are as follows: Alaska, 67%; Northern Rockies, 99%; Southern Rockies, 98%; Northeastern states, 83%; Permian basin, 97%; Gulf Coast, 95%; ArkLaTex, 97%; California, 85%; Southeastern states 92%; and Mid-Continent, 98%. Certainly, the Rockies, as well as other areas reporting rig utilization in the high 90s, are feeling the effects of demand exceeding supply for many specific rig types or locations.
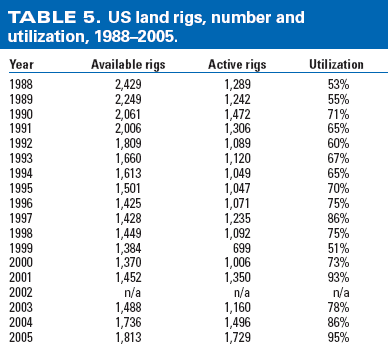
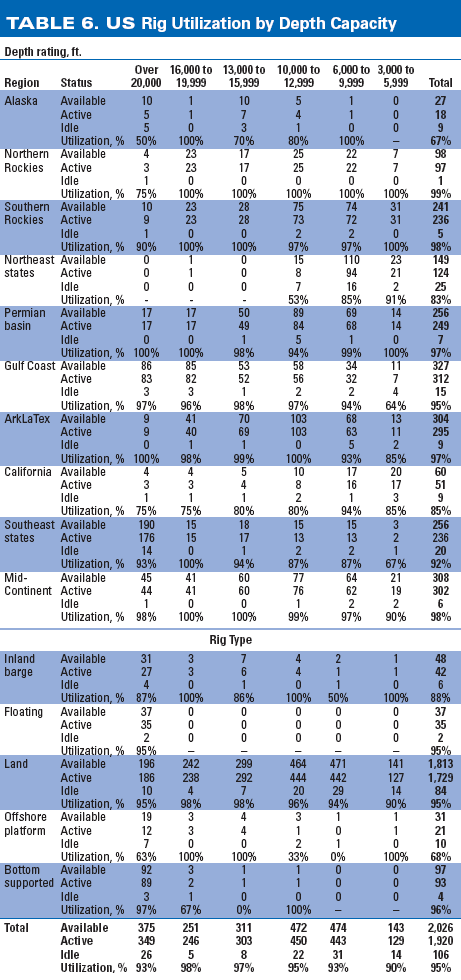
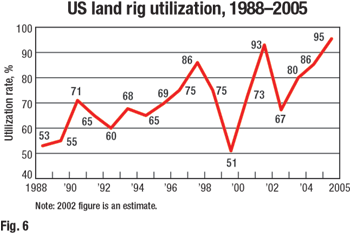
Examining US land and offshore rigs separately, gross utilization for land rigs rose to 95% from 86% in 2004, Fig. 6, Table 5. The US offshore utilization ratio continues to fall behind the land rig ratio, but it jumped considerably over the past year, up to 90% from 71%. Bottom-supported jackups are still in greatest demand, according to census results, and their utilization rose to 96% from 77% over the past year. Units showing the lowest utilization remain the platform rigs, at 68%, but this is still a significant climb from 46% in 2004. Rig availability broken down by depth capacity showed that units in every depth range experienced utilization increases, with the deepest rigs showing the most improvement. Units rated to drill deeper than 20,000 ft now have 93% utilization, compared with just 70% a year ago, Table 6.
 |
 |
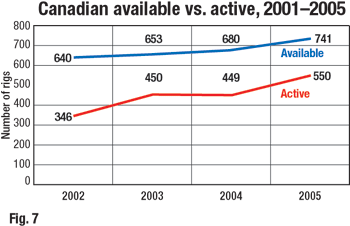
Canada sees big increase in working rigs. Canada reported 550 rigs as active during the census period of May 4 to June 17, 2005. This was a 22%, or 101-rig increase, compared to the same time period in 2004. The Canadian utilization rate also climbed to 74% from 66% in 2004, Fig. 7. This is attributed to a brief winter, followed by a short spring break-up that prompted increased drilling during the second quarter, when the census is taken.
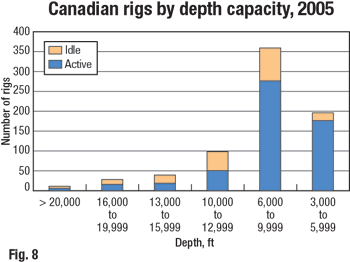
The bulk of Canada’s active and available fleet resides in the 6,000-to-9,999-ft range. Fleet availability and activity by depth capacity show that utilization is highest in the 3,000-to-5,999-ft range (90%) and lowest in the 13,000-to-15,999-ft range (48%), Fig. 8.
 |
International land rig activity now tracked. This was ReedHycalog’s first year to track international land rigs, and this effort has yielded some interesting results. Utilizing simpler criteria for tracking these units, active and available rigs were counted without using the 45-day timeframe of the historic US, Canadian and mobile offshore statistics. It is important to note several distinct differences in the international regions, compared with the US and Canadian rig markets. In some cases, available rigs are actually under contract awaiting a project start, and are realistically unavailable for other work. Also, some areas have large numbers of available rigs, but these are older technology units. It is questionable whether these rigs are available to move and are marketable outside their home areas.
Utilization rates, with breakdowns between active and idle units, are shown in Fig. 9 for the primary international regions. The Middle East has the highest utilization rate, 94%, followed by Latin America, 86%; Africa, 73%; Europe, 72%; and the Far East, 66%.
Utilization figures for China, Russia, and the former Soviet Union (FSU) have been excluded from the census this year. Their geographic extent and market diversity are presently barriers to accurate estimates of active and available rigs. It is our intent to improve on these estimates in the future and include them in this report. Available rig numbers for Russia and the FSU vary greatly, but range between 250 and 400 rigs. The Chinese market count is estimated to be about 1,000 operational rigs, with an additional 100 units working in more than 20 countries, including the US.
GLOBAL OFFSHORE UTILIZATION INCREASES
The global offshore mobile fleet (excluding platform and inland barge rigs) experienced an increase in activity and utilization during this census period. Total working rigs numbered 545 units, versus 486 in 2004. This 12% surge in activity, combined with a decline in available rigs (due to many older, inactive units that were removed), resulted in much stronger utilization than anticipated. Utilization actually rose 13 percentage points, from 72% to 85%, Fig. 10.
OTHER US INDUSTRY TRENDS
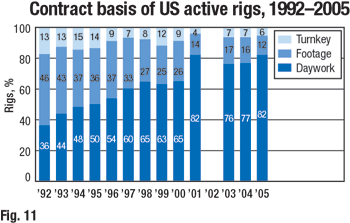
As commodity prices climb and spending budgets follow suit, the types of drilling contracts covering the active rig fleet also swing. Taking a snapshot of data on the last well drilled by each rig in the US census, day-work terms climbed to 82% of all contracts, up from 77% last year. Footage contracts are now just 12% of the total, and turnkey deals make up about 6% of all contracts, Fig. 11.
 |
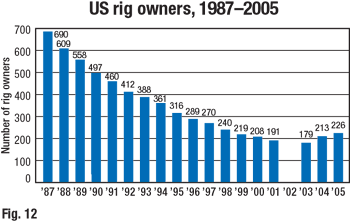
For many years now, the drilling industry has experienced consolidation, due to mergers and acquisitions. Although this trend certainly continues, the 2005 census has also tracked a number of new, small companies entering a rejuvenated industry. Last year’s numbers indicated that this might be happening, but the increase was actually thought to reflect a more accurate survey technique instead of a new industry trend. Now, it is believed that a number of companies entering the 2005 census for the first time are actually new starts. Time will tell whether this is a true trend reversal or not. This year’s total of US rig owners is 226, up from 213 in 2004, Fig. 12.
 |
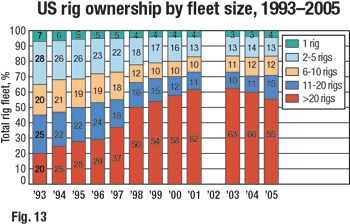
Contraction of rig owners generally puts more units in the hands of larger rig owners, and, likewise, the reverse is true. With additional companies identified as having rigs, our statistics reflect that the larger US companies (those that own 20 or more rigs) now hold just 55% of the total fleet, down another five percentage points from a year ago. US companies holding 11 to 20 rigs, and those with just one rig, both saw percentage gains, Fig. 13. Drilling contractors remain the owners of most US rigs, owning 97% of all units, compared with 95% in 2004.
CONTRACTORS EXPECT INDUSTRY STABILITY
A survey of drilling contractors is conducted about the same time as the rig census is taken each year. This survey often uncovers interesting viewpoints regarding the state of the industry. Contractors were asked to rank issues of importance and estimate a number of changes to their business, some comparing this year to last year. Fifty-two firms chose to participate in this year’s survey, about 23% of all contractors and representing roughly one-quarter of the aggregate US fleet. Surveys were received from companies having rigs in every US region, with a few also representing the Canadian market as well. These contractors were a wide mix of large, medium and small companies.
For the past 15 years, respondents have been asked to rank issues by importance to their business. The number one contractor concern this year was “crew availability.” This issue often ranks in the first or second position. Even as rig rates improve, a sustainable, skilled workforce still seems elusive. The second highest concern was availability of rig parts. Apparently, in today’s tight, technically challenging drilling market, it is difficult to maintain a reliable source of rig parts to keep the fleet at maximum operating capacity. Although rig rates are always a concern, they fell to third this year in the improved drilling environment.
Drilling contractors reported their active rigs to be up an average 18% compared with last year. Land rig rates, specifically, are up about 22% for US respondents. According to survey data, land rig rates in actual dollars have averaged $10,541 per day during the May-June 2005 period. Offshore contractors said their rates are up a more modest 10%.
Most contractors continue to cite elevated expenses for maintenance and labor. On average, they expect maintenance costs to be up another 18% this year. This seems to climb annually and explains the reason that rig rates remain a concern, even when market conditions appear favorable. Many contractors reported increases in crew labor rates as well, with an average jump of 11%. Contractors were also asked about their percentage of tubular goods replacement for 2005, since this is their largest non-rig expense. The average replacement amount was 16%, of which 35% came from inventory and 65% came from new purchases.
When contractors were asked at what level oil and gas prices needed to drop below to have a negative effect on their business, they estimated, on average, $30.10/bbl for oil and $4.00/Mcf for gas. This, in itself, indicates optimism, since more industry experts expect prices to stay at current levels or above in the near term.
NEWBUILDS
US drilling contractors were generally upbeat when asked about their five-year plans. Existing rig utilization rates have pushed newbuilds to the forefront, and an encouraging 57% of all respondents plan to expand their fleets in the next five years. Expected additions during the next 12 months for all 52 survey respondents include 77 refurbished rigs and 73 newly manufactured units. Other sources indicate that US-based contractors are expecting about 200 newbuilds to enter the market during 2006. The number of those rigs that will remain in the country is unknown.
During the next 12 months, Canadian sources have indicated that 25 to 30 newbuilds are anticipated to come onboard. The offshore market will not be able to react as quickly, due to construction lead times, but it is estimated that more than 35 jackups are planned over the next five years. Two to three semisubmersibles will come online during the next couple of years.
FURTHER US UTILIZATION
INCREASE PREDICTED
Most rig owners see the future of the drilling contracting industry as stable and believe that activity will stay strong over the few years. Improved commodity prices and rig rates are encouraging contractors to continue to add to their fleets by refurbishing rigs and building newly manufactured units. Therefore, if attrition runs at a similar rate as in the past few years, and some further strengthening of the industry occurs, ReedHycalog believes that the US available rig count will climb even further in 2006, possibly another 3%. The active US rig count should increase also, maybe by 5%. Based on this forecast, the utilization rate would improve slightly, to 97%. This may be the maximum level that the US market can achieve before a large-scale rig-building boom commences. 
ACKNOWLEDGMENTS
The following are recognized for their contributions to this year’s rig census: Michael Wayne (RigData); Richard Mason, Delores Mosser (Land Rig Newsletter); Nickle’s Rig Locator; Tom Kellock, Bruce Miller (ODS – Petrodata); Mike Critchley, Jim Elder, Kelly Hollister, Leonora Navarre, Greg Petterson and Doug Smith (ReedHycalog).
THE AUTHORS
|
 |
Steve Berkman has been marketing manager for ReedHycalog® since July 2004. Prior to that appointment, he served as regional sales manager in Latin America. He has been with ReedHycalog for more than 20 years, starting as a design engineer in 1982. Mr. Berkman has been all over the world with ReedHycalog in engineering and sales positions. he received a BS degree in mechanical engineering from the University of Texas in 1981.
|
|
 |
Tory A. Stokes is a consultant for ReedHycalog, after being employed by the company as a senior marketing analyst for eight years. She graduated with a BS degree in applied mathematics from Texas A&M University in 1985 and earned an MBA from the University of Houston in 1993.
|
| |
|
|