Advanced logging diagnosis allows successful water shut-off
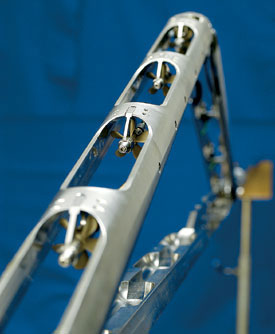
Production TechnologyAdvanced logging diagnosis allows successful water shut-offHigh resolution production logging data confirmed that setting a plug between sands would solve the problem. Well production went from 650-bpd oil with 5,000-bpd water to about 850-bpd dry oil.Grant Ballantyne, Talisman Energy (UK) Ltd and Parijat Mukerji, Schlumberger A novel production logging operation and subsequent water shut-off intervention were successfully executed by Saltire field operator Talisman Energy (UK) Ltd, and its partner ENI (20% stake). This operation resulted in restoration of a prolific dry oil producer. A new horizontal and deviated well production logging system was used along with its associated monitor box visualization software. This approach allowed diagnoses of multiphase flow regimes combined hardware design, data interpretation methodology and data visualization. Together, the system and software provided fast data turnaround and actionable downhole velocity and holdup information within a few hours of receiving the field data, so quick corrective action could be taken and production restored. THE PROBLEM The Saltire A06 well was a commingled producer that recently flowed at about 7,000-bpd fluids, of which 1,000 bbl was oil, for an 85% water cut. It was gas lifted at a 980-Mcfd rate. The well was completed in July 1994 and perforated the following month in the Piper Main sand interval. After having produced solely from the Piper Main sand for nearly a decade, the A06 well’s Galley sand was perforated on May 3, 2004. Six months later, on November 1, 2004, the offset A15Z well was reactivated, its subsequent production also sustained from the Piper Main sand. As a consequence, a production logging survey was required on the A06 well to determine its current flowing bottomhole pressure in addition to the zonal contributions from the Piper Main and Galley reservoir intervals. For this well, it was suspected that the Piper Main sand was producing mainly water with little oil. Should the logging survey confirm this, it was proposed to shut off the Piper Main sand by mechanical means, the preferred method being a retrievable bridge plug (RBP) or a hollow packer complete with plug and prong assembly to permit future testing and sampling of the lower Piper Main sand interval. Additionally, any data acquired would aid the technical allocation process and help history match a full-field numerical simulation model. Data would also aid in the design pressure support to the Galley sand reservoir, as part of future secondary recovery projects. Before the RBP installation, the existing long-term memory gauge installed in the well would have to be recovered. The production log was run and the RBP installed. In the event that water shut-off was deemed necessary, it was also proposed to install new Omega gauges (Short Quartz) within the 4.5-in. QN nipple located at 9,788-ft MD. These would enable a long-term pressure survey whose data would support the production strategy, as well as aid full-field numerical simulation model history matching. THE SOLUTION To better understand and diagnose multiphase flow regimes, Schlumberger developed a new approach that combines hardware design, data interpretation methodology and data visualization. Its FloScan Imager* horizontal and deviated-well production logging system was designed especially for highly deviated and horizontal wells, Fig. 1. On one side of the tool’s retractable arm are four miniature spinners, designed to measure the well-fluid velocity profile.
On the other side are arrays of five electrical and five optical probes for measuring localized water and gas holdups, respectively, in mixed and segregated flow regimes. The electrical probes measure the fluid’s impedance, which allows the water holdup to be calculated, and the optical probes use reflectance to derive the gas holdup. The tool’s maneuverable arm deploys both the spinners and sensors along the vertical axis of a non-vertical wellbore to obtain the velocity and holdup measurements. Additionally, a fifth miniature spinner and a sixth pair of electrical and optical probes on the tool body measure flow properties on the low side of the well. A conventional spinner measures flow and provides an average velocity in the center of the wellbore, regardless of the flow profile. However, each of this new tool’s five miniature spinners measures velocity at five different points across the wellbore’s vertical axis, making a direct, localized measurement of the fluid velocity and enabling calculation of a multiphase velocity profile, Fig. 2. The spatial location of the different sensors is accurately identified with an integrated, relative bearing sensor and a caliper measurement. The direct measurement of the velocity and fluid holdup profile enhances the capability of the analyst to determine the downhole phase split and reduces the uncertainties associated with multiphase flow interpretation.
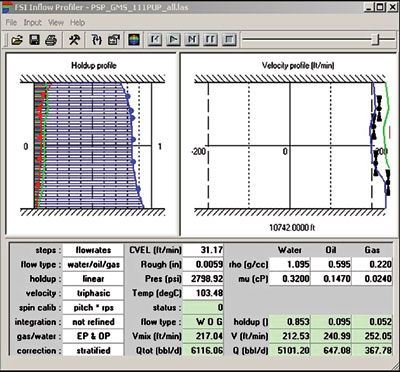
For wells with deviation between 20° and 85°, some portions of the wellbore have monophasic flow, but the overall flow structure is complex. Water segregates to the bottom of the pipe because it’s the heaviest phase. As such, the mixing layer is now located on the upper side of the hole with dispersed bubbles of oil. This flow structure has large gradients in the velocity and holdup profiles. Worse, water is frequently re-circulated at low flowrates and its velocity on the lower side of the hole can be negative in some areas. Under these conditions, center-based measurements that yield average answers are not sufficient to understand the flow structure. Water detection. The water detection capability incorporated into the new production logging system is based on the measurement from six low-frequency probes that measure the fluid impedance surrounding the tip of each probe. Each probe generates a somewhat binary signal when oil or gas bubbles touch the probe’s tip, or when, in a water-continuous phase or when droplets of water in a hydrocarbon-continuous phase touch the probe’s tip. A threshold is set in order to distinguish water from hydrocarbons. Therefore, the measured high and low of the signals allow the tool to discriminate oil and gas from the water phase. Oil and gas do not conduct electric current, but water does. Water holdup is determined by the fraction of time the probe tip is conducting. From this principle, the local water holdup determined by each probe is derived as the ratio of the total time of the high signal (i.e., water) to the monitoring interval time. The main advantage of this technique is that a local water holdup measurement, independent of fluid properties, can be obtained without any need for calibration, as opposed to traditional tools that require an accurate calibration in oil and water. Further, the bubble-count measurement, i.e., the log that represents the number of non-conducting events detected during a monitoring interval, can be used to accurately locate fluid entries; traditional tools lack this accuracy. By having a water holdup measurement made along the vertical diameter of the wellbore, the resulting water holdup profile gives a close snapshot of the flow regime in the wellbore. Gas detection. Gas detection in the production logging system is achieved with six optical sensors that are sensitive to the fluid optical index. Typically, gas has an index close to 1, while water and crude oil have indexes, respectively, of 1.35 and almost 1.5. Since oil and water have similar fluid indexes, the optical probes are used to distinguish gas from liquid. The optical probes have a similar, somewhat binary, response as that of the electrical probes, exhibiting a large difference between gas and liquid. Again, a threshold is used to discriminate gas from liquid. Another important quantity obtained from the raw data, the gas bubble count, can be used to locate the first gas entry. Much like the electrical probe technique, the advantage of using optical probes is that a local gas holdup can be obtained without any need for calibration in gas and liquid because of the quasi-binary signal provided by the measurement. Further, field tests have shown that, under favorable conditions, the optical measurements can also differentiate oil from water. RESULTS On June 5, 2005, this novel production log was run on surface-readout wireline in the Talisman 15/17-A06 well over a 300-ft logging interval. Its associated FloScan Imager Inflow Profiler (FSIIP*) monitor box visualization software also was used, which optimized real-time display of the downhole multiphase flow profiles, Fig. 3. The well’s flow profiles were measured shut-in and at full-rate (100% open choke), medium-rate (62.5% choke) and low-rate (43% choke) flowing conditions.
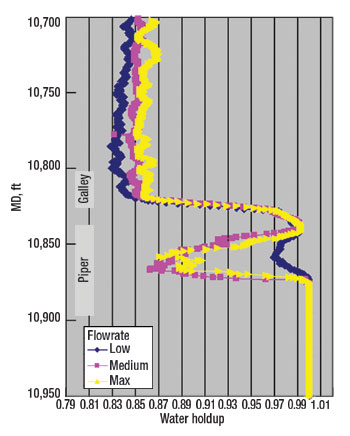
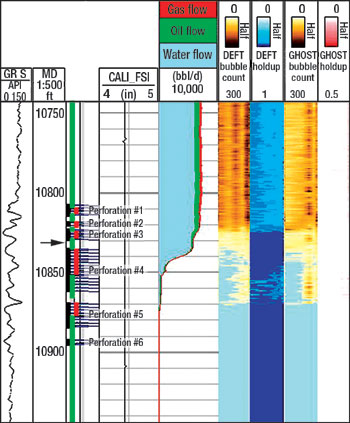
The Piper Main sands (10,835 – 10,862-ft) dominated flow, producing 70 to 80% of the total liquids, which was mostly water at all flowrates; the oil contribution from this interval varied between 100 and 160 bpd with first entry detected at 10,870 ft. However, three sets of perforations within the Galley sands produced 80% of the total oil volume. At medium flow, the Galley sands produced 670-bpd oil, and 970-bpd oil at low flowrates. Holdup from the electrical and optical probes for the three flowing conditions is shown in Fig. 4, where a value of 1.0 represents water.
Since the Galley sands were producing most of the oil, especially at low flowrates, and the Piper sands were mostly water, it was decided to sacrifice the small oil volume coming from the Piper, thereby shutting off most of the water, and keep the lower watercut, higher oil production from the Galley. Thus, an RBP was set between the Piper and the Galley, at 10,830, Fig. 5.
Well A06 was put back online and produced 850-bpd dry oil, compared to the previous 650-bpd oil with 5,000 bpd water. Following optimization, production was increased to 1,200-bpd dry oil. Fast and accurate interpretation of the downhole flow led to the successful water shutoff and restoration of this prolific dry oil producer.
|
||||||||||||||||||||||||||||||||

- Advancing offshore decarbonization through electrification of FPSOs (March 2024)
- What's new in production (February 2024)
- Subsea technology- Corrosion monitoring: From failure to success (February 2024)
- U.S. operators reduce activity as crude prices plunge (February 2024)
- U.S. producing gas wells increase despite low prices (February 2024)
- U.S. oil and natural gas production hits record highs (February 2024)

