3D Gulf of Guinea seismic images offer useful comparisons with offshore Morocco
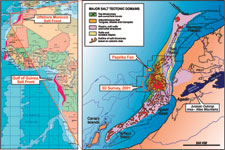
Offshore Report3D Gulf of Guinea seismic images offer useful comparisons with offshore MoroccoSeafloor imagery from Western Africa’s Gulf of Guinea and outcrop data enhance exploration knowledge for lesser known offshore Morocco prospects.This article describes and concludes how the seafloor images identified in the Gulf of Guinea area can be examined and interpreted by morphology and amplitude character. The images suggest an evolutionary development from pocks, to gullies, to immature canyon-unconfined fan, to mature canyon-channel levee systems. The interpreted regional relationships of these systems to dynamic salt fronts and the lack of connectivity to shelf systems renders them useful as analogies to offshore Morocco in a similar tectonic setting removed from its shelf system. Integrated geologic-geophysical analyses in combination with advanced technologies such as spectral decomposition of 3D seismic data allow a complete geologic picture to be developed. This more complete geologic picture suggests reduced reservoir risk for siliciclastics in the otherwise isolated subsurface section of offshore Morocco. Following the introduction which overviews the processes used, further discussions review the Gulf of Guinea seafloor and the offshore Morocco subsurface. INTRODUCTION Interpretation of a seafloor image in the Gulf of Guinea provides analog data for extrapolation of depositional concepts applicable to an area of limited data control in the subsurface of offshore Morocco. This extrapolation combined with integrated geological-geophysical analyses and application of technologically advanced 3D seismic spectral decomposition reduces risk for reservoir presence in the area. The Gulf of Guinea images document detailed relationships among structural and stratigraphic geomorphologies expressed in 3D seismic data. These relationships assist in the identification of clastic, potentially sand-rich submarine fan systems necessary for economically viable oil and gas reservoirs in deepwater offshore Africa. The detailed images and structural-stratigraphic relationships seen in the Gulf of Guinea are also identifiable in the subsurface of offshore Morocco. However, due to the indirect nature of 3D seismic measurements and seismic signal attenuation with depth, a more integrated and technologically advanced approach is required to achieve an understanding of the potential reservoir section. The Moroccan example utilizes integration of correlative outcrops in the High Atlas Mountains, structural-stratigraphic maps derived from 3D data, and spectral decomposition of the 3D seismic signal to construct a model similar to that identified in the seafloor structure and amplitude maps in the Gulf of Guinea. The Gulf of Guinea seafloor example is used as an analog to the subsurface Moroccan example because it is located in a similar structural setting at the edge of a toe-thrust salt front, and because of the expected similarity of in depositional setting for submarine siliciclastic systems evolving from unconfined fan to aggradational channel-levee complex, Fig. 1.
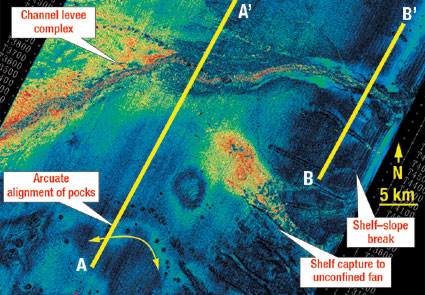
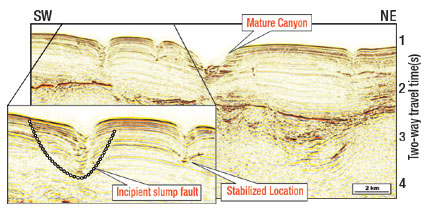
GULF OF GUINEA SEAFLOOR The seafloor image of a 3,000 km2 3D seismic dataset in the Gulf of Guinea shows several structural and depositional features including pockmarks, gullies, canyons, channels and associated fans in the submarine environment, Fig. 2. Examination of these surficial features in context with the subsurface indicates an interactive and progressive relationship between seafloor instabilities, dynamic salt tectonism, and rapid shelf break progradation. The surface features are consequently interpreted to represent an evolutionary sequence from pockmarks, to gullies, to immature-canyons with unconfined fans, and finally to mature canyons with stabilized channel-levee systems.
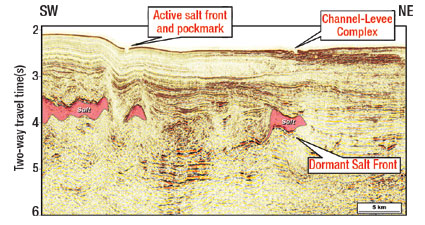
One reason the evolutionary nature of these systems can be deduced from this data is that the extensive 3D area illuminates details of present day environments from a shelf-slope break located in approximately 100-m water depth to a middle-lower slope setting in 2,500-m water. According to the basic principles of superposition, this evolutionary sequence can then be used to develop a depositional model which may be applied either aerially or in vertical succession. One key type of seafloor feature on the Gulf of Guinea seafloor are pockmarks identified as relatively isolated, circular depressions, about 100 m in diameter, forming either in the mid-lower slope or near the shelf-slope break. Many publications have suggested potential mechanisms for the origin of seafloor pockmarks.1 – 4 However, the exact cause of genesis in this case is unclear since these pocks are found in widely differing settings. They may be in topographic lows, on topographic highs, associated with faulting or not associated with any vertical disruptions in the underlying seismic section. Nonetheless, these pocks do appear to be generally related to regions of subsurface instability, either structural or depositional in character. Structural toe thrust zones associated with relatively rapidly emplaced salt fronts act as loci for pockmark development, Fig. 3.
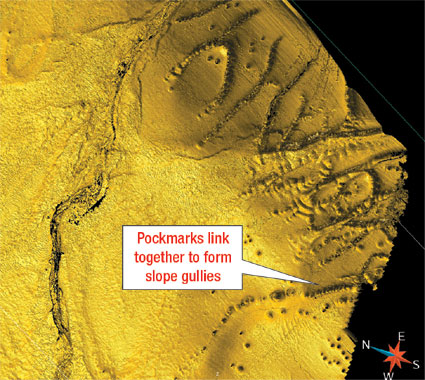
The pockmarks in this region form linear arcs parallel to the front or structural crest of dynamic salt movement. The steep gradient along the uppermost slope also acts as a focal mechanism for pockmark development. Unlike the pockmark pattern identified at salt fronts, the shelf edge pattern is perpendicular to the structural grain of the shelf margin forming a linear, radial pattern. These shelf-edge pocks are interpreted to result from upper slope instabilities caused by rapidly deposited, progradational foreset shales. Regardless of the cause or mechanism of pock formation, their initial presence appears to interactively lead to their increasing abundance and stabilization along planes of subsurface weakness. Areas of abundant pockmarks on the Gulf of Guinea seafloor can be traced landward into series of pocks that align and connect to produce shelf-slope gullies of centipedal form, Fig. 4. Many shelf-slope gullies stabilize their position through time, Fig. 5. Certain stabilized gullies appear to capture shelf-based turbidite systems and funnel sediment to upper slope settings, Fig. 2. Successive turbidite flow through a gully produces weaknesses around gully walls. This weakness is evidenced by incipient faults seen in the seismic data, Fig. 5.
The incipient faults eventually collapse, leading to further stabilization of the canyon’s position. Early to mid- and late-mature canyons are associated with different types of canyon fill, Figs. 2 and 5. Early fill is represented by focused, but relatively unconfined upper slope sheet fans. Later fill is dominated by more continuous, confined sediment flow that bypasses the shelf and produces architecturally complex mid-to-lower slope channel-levee systems, Fig. 3. In the most mature, longest lived systems, pockmarks develop surrounding canyon heads and apparently assist in the geometrical definition of headward erosion scarps. Considering the spatial connection of various pockmarks, gullies, canyons, fans and channel-levee complexes enables each feature to be placed into a continuum of evolutionary developmental stages of a siliciclastic submarine fan system. Pockmarks form in regions of subsurface instability. Continued instability and increasing abundance of pocks causes the pocks to merge and form gullies along planes of weakness. In turn, the gullies capture shelf-based sediment flow which further weakens gully walls. The weakened gully walls collapse to form canyons that capture additional sediment flow. Those sediment flows become more confined and stable allowing basinal distribution of aggradational channel-levee complexes. The cycle continues with additional pockmark development and failure at the canyon head, eventually connecting the mature submarine system with shoreline river systems. Implications of the Gulf of Guinea seafloor observations as they pertain to the development of depositional systems linked with subsurface conditions allow the following conclusion – the positioning of canyons and channel-levee complexes in this case appears to be more dependent on initial pockmark location than on absolute topographic relief or surface gradient. This dependence suggests that regional subsurface instability may be the primary focusing element of siliciclastic submarine systems above and beyond the connection to landward river systems. The relationship of pockmarks to the evolution of submarine fan and channel-levee systems becomes especially significant when considering the potential for facies prediction in unknown depositional systems or point source systems separated from their hinterlands. The structure and stratigraphy underlying the target section and the dynamics of the overall system may impact the localization and development of submarine fans at least as significantly as the character of their hinterland regions. Consequently, identification of the underlying structure and stratigraphy, combined with the geomorphologies represented in the target section, can be used to make inferences regarding the depositional system as a whole. OFFSHORE MOROCCO SUBSURFACE One application of the seafloor observations described above is to utilize them as an analogy for subsurface examples. The analogous example presented in this case is a conceptual subsurface depositional model obtained by careful integration of geology and geophysics with technologically advanced spectral decomposition of the seismic data, Fig. 6.
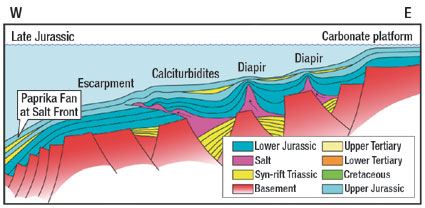
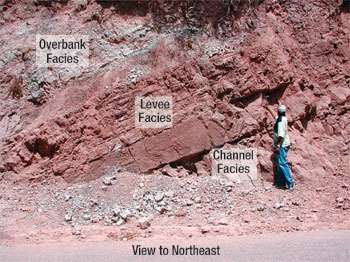
Both offshore Morocco and Gulf of Guinea examples are located at the edge of mobile salt provinces characterized by toe-thrust regimes. The section of interest in Morocco is a basinal Jurassic age sequence with their updip equivalent outcropping in the onshore hinterland 200 km to the East, Fig. 1. Both areas are interpreted as dominantly siliciclastic submarine fan environments. Although there are no wells drilled within 100 km of the offshore Morocco area, the submarine fan interpretation is supported by regional correlations on 2D seismic and structural-stratigraphic maps of the 3D seismic data. The integrated geology and geophysics in offshore Morocco includes: an outcrop study in the Jurassic age section of the Western High Atlas Mountains, seismic correlation on a loose 2D seismic grid and structural-stratigraphic interpretation of the 3D seismic dataset. Jurassic age outcrops are well documented in the Western High Atlas Mountains of northern onshore Morocco.5 The Dogger section mostly comprises siliciclastic systems capped by Callovian carbonates. Fluvial channel-levee-overbank systems indicate a potential lowering of base level and an introduction of clastic facies into the basin during Jurassic time, Fig. 7. These fluvial systems are typically several hundred meters thick and correlative for several hundred kilometers.5 Interpretation of 2D seismic data indicates Jurassic sediment pathways are present from the shelf to the salt front. However, due to dynamic salt tectonics and limited 2D data at the shoreline, direct correlation from the outcrops to the 3D seismic is currently unattainable.
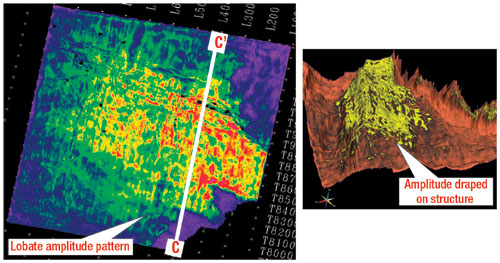
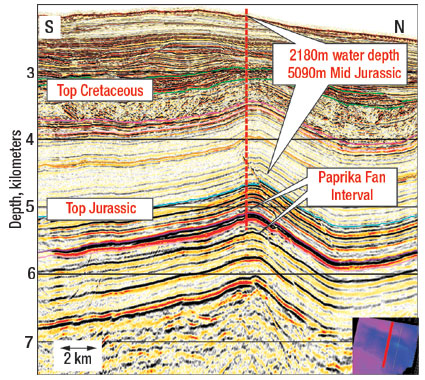
Despite the lack of correlative updip sequences, a series of isopach maps and amplitude extractions produced in the 3D area suggest a succession of lobate fan geometries in the target section. However, the amplitude expression of the feature is not immediately indicative of patterns typically associated with siliciclastic submarine fans, Fig. 8. This ambiguity may be due to attenuation of the seismic signal with depth since the interpreted fan interval is located in 2,180-m water depth and buried by nearly 3,000 m of sediment, Fig. 9. Additionally, late structural inversion of the section has obscured the stratigraphic relationships often used to diagnose and describe these systems, Fig. 8.
Advanced spectral decomposition methods are employed to fully understand the amplitude character of the target section and complete the depositional model for the subsurface of offshore Morocco. Fig. 10 shows the amplitude spectra for various areas within and around the target section. The amplitude anomaly is centered around 30 – 40 Hertz, which is at the mode of the amplitude spectra for the full stack data. The coincidence of frequencies between the total and anomalous amplitudes substantiates the presence of the anomaly and supports the concept that these strong amplitudes are not due to tuning effects.
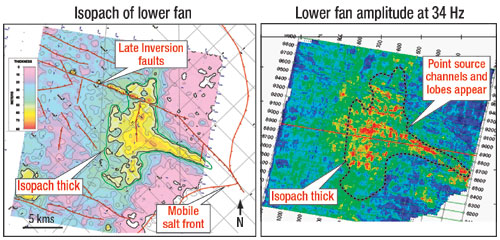
Not only are the anomalous amplitudes an order of magnitude greater in absolute value, but they also exhibit a shift to slightly higher dominant frequencies and an expanded, broad band signal. Similar modal shifts and broad band signals have been associated with the presence of hydrocarbons and/or more porous-permeable rock types in other areas.6, 7, 8 Spectral decomposition can be exploited further by producing iso-frequency amplitude volumes to reveal clastic morphologies similar to those in the Gulf of Guinea and otherwise smeared by the full frequency stacked amplitude data in offshore Morocco. The iso-frequency time slice images show an expected and clear evolution typical of siliciclastic submarine fan systems. The lowermost interval depicts a linearly focused increase in sedimentation. The next sequence illustrates a point sourced, basinward stepping fan geometry, Fig. 11. The geometry identified in this frequency specific amplitude map is substantiated by the coincidence of an isopach thickness identified in the same interval.
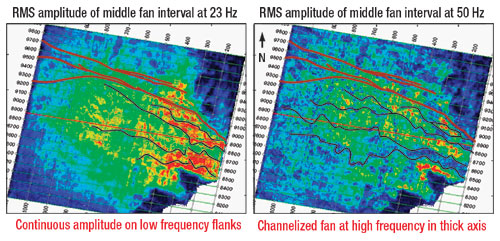
The lower fan unit is capped by an aggradational interval that changes character with changing frequency. Fig. 12 shows an amplitude map at 23 Hertz with a dim center in the axial thickness of the fan lobe and relatively continuous and bright amplitudes on the flanks of the lobe. At 50 Hertz the amplitude relationships are reversed with the bright amplitudes in the thick axis of the fan lobe and the dim amplitudes on the thinner flanks. The low frequency-thick-dim, high frequency-thick-bright connection argues against the bright amplitudes corresponding to tuning effects.9
Additionally, the presence of sinuous channel forms in the various frequency slices suggests an aggradational channelized fan interpretation. The aggradational fan interval is overlain by fan geometries that exhibit a landward shift in amplitude and isopach thickness. The final capping sequence is a uniformly distributed and thinly mottled low amplitude package interpreted as quiescent shale deposition or a fan abandonment interval. Editor’s note: The author’s conclusions from the above discussion are summarized in the article’s leading paragraphs.
|
||||||||||||||||||||||||||||||||||||||||||||||||||||||