|
|
|

By Petroleum Technology Transfer Council |
Volumetric balancing locates recoverable hydrocarbons
In a 60-year-old Texas field, geologic maps evaluated with volume/ production analyzing software backed 45-well recompletions
Dianne Calogero, Magnum Hunter Resources, Dallas, Texas, and Greg Stevens, GrailQuest Corp., Houston
Magnum Hunter Resources acquired Walnut Bend field in North Central Texas and quickly began improving production through more efficient operation, and “grabbing the low hanging fruit.” After this initial activity, the operator embarked on a detailed geologic and engineering study while the field returned to its historic decline rate. As part of the geologic study, a new volumetric balancing tool, ReservoirGrail, was employed to bring the reservoirs from initial conditions to present day.
This tool provided maps of in-place recoverable oil, which were used to locate new wells and identify recompletion candidates. After more than two years and 100 workovers – that were identified using the maps – an 80% success rate was achieved. Field production has increased to over 900 bopd from about 600 bopd, and is considered an economic success.
FIELD BACKGROUND
Magnum Hunter acquired the Walnut Bend field in Cooke County, Texas, in 1999. First discovered in 1938, there have been some 600 wells drilled in the field. Production occurs from 58 intervals in the Strawn formation. By 2002, cumulative production was about 99 million bbl, and production from 90 active producers had fallen to 600 bopd. Wells were completed in different intervals in the Strawn formation. By 2002, cumulative production was about 99 MM bbl and production from the 90 active producers had fallen to 600 bopd. Wells were completed in different reservoirs at various times throughout the production history of the field. Frequently, multiple reservoirs were commingled. And adding even more to the complexity, some of the reservoir intervals had multiple phases of waterflooding.
The company thought significant recoverable hydrocarbons remained, but recognized that conventional reservoir simulation was not a practical option considering the field’s complex production history and scarce pressure data. It was decided that there was sufficient remaining potential to justify an alternative approach – developing reliable geologic maps for each interval and then performing time-dynamic volumetric balancing (TDVB). GrailQuest Corp. (GrailQuest), that developed the TDVB concept, offers software (ReservoirGrail) and associated services.
TIME-DYNAMIC VOLUMETRIC BALANCING
Put simply, this approach is based on the premise that reservoir maps, when carefully prepared, are accurate. Accepting this and knowing well locations and production/ injection volumes, one can step through history using original volumes, and the volumes produced/ injected, to history-match performance. Then the amount/ location of recoverable reserves in different reservoir areas can be identified at any given point in time.
Calculations are quick (minutes) compared to conventional flow simulation, allowing multiple iterations. The ability to quickly visualize the reservoir through time often leads to valuable insight, allowing better property management.
ANALYZING POTENTIAL IN THE R2 INTERVAL
The operator engaged GrailQuest to gather and organize well location, production/ injection volumes and well log data. Logs were interpreted, and key reservoir parameters (porosity, saturations) were calculated for each interval. Reservoir maps (net sand and net pay) were then developed for each horizon. For this 600-well project, this phase alone took about 18 months. While not inexpensive, reliable geological maps are key to proper field management.
Given the geological maps developed above, ReservoirGrail was applied to each horizon. Time requirements to history match an interval varied from 4 hr to 24 hr, depending on complexity of the interval’s history and development, and whether geological adjustments were needed to get results that made sense. On average, it took about 8 hr to history match an interval.
Each interval, or reservoir, was processed separately by ReservoirGrail. A typical reservoir, the R2 interval, is discussed here. Within the process:
- Net sand and net pay maps were read-in to create the model framework. The program calculates original fluid volumes using these maps, and the “best estimate” reservoir parameters, such as saturations and porosity, as shown in Fig. 1.
- Flow paths within each reservoir are calculated, based on the reservoir quality map (in this case, net sand), and the reservoir is remapped for drainage characteristics from the standpoint of each well. An example drainage map for one well is shown in Fig. 2.
- This reservoir model is volumetrically “drained” by the producing wells (and filled by injection wells) through a series of monthly time steps according to each well’s production schedule (oil, gas, water) and the new “drainage” maps.
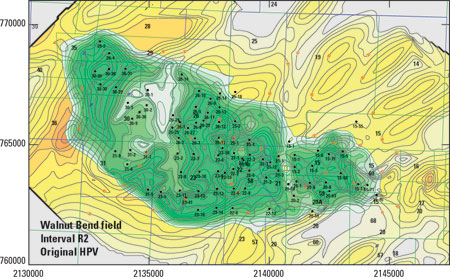 |
Fig. 1. Original hydrocarbon pore volume (green shading) as calculated by ReservoirGrail, overlain on net sand (reservoir quality) map.
|
|
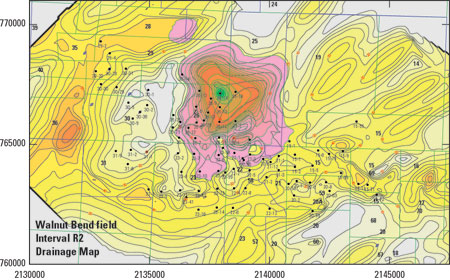 |
Fig. 2. Example “drainage” map for Well 26-14, overlain on reservoir quality (net sand) map.
|
|
Fig. 3 illustrates the final amount and location of remaining oil. This map was instrumental in designing the recompletions, targeting available wellbores in areas where sufficient recoverable oil remained to justify recompletions.
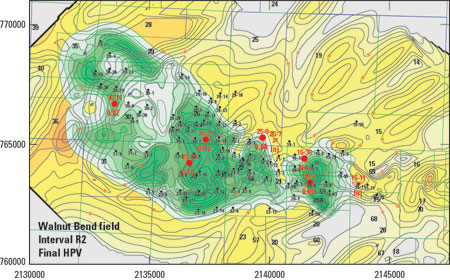 |
Fig. 3. Final hydrocarbon pore volume as calculated by ReservoirGrail. Post analysis recompletions with resulting oil cut are shown in red.
|
|
The R2 interval has been nearly drained of primary oil, and initial rates were expected to be low until injection response is seen. To date, five recompletion/ workovers to the R2 interval have increased production to 43 bopd from 0 bopd and two wells have initiated injection. Results (oil cut) are shown in red on Fig. 3. These recompletions and workovers typically paid out in less than a year. Incremental reserves estimated for the work completed on this interval to date are about 96,000 bbl.
FIELDWIDE RESULTS
Since inception of the study, Magnum Hunter has completed – through September 2004 – 45 recompletions. Overall production results confirm that volumetric balancing predictions are correct 80% of the time. Total cost, including the initial study and workovers performed to date, approximates $2 million. Field production has increased to 950 bopd from 600 bopd (153%). And reserves added to date are estimated at $4.32/bbl. Results are attractive enough that the operator has plans to employ the volumetric balancing concept in other fields. 
ACKNOWLEDGMENT
The authors wish to acknowledge and thank Magnum Hunter Resources for the use of their data.
THE AUTHORS
|
| |
Dianne Calogero, chief reservoir engineer for Mid-Continent and Frontier areas, Magnum Hunter Resources, has extensive experience in these two areas. She holds a BS in chemical engineering from Texas Tech University.
|
| |
Greg Stevens, chief technology officer, GrailQuest Corp., has been active as a working geologist involved in development and continued refinement of the concepts employed. He holds a BS in economics and BS and MS degrees in geology from the University of Houston, He may be reached at: greg@grailquestcorp.com.
|
| |
|
|

