OUTLOOK 2005: United States
Producing Gas Wells
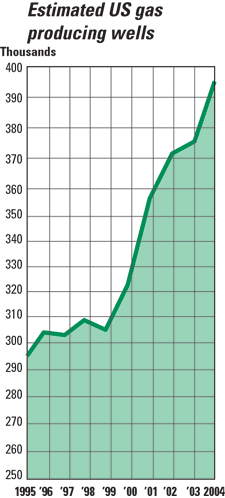
US gas well growth continues
A 5.0% increase in US producing gas wells in 2004 continues the steep per year gas well increase that started in 2000. Steadily rising natural gas prices starting in 2002 brought the 12-month average price to over $5.50/Mcf in late 2004 with late-year monthly averages of $6.00 to $7.00. This price increase plus the low cost of flowing gas wells, except for some de-liquefying projects, keeps even low-volume wells operating. And a significant trend is continued drilling of coalbed methane wells. Wyoming’s total includes 11,853 CBM wells; Alabama’s 4,552 total includes 4,082 estimated CBM wells. Gas well drilling accounts for over 85% of US rig activity.
Among the top-10, Texas, with its 70,022 gas wells, beats second place Pennsylvania by over 25,000 wells. District 4 in Texas’ southern tip leads Texas areas with 11,083 gas wells due to continued efforts to supply US and Mexico gas demands. District 7C in West Central Texas is number two with 10,273. District 6 on the Louisiana border reports 9,512 wells, closely followed by the Panhandle’s District 10 with 9,243, the only district to indicate a decline.
In the northeast, with strong shallow gas well activity, Pennsylvania reports 44,227 wells, with minor CBM contributions. West Virginia reports 40,400 gas wells, with only 400 CBMs; and Ohio’s estimated 34,320 gas wells with minor CBMs places it number five in the US. Oklahoma reports 33,500 wells active in 2004. Nearby Kansas reports a significant increase to 24,352 wells, including 5,587 CBM wells. Pennsylvania, Kansas and Oklahoma will each drill well over 2,000 wells this year, the first two comprising essentially shallow gas wells. Louisiana reported 16,006 wells, up 2.0%, with 14,007 in the North across from Texas’ District 6 – a strong gas well area; South Louisiana favors deeper gas well drilling, with an estimated 1,844 producers, plus 155 in state waters.
Farther west, CBM drilling remains a significant contribution to gas-well numbers. North/ West New Mexico contributes an estimated 30,125 wells to the state’s 37,198 total, with a significant CBM count. Wyoming’s 18,291 total includes 11,853 CBMs, followed by Colorado’s 16,718 total, including 2,789 CBMs. California is not a strong gas well state, although an increase of 3.9% to 1,236 wells was estimated for 2004.
The shallow water area of the US Gulf of Mexico is primarily gas producing, and Federal OCS incentives are promoting deep drilling in shallow water for new gas plays. Producing gas wells totaled 2,981 in 2004, down 4.5%. Few deep drilling successes have surfaced, indicating continued declines of US Gulf producing gas wells. 
| |
Estimated US wells producing gas at the end of 2004 |
|
| |
State or
district |
Total gas wells
|
% Diff.,
2004–2003 |
|
| |
2,004 |
2,003 |
|
| |
|
|
| |
Alabama |
4,552 |
4,101 |
11.9 |
|
| |
Onshore |
4,500 |
4,051 |
11.1 |
|
| |
State water |
52 |
50 |
4.0 |
|
| |
Alaska |
136 |
124 |
9.7 |
|
| |
Onshore |
105 |
96 |
9.4 |
|
| |
State water |
31 |
28 |
10.7 |
|
| |
Arizona |
6 |
6 |
0.0 |
|
| |
Arkansas |
4,006 |
3,995 |
2.8 |
|
| |
California** |
1,236 |
1,190 |
3.9 |
|
| |
Colorado |
16,718 |
16,250 |
2.9 |
|
| |
Federal OCS |
2,996 |
3,145 |
–4.7 |
|
| |
GOM |
2,981 |
3,120 |
–4.5 |
|
| |
Pacific |
15 |
25 |
–40.0 |
|
| |
Illinois |
251 |
240 |
4.6 |
|
| |
Indiana |
1,785 |
1,720 |
3.8 |
|
| |
Kansas |
24,352 |
18,639 |
30.6 |
|
| |
Kentucky |
15,532 |
12,551 |
23.8 |
|
| |
Louisiana |
16,006 |
15,694 |
2.0 |
|
| |
North |
14,007 |
13,564 |
3.3 |
|
| |
South |
1,844 |
1,977 |
–6.7 |
|
| |
State waters |
155 |
153 |
1.3 |
|
| |
Maryland |
6 |
11 |
–45.5 |
|
| |
Michigan |
8,700 |
8,500 |
2.4 |
|
| |
Mississippi |
1,184 |
1,178 |
0.5 |
|
| |
Missouri |
40 |
35 |
14.3 |
|
| |
Montana |
5,509 |
5,371 |
2.6 |
|
| |
Nebraska |
123 |
110 |
11.8 |
|
| |
Nevada* |
35 |
30 |
16.7 |
|
| |
New Mexico* |
37,198 |
36,437 |
2.1 |
|
| |
N/W |
30,125 |
29,827 |
1.0 |
|
| |
S/E |
7,073 |
6,610 |
7.0 |
|
| |
New York |
5,936 |
5,906 |
0.5 |
|
| |
North Dakota |
163 |
152 |
7.2 |
|
| |
Ohio |
34,320 |
33,873 |
1.3 |
|
| |
Oklahoma |
33,500 |
34,283 |
–2.3 |
|
| |
Oregon |
16 |
16 |
0.0 |
|
| |
Pennsylvania |
44,227 |
43,563 |
1.5 |
|
| |
South Dakota |
217 |
193 |
12.4 |
|
| |
Tennessee |
280 |
300 |
–6.7 |
|
| |
Texas** |
70,022 |
66,315 |
5.6 |
|
| |
District 1 |
3,570 |
2,076 |
72.0 |
|
| |
District 2 |
2,752 |
2,667 |
3.2 |
|
| |
District 3 |
3,602 |
3,518 |
2.4 |
|
| |
District 4 |
11,083 |
10,617 |
4.3 |
|
| |
District 5 |
3,841 |
3,158 |
21.6 |
|
| |
District 6 |
9,512 |
8,839 |
7.6 |
|
| |
District 7B |
5,909 |
5,771 |
2.4 |
|
| |
District 7C |
10,273 |
9,899 |
3.8 |
|
| |
District 8 |
3,463 |
3,429 |
1.0 |
|
| |
District 8A |
218 |
217 |
0.5 |
|
| |
District 9 |
6,556 |
5,793 |
13.2 |
|
| |
District 10 |
9,243 |
10,331 |
–10.5 |
|
| |
Utah |
3,460 |
3,143 |
10.0 |
|
| |
Virginia |
3,820 |
3,529 |
8.2 |
|
| |
West Virginia |
40,400 |
40,186 |
0.5 |
|
| |
Wyoming |
18,291 |
15,250 |
19.9 |
|
| |
|
|
| |
Total US |
395,023 |
376,036 |
5.0 |
|
| |
*World Oil estimate **Includes state waters |
|
|
|