Seafloor Surveillance and Positioning Systems
AUV survey technology unveils seabed for deepwater developments
Autonomous underwater vehicle (AUV) with bathymetry, side scan sonar and sub-bottom profiler for water depths to over 9,800 ft.
Robert A. George, C & C Technologies, Inc.
Offshore drilling/ production operations have continued to migrate toward deeper ocean depths to find and produce new large hydrocarbon reserves. Deepwater geophysical surveys are needed at these oilfield locations for engineering of the infield production infrastructure and export pipelines. AUVs equipped with remote sensing survey tools are being employed and developed to provide high quality survey data in water depths of up to 4,500 m (14,760 ft).
C & C Technologies, Inc. owns and operates the C-Surveyor I AUV that has collected more than 40,000 line km of survey data over the past four years. BP spearheaded the effort to make this survey technology available to the oil/gas industry in the Gulf of Mexico. Kongsberg Maritime built the AUV body and control systems and C & C system engineers integrated the remote sensing payload package. The technology has revolutionized the acquisition of deepwater, high-resolution geophysical data. Described here are: C-Surveyor I capabilities, several geohazard investigations, special applications such as hydrocarbon seafloor seeps and 3D microseismics, and what is coming in second-generation technology.
C-SURVEYOR I
The AUV is equipped with a multibeam bathymetry system (200 kHz), dual frequency side scan sonar (120 and 410 kHz) and a frequency modulated (2 to 8 kHz) sub-bottom profiler.1 Positioning is performed by an inertial navigation system aided by a shipboard acoustic ultra-short baseline system. Accuracy of the positioning system is +/ – 5 m. Water-depth rating for the AUV is 3,000 m and endurance is about 50 hr on a full fuel cell charge. Average survey speeds approach 4 kt. Mission plans and a decimated geophysical dataset are transferred from AUV to shipboard control center via an acoustic modem.
The survey AUV is torpedo shaped, measuring 5 m in length and just over 1 m in diameter at its greatest point, Fig. 1. The low drag design provides maximum efficiency for traveling through water at a constant velocity. Onboard computers continuously monitor track and altitude of the AUV, and provide feedback for operation and adjustment of rudder and stern planes. Survey line turns, spaced 200 m, typically take hours with deep-tow systems, but can now be performed in only minutes with AUVs.
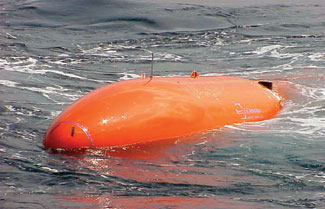 |
Fig. 1. C-Surveyor I going through pre-dive checks before filling ballast tanks and diving for start of mission plan.
|
|
All survey sensor data is collected and controlled by computers and electronics housed within the payload-processing sphere. The sphere is specially machined from titanium to withstand the pressure at AUV operation depths. The control-processing sphere houses the computers that control AUV maneuverability and system health.
C-Surveyor I has been used on a number of deepwater development projects in the Gulf of Mexico, West Africa, Brazil and the Mediterranean Sea. Mad Dog, Atlantic, Thunderhorse, Holstein, Constitution, Gunnison, Great White, Neptune and Shenzi are just a few of the Gulf of Mexico oil/gas fields surveyed. Export pipeline routes up to 100 mi in length have been engineered with AUV-acquired data across the complex continental slopes from these prospects.
The AUV recently completed surveys for the Independence Hub Facility and the Independence Trail Pipeline in the deepwater eastern Gulf of Mexico. Tieback routes from Merganser, Mondo, Jubilee, Vortex, Cheyenne, Atlas and Spiderman fields were surveyed in water depths exceeding 2,500 m in some locations. The Frade project in Brazil is on the horizon, as well as projects offshore Angola. A few of the previous projects completed in West Africa include Kizomba C, Rosa Lira, Tiof, Chinguetti, Preowei and Usan.
GEOHAZARD INVESTIGATIONS
Geohazard surveys are conducted prior to planning deepwater infield developments. The studies provide information on seabed bathymetry, seafloor features, near-seabed stratigraphy and geology, which aids engineering design of the infrastructure needed to bring the deepwater developments into production. A few interesting types of geologic and archaeological features imaged with the AUV sensors are discussed below.
Mud volcanoes are cone-shaped mounds of expelled soft mud that often form along faults. A mud volcano exists in the northern portion of the Green Canyon area in the Block 143 vicinity and was the subject of an AUV investigation during a testing cruise in 2002, Fig. 2. AUV multibeam data collected at the site reveals the feature’s morphology. The base of the mud volcano measures about 300 m and its height is 12 m above the seabed. A synclinal rim occurs around the base and the crest is very flat, measuring 75 m in diameter. Researchers have observed a very fluid mud extruding episodically from the volcano.2
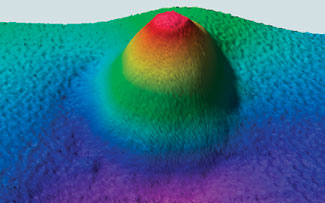 |
Fig. 2. Multibeam bathymetry rendering of mud volcano in northern Green Canyon area of the US Gulf, 300 m wide at the base, protruding 12 m above the seabed.
|
|
Bush Hill is a well-studied salt diaper found a few miles southwest of the mud volcano, Fig. 3.3 This bathymetric high represents an upper continental seabed site where chemosynthetic communities, methane hydrates and mud vents exist in close proximity. The AUV bathymetry provides the most detailed bathymetric data collected at the site to date. This is the site where tubeworms, a type of chemosynthetic organism, were first trawled up by researchers from Texas A&M University.
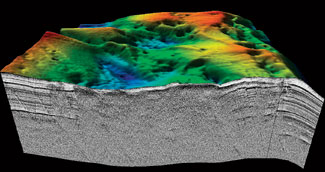 |
Fig. 3. Multibeam bathymetry image with sub-bottom seismic section hung from seabed of a mud vent area on the south side of Bush Hill in northern Green Canyon area of US Gulf in an area 500 m square with sub-bottom record length approaching 75 m.
|
|
Hydrate deposits have also been observed here outcropping, melting and dissipating at the seafloor. The sub-bottom profiler data is generally recorded as an acoustic wipe-out zone across the mud vent area, which is indicative of near-seafloor hydrocarbon gas saturation.
The oil/gas industry has sanctioned a number of deepwater exploration discoveries for development along the Sigsbee Escarpment on the outer continental slope. This seabed feature represents the seaward limit of the salt province of the Gulf of Mexico. Water depth at Atlantis field ranges from 1,350 m at the top of the scarp to 2,200 m at the base in the Atlantis development.
The seabed topography on the scarp face is some of the most complex found in the Gulf of Mexico. Steep slopes of up to 40° with numerous slump evacuation zones are present. Linear seafloor furrows formed by deepwater currents parallel the base of the escarpment.4 These furrow fields can extend for kilometers in length, Fig. 4. Mega-furrows up to 50 m in width and 10 m in depth have been identified on the continental rise in some locations just seaward of the Sigsbee escarpment.
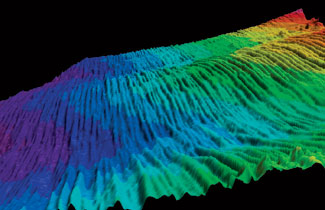 |
Fig. 4. Multibeam bathymetry rendering of longitudinal furrows found seaward of the toe of Sigsbee Escarpment. Ocean bottom currents formed furrows ranging in depth from 1 to 3 m and 5 to 10 m width. Data courtesy BP.
|
|
The AUV has also investigated a number of deepwater wreck sites of archaeological significance. The U-166 was located in more than 5,000 ft of water in the Mississippi Canyon area of the Gulf of Mexico, Fig. 5. The discovery rewrote the history books on the fate of the German submarine.5 Remote sensing data has also been acquired at a number of other deepwater wrecks in the Gulf of Mexico, including the Robert E. Lee, Mica, Alcoa Puritan and the Anona. An AUV investigation was undertaken in the Mediterranean Sea of the World War II aircraft carrier, the Ark Royal. Sonar images of airplanes that did not make it off the ship were recorded on the seabed beside the aircraft carrier.
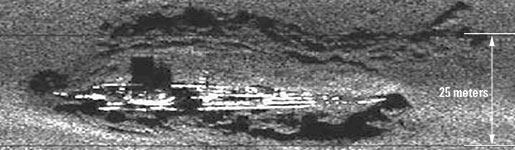 |
Fig. 5. Side scan sonar image of German U-boat, U-166, identified from AUV data in 1,500-m water in Mississippi Canyon area of the US Gulf. Data courtesy D-Day Museum/ Shell/ BP).
|
|
HYDROCARBON SEAFLOOR SEEPS
Another application of the AUV could entail identifying the location of deepwater seafloor hydrocarbon seeps. Many of the deepwater hydrocarbon producing basins contain seeps on the seabed. Petroleum compounds expelled at these locations can be geochemically analyzed to give an idea of the maturity of the hydrocarbon reserves at depth within the basin.
AUV investigations of relatively new unexplored basins could certainly identify locations where hydrocarbon seeps are located and target them for geochemical sampling. These locations are usually found along regional fault systems that provide conduits for thermogenic hydrocarbon migration to surface. Pockmarks, localized irregular bathymetry, seabed mounds, mineralized sediment outcrops, authigenic carbonate, and acoustic wipe-out zones are all indicators of hydrocarbon migrations. All of these types of features are readily identifiable on remote sensing data collected with AUVs.
One remote instrument which C & C is currently integrating into the C-Surveyor I is a methane sensor. Methane concentration maps will aid in identifying areas where active vents occur. Identification and quantification of near-seafloor hydrate deposits may also be a possibility with this type of data.
3D MICROSEISMIC INVESTIGATIONS
The maneuverability and accuracy provided by the inertial navigation system incorporated into the AUV allows design of tightly spaced survey grids. Although the sub-bottom profiler (2 – 8 kHz) found in the AUV is a chirped, single-channel seismic system, closely spaced lines can be navigated and the acquired seismic data processed to form a 3D seismic cube.
The company has implemented this survey procedure on two projects. One involved imaging of a recently formed large-diameter pockmark; the other involved locating the aerial extent of a wellbore surface casing-cementing agent that penetrated a shallow sand formation and caused problems for the geotechnical boring operations. The sub-bottom data was acquired at these two sites using 4-m line spacing.
A number of bin sizes and stacking routines to produce the best 3D seismic cube have been tested. The seismic cubes have been loaded and interpreted on a seismic workstation, allowing 3D imaging of the acquired seismic data. Seafloor and interval amplitudes, arbitrary lines, inlines and crosslines can all be generated once the seismic cube is generated. The sub-bottom profiler acquires 300-millisecond traces at a shot interval spacing of about 0.66 m; and these firing rates result in very dense data in the inline direction.
SECOND-GENERATION C-SURVEYOR
C & C has contracted Kongsberg Maritime to produce the next-generation survey AUV. C-Surveyor II will be slightly longer than C-Surveyor I; it will be rated to a 4,500-m depth and will incorporate a larger and longer duration fuel cell. The system payload will incorporate a 200-kHz multibeam system that will provide greater swath range and improved signal to noise for acquired soundings.
The side-scan sonar system will incorporate a state-of-the-art, dynamically focused side-scan sonar which will record high-frequency sonar imagery to a range of 150 m. Options for upgrading to synthetic aperture sonar have been engineered into the sonar system design. The sub-bottom profiler system will comprise a much larger transducer and receiver array. Typical sub-bottom penetration is expected to be on the order of 150 m. This system is expected to undergo a short sea trial in May 2005 and be ready for commercial use shortly thereafter. 
LITERATURE CITED
1 George, R.A., et al., “High-resolution AUV surveys of the Eastern Sigsbee Escarpment,” Paper OTC 14139, Offshore Technology Conference Proceedings, May 6 – 9, 2002.
2 Roberts, H.H., “Improved geohazards and benthic habitat evaluations: Digital acoustic data with ground truth calibrations,” OCS Study, Minerals Management Service 2001-050, U.S. Department of Interior, MMS, Gulf of Mexico outer continental shelf (OCS) region, New Orleans, Louisiana, 166 p, plus appendices.
3 Brooks, J.M. et al., “Hydrates, oil seepage and chemosynthetic ecosystems on the Gulf of Mexico slope,” EOS, v.66, p. 106.
4 Bryant, W.R., et al., “Mega furrows on the continental rise south of the Sigsbee Escarpment, northwest Gulf of Mexico,” AAPG Annual Meeting Program, v. 9, p. A18.
5 Church, R.A. and D.J. Warren, “Unraveling the mystery: The discovery of the U-166, ” Proceedings of the Information Transfer Meeting (ITM), Minerals Management Services, New Orleans, 2002.
THE AUTHOR
|
| |
Robert A. “Tony” George, geosciences manager at C & C Technologies, Inc., holds BS degrees in geophysics (1985) from the University of Louisiana, Monroe, and computer science from Louisiana Tech University (1988). He has been involved with the acquisition and interpretation of high-resolution, marine geophysical survey data for more than 17 years.
|
| |
|
|

