Rock physics and AVO effects in Mississippian-age rocks
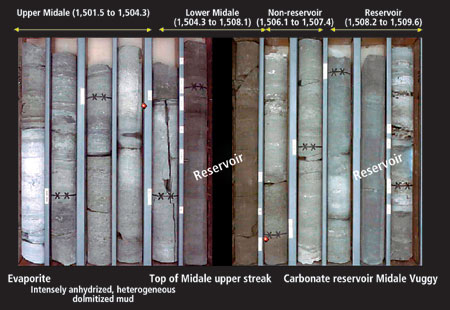
Exploration TechnologyRock physics and AVO effects in Mississippian-age rocks: Two case studiesCase studies in the shallow carbonates of Saskatchwan's Williston basin illustrate the use of Lambda-Mu-Rho analysis and impedance inversion to locate high-porosity zonesSatinder Chopra and Yongyi Li, Core Laboratories Reservoir Technologies Div., Gary Posehn, Cavell Energy Corp., and Dharam Vohra, D.R. Resource Management Consultants In the Western Canadian Sedimentary Basin (WCSB), carbonates are often encountered at depths of 3,000 m or more, but the formations discussed here are found at 1,500-m depth; reflections from these shallower depths will be somewhat liberated from the distortions experienced by wavefronts traveling from deeper reflectors. Also, these carbonate sequences are usually studied in the Rocky Mountain foothills; but this basin is located in the plains, where data is unencumbered by structural complexities. These formations are of interest for several reasons. The Mississippian Madison Group-aged carbonates have high porosity (28%), which is high for this group. It is found that thin carbonate reservoirs giving composite reflections may show up moderate values of LambdaRho for high porosities, which are confirmed by low impedance values. CASE I: STUDY AREA AND SUBSURFACE STRATIGRAPHY The first study area (20 sq km) is located along the northeastern flank of Williston basin within southeastern Saskatchwan, Fig. 1. Hydrocarbons are being produced from Mississipian Madison Group Midale and Frobisher beds, Fig. 2. Due to their subtle, yet complex depositional/ diagenetic history, these reservoirs are characterized by highly variable lithologic units and reservoir porosity/ permeability. Midale beds have the Frobisher Evaporite as the basal unit, with the main Midale divided into upper and lower intervals.
The basal lower Midale portion is a highly interbedded sequence of intergranular to pin-point vuggy porosity lime mud, wacke to packestone lithology . The upper portion possesses more interbeds of bioclastic, ooid to peloidal pack to grainstone. This unit can be interpreted as a very thin erosional remnant of what is typically called the Midal Vuggy, but is difficult to discern on wireline logs due to its anhydritization and heterogeneity within such a thin interval. Oil staining is spotty to irregular, medium to dark brown in color. Burrows, horizontal fractures and styolites are also identified. Upper Midale beds are an intensely anyhdritized and heterogeneous unit of dolomite mud to wackestone lithologies. The underlying Madison Group Frobisher beds in this study area comprise stacked carbonate lithosequences that have been subdivided into marker-defined members, namely, Frobisher Dolomite Marker, Halbrite, Huntoon, Griffin and Stougton members from top to bottom, or youngest to oldest. In this area, thickness variations occur as a result of facies changes from the varied depositional environments controlled by paleotopographic high features. The best reservoirs are found in carbonate grainstone encountered along shoaling features aligned along their structural crests. Dense lime mudstone lithologies would be deposited on shoal flanks, with evaporates resulting in overall thinner and denser, similar-aged lithosequences. Objective. The main objective of the analysis was to determine reservoir presence at the Midale and Frobisher levels. As the effective limestone porosity is inter-granular and its vertical distribution could be related to the presence of different ooids, these characteristics could change laterally. So, here an accurate reservoir description was attempted. Available core data indicated that porosity between the reservoir zones in question is between 18% and 28%. It was not clear what porosity values could be associated with what zone. Other available data were log curves for some area wells, some 2D seismic profiles, and a 3D seismic survey about 15 sq km in area, with some 2D profiles crossing the 3D survey. Workflow for analysis. The workflow drawn up for this project (Fig. 3) was to begin with a well located within the 3D survey for modeling rock properties. Available core descriptions could be used wherever necessary. Depending on favorability of the results, the seismic response could next be modeled for different values of porosity and reservoir thickness and compared with real seismic data.
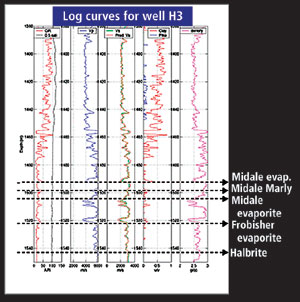
The available seismic data would then be picked up. One is never comfortable with existing processed data picked off the shelf. And, if amplitude anomalies are desired, the data requires reprocessing to achieve amplitude preservation suitable for AVO and impedance inversion. Acoustic impedance inversion is usually used to understand reservoir facies/ fluid distribution. As acoustic impedance is a layer property – opposed to seismic amplitude which is an attribute of layer boundaries – it was expected that a close relationship could be found between the acoustic impedance and reservoir rock properties. Obviously, there is no silver bullet that will achieve all goals but, depending on available seismic data quality, some available techniques in the seismic arsenal could be squeezed in wherever required. Two patented techniques were used: Coherence Cube to understand fault/ fracture distribution, and High Frequency Restoration (HFR) for restoring high frequencies before running an impedance inversion. Well log data analysis. The available suite of logs for one of the wells selected consisted of sonic, shear, gamma ray, density and porosity logs. Standard log editing and interpretation techniques were used for processing this data. The main units of interest are marked in Fig. 4. Note the indications of high porosity. Subsequent core sample examination showed this to be vuggy porosity.
Fig. 5 shows the core for Well H3. Depth zones are indicated by the color bars on the top. By examining the physical evidence, tops and bases of units, and the lithology and nature of the porosity can be confirmed.
Next, analysis of well logs was carried out as a feasibility tool to determine fluid/ lithology discrimination capabilities of AVO and inversion techniques. To begin with, cross-plotting was used to determine what combination of attributes depicts characteristics that can be used as an identifier of a specific lithology and pore fluid. This could then provide a preliminary assessment of what attributes could be diagnostic, and also to ascertain a link to relate elastic properties relevant to seismic expression (velocity and density) to petrophysical properties of interest, such as lithology, porosity and pore fluid. As seen in Fig. 6, two trends are apparent. Looking at the clastic/ background trend (blue line), it appears that the points indicated (red and green) represent gas sands. Going by the limestone trend (red line) these points could represent pockets of high porosity. The latter result made more sense. Thus, it was found that the elastic parameters LambdaRho and MuRho may be reservoir porosity discriminators. This result encouraged pursuit of seismic AVO analysis and extending to Lambda-Mu-Rho calculations.
Seismic modeling. Performing a blocking operation on the borehole logs led to a reference acoustic model for the area. Starting with this data, a rock physics modeling step based on Biot-Gassman's equation was performed. A number of perturbations of the reference model were induced, by changing reservoir porosity/ thickness. The resulting reflectivity traces were convolved with appropriate wavelets. This allowed for qualitatively determining tuning thicknesses at the reservoir levels. Thickness and porosity at different levels like Marly, Vuggy and Frobisher were identified individually, and the modeled gathers examined. It was found that a combination of 18% porosity, 7-m thickness at Marly; 10%, 5-m at Vuggy; and 12%, 2-m at Frobisher level gave a response that matched with the gather from real data, Fig. 7. Thus, pre-stack seismic modeling based on well log data shows evidence of an AVO signature for the carbonate porosity.
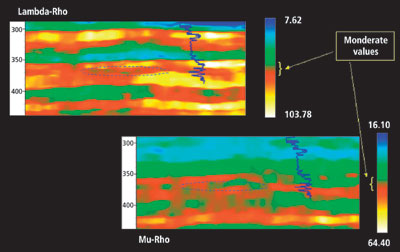
Lambda-Mu-Rho analysis. To extract more information for the carbonate reservoir, elastic property inversion (Goodway, et al. 1997) was used. After preserved amplitude processing, P and S reflectivities from gathers were extracted using Fatti's approximation. These were then inverted into P and S impedances; then modulus attributes LambdaRho and MuRho were calculated. The effectiveness of this technique is based on the fact that LambdaRho is sensitive to fluids while MuRho values have little variation within the reservoir zone. An analysis of data sets from this study indicates the behavior of dolomite rocks due to gas saturation is similar to that of sandstones, i.e., Vp decreases and Vs increases slightly due to density decrease. However, sensitivity to fluid increases with increasing porosity. Results for limestone are similar. Fig. 8 shows segments of LambdaRho and MuRho sections at the reservoir level. Relatively low LambdaRho and MuRho values were observed in porous zones of the formation of interest. The values were moderate (not as low as for a porous gas sand, for instance) but were relatively low, in agreement with the well log-based calculation of Fig. 6. Given the porosity variation of 18 to 28%, this in not surprising. This criterion was used for 2D seismic lines to locate prospective zones within the area.
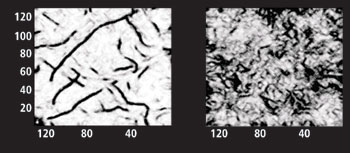
Evidence of faults/ fractures at reservoir level. Coherence Cube* analysis of the 3D seismic volume supported the likelihood of faults, fractures and other stratigraphic anomalies clearly on the time and horizon slices. As shown in Fig. 9, a time slice well above the zone of interest shows a system of faults trending NE-SW, and also some in the orthogonal direction. Another time slice at the reservoir level depicts fault-system remnants at the shallower level. Though not crisp, the slice shows fractures, and this is encouraging, as they are expected in a carbonate zone and serve to enhance reservoir performance by providing high-permeability pathways.
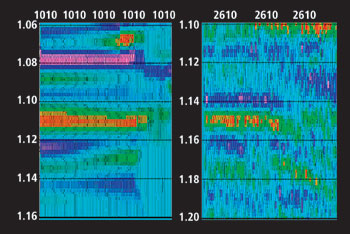
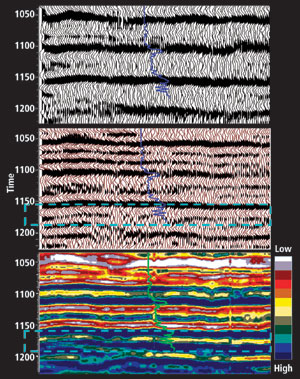
Frequency enhancement and impedance inversion. One shortcoming of the seismic reflection method is that it is usually not able to distinguish thin-reservoir characteristics. A synthetic seismogram built with 100-hz Ricker wavelet demonstrated that conventional seismic traces cannot provide an accurate representation of the reflectivity of Midale and Frobisher reservoirs. Even after frequency enhancement of seismic, we should expect a composite trough for these reservoirs. An important goal in reservoir description is to resolve thin-bed geometries. Techniques to enhance seismic frequencies are critical for optimum, thin-bed resolution. Different from the post-stack spectral whitening that is usually employed and does not distinguish noise from signal and does not preserve amplitudes, High Frequency Restoration (HFR)* uses VSP downgoing wavefield to determine frequency decay with depth, and then restore those losses on surface seismic (Chopra, et al, 2003). As seen in Fig. 10 (top), the bandwidth of seismic is low. HFR was run on the 3D seismic data and favorable results were obtained, Fig. 10 (middle), as one can now see the enhanced character of the trough below the strong marker at 1,150 ms.
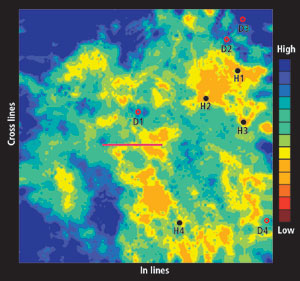
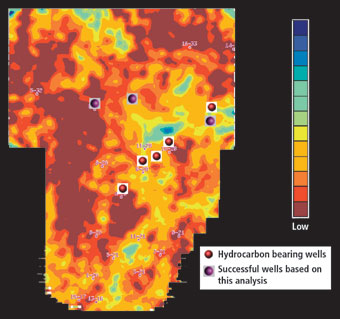
The 3D seismic volume was then put through a sparse-spike impedance inversion process. A segment of the impedance section corresponding to the segment shown in Fig. 10 (middle) is shown in Fig. 10 (bottom). A horizon slice at the reservoir level through the impedance volume is shown in Fig. 11. Low impedance pockets are seen on this slice in yellow. These pockets were interpreted as areas having high porosity and they seem to explain the status of the indicated wells quite well. It is interesting that the results of the Lambda-Mu-Rho analysis on some of the 2D seismic lines passing over the 3D seismic volume (based on the criterions decided earlier) seem to agree well with these high porosity pockets.
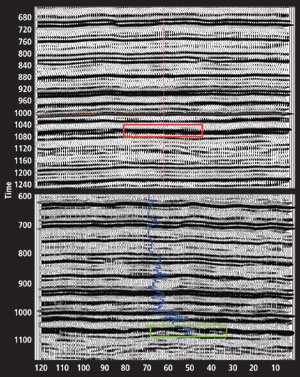
Based on this analysis, two drilling locations have been finalized and are awaiting drilling. CASE II This study area is also located within the Williston basin in southeastern Saskatchwan, close to the study area for Case I. Hydrocarbon exploitation is being carried out along the subcrop edges of Mississipian Madison Group-aged carbonate to evaporitic lithosequences. Reservoir sequences comprise shoaling complexes situated along structural ridges that possess updip reservoir plugging by anhydrite away from the oil-water interface. Prime reservoir development is found in shoals developed along paleotopographic highs. Geophysical interpretation of 3D seismic data resulted in the delineation of areas exhibiting particular wavelet character anomalies. AVO analysis was carried out on the data and the ratio of Lame rock parameters, Lambda and Mu, indicated potential good reservoir pockets leading to the drilling of three wells. Geophysical analysis. On examining the seismic response at the potential reservoir horizon pay level (underlying the Mississippian erosional surface) in a number of producing wells in the area, it was found that a strong doublet wavelet character was seen localized, and continuing intermittently away from the discovery well position. The available seismic data was reprocessed. Care was taken to have the amplitudes preserved so that AVO analysis could be carried out on this data set. The P-Reflectivity sections for inlines passing through a dry well (top) and a producing well (bottom) are shown in Fig. 12. Notice the doublet in the highlighted box in the producer, whereas a single coherent wavelet is seen for the dry well. This criterion was adopted for tracking good porosity pockets in the zone immediately below the Mississipian erosional surface. Coherence analysis performed on the seismic volume indicated fracture development in potential reservoir units.
Lambda-Mu-Rho analysis was carried out to achieve the objective following the success of this technique in the adjacent area of Case I. The reflection response corresponding to high porosity pockets, demarcated according to the criterion adopted above, translated into lower values of Lambda/Mu ratio, Fig. 13.
Based on the results of this study, the three wells that were drilled are all commercial producers. CONCLUSIONS Thin carbonate reservoirs giving composite reflections may show up moderate values of LambdaRho for high porosity. Impedance inversion can offer reliable interpretation of high-porosity pockets. On an amplitude seismic section, zones of high porosity in some cases may indicate a doublet – as seen in Case II – which may translate into low Lambda/Mu values. This criterion can lead to drilling successful wells.
|
||||||||||||||||||||||||||||||||||||||||||||||||||||||||
- Prices and governmental policies combine to stymie Canadian upstream growth (February 2024)
- U.S. producing gas wells increase despite low prices (February 2024)
- U.S. drilling: More of the same expected (February 2024)
- U.S. oil and natural gas production hits record highs (February 2024)
- Quantum computing and subsurface prediction (January 2024)
- U.S. upstream muddles along, with an eye toward 2024 (September 2023)

