|
|
|

By Petroleum Technology Transfer Council |
Surface geochemical results complement conventional development approaches
Field tests have shown that surface geochemical surveys can reliably predict drilling and production success. While they do not replace conventional subsurface/ seismic methods, these techniques do complement and enhance traditional approaches
James Wood and Albert Wylie, Michigan Technological University, Houghton, Michigan; and W. Quinlan, Jordan Exploration Company, LLC, Traverse City, Michigan
In the Bear Lake area of northwestern Michigan, Federated Oil & Gas Properties, Inc., (Federated) completed a successful, horizontal lateral re-entry, the Charlich-Fauble 2-9HD. When the well was brought online in early 2003, it produced 200 bopd. Eighteen months later, the well is still producing 50 to 75 bopd from a Silurian Niagaran reef reservoir. The well has cumulative production of more than 72,000 bbl of oil.
Surface geochemical surveys conducted within a Department of Energy-supported (DOE) field demonstration project were consistent with production results, although the ultimate decision to drill was based on interpretation of conventional subsurface and 2D seismic data. The surface geochemical techniques employed were solid phase microextraction (SPME) and microbial oil surveying technique (MOST).
Additional geochemical work in Michigan's Dundee fields has also been consistent with drilling results – poor wells were experienced in locations where surface geochemical results indicated little possibility of finding commercial hydrocarbons. In particular, surface geochemistry conducted over produced fields seems to reliably delineate depletion halos (i.e., areas of suppressed geochemical signal consistent with pressure depletion). Field demonstrations confirm that surface geochemical techniques complement and enhance, but do not replace, conventional subsurface/ seismic approaches.
BACKGROUND
As part of a DOE-supported field demonstration project performed by Michigan Technological University, with involvement of Jordan Exploration Company, LLC (Jordan), a surface geochemistry program was undertaken in the Bear Lake area of Manistee County, Michigan. Its purpose was to investigate whether geochemical anomalies are associated with Niagaran reef production. The project's focus was to learn how to combine techniques (conventional subsurface/ seismic and surface geochemistry) as an exploration/ exploitation tool, to locate by-passed oil in mature fields.
Surface geochemical techniques are based on the concept that hydrocarbon seepages occur above or in the near-vicinity of hydrocarbon accumulations.1,2,3 Although once debated fiercely, the concept is now generally accepted.4 There are several different types of anomalies that can be observed. Usual shapes include focal or apical anomalies, halo or doughnut-shaped anomalies, and linear anomalies.
Direct hydrocarbon indicator techniques can yield any shape of anomaly. Microbial techniques yield focal anomalies over virgin accumulations, including pinnacle reefs, but they tend to produce halo anomalies over produced fields, such as Vernon field in Montcalm County, Michigan.5,6 This Bear Lake case study examines results using SPME and MOST techniques. However, additional techniques are also being used and evaluated in other fields as part of the demonstration project.
CONVENTIONAL SUBSURFACE/ SEISMIC INTERPRETATION
Subsurface structural mapping using well data from existing Niagaran penetrations and several 2D seismic lines was conducted over the Bear Lake prospect area. In analyzing seismic data to integrate with the well control, two key criteria were used to identify the location of probable Niagaran reefs: 1) Disruption in the Gray Niagaran reflector; and 2) A travel-time increase between the Gray Niagaran and the A-2 carbonate.
Utilizing these criteria in combination with well control, Jordan developed an isotime/ interval isopach map that was used to locate probable Niagaran reefs in the Bear Lake area, prior to the geochemical surveys.7 Four of these likely reefs are shown in Fig. 1 by the black outlines labeled, “Reef?” Concurrently, Federated was also pursuing exploration concepts in the same area, and ultimately re-entered and side-tracked the Charlich-Fauble.2-9 The geochemical surveys were designed to cover the Jordan acreage, but they coincidentally overlapped with the Federated property. However, Michigan Tech personnel were able to integrate the geochemical survey with results from the Federated well.
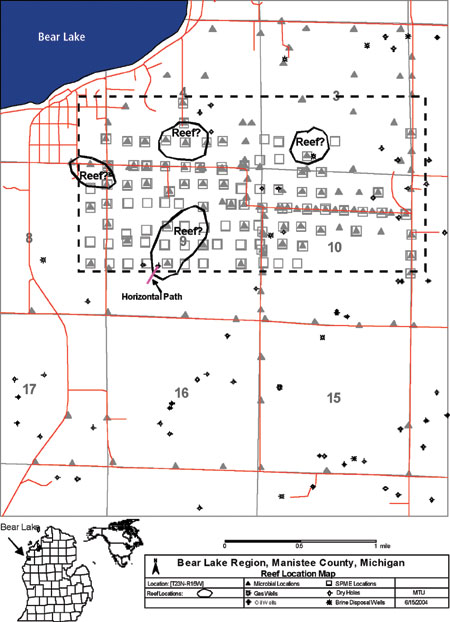 |
Fig. 1. This detailed map shows the Bear Lake survey area, geochemical sample locations and well control, where total depth is greater than 4,000 ft.
|
|
SOLID-PHASE MICROEXTRACTION (SPME)
The SPME technique uses solid fibers to determine the concentration of low-molecular weight hydrocarbons in the headspace gas of near-surface soil.8,9 SPME sample cores were taken at a depth of approximately 1 m. Sample cores were quickly placed into 125-ml, glass sample jars with a septum in the lid and sealed. Samples were kept on ice during transportation to reduce microbial activity. In the laboratory, samples were brought to room temperature and shaken. The SPME fiber that absorbs hydrocarbons was then exposed for 10 min. to the headspace gas in the sample container, before being withdrawn for subsequent analysis by gas chromatograph.
MICROBIAL OIL SURVEYING TECHNIQUE (MOST)
The MOST technique, developed more than 30 years ago by Phillips Petroleum, is available to industry through Geo-Microbial Technologies (GMT). Microbial samples were taken with a shovel at an average depth of 8 in., and about 4 oz. of soil were placed into paper bags with roll-down tops. These bags were sent overnight to GMT. GMT incubated soil samples for one week in agar gel, and then counted the butane-oxidizing microbes, reporting an average of three measurements per sample.
DECISIONS LEADING TO CHARLICH-FAUBLE 2-9HD
Fig. 1 illustrates the well control, surface geochemical sampling locations, and probable reef locations interpreted from subsurface and seismic data. SPME and MOST geochemical results (discussed later) showed positive anomalies in the area, suggesting hydrocarbons in portions of Sec. 9. Federated held leases within Sec. 9 and, independent of the DOE studies, drilled a horizontal lateral from an existing wellbore, based upon subsurface interpretations from well control and, to a lesser extent, seismic data.10
Federated re-entered the Charlich-Fauble 2-9, set a plug at 4,550 ft, drilled through the casing, turned a 90° angle, and drilled about 550 ft south-southwest (see depiction in Fig. 1). The 550-ft section was drilled through the A-1 carbonate and Brown Niagaran formations, with the last 100 ft or so actually in the reef, where returns and circulation were lost under overbalanced conditions.
After swabbing, the well flowed. As of March 2003, stabilized production was roughly 200 bopd, with no water and 110,000 cfgd.11 Initial bottomhole pressure was 1,749 psia. After 9,000 bbl of oil were produced, the pressure dropped to 1,636 psia. 12 (Federated, 2003).
SPME AND MOST INTERPRETATIONS
SPME contour plots for propane and pentane are illustrated in Figs. 2 and 3, respectively. Hexane and butane data were also measured, but they are not shown here. In Sections 4 and 9, SPME geochemical anomalies appear to be associated with the likely locations of reefs interpreted from subsurface and seismic data. The reefs in Sections 4 and 9 exhibit propane geochemical anomalies (Fig. 2) that are interpreted as halo anomalies (low values directly over the reef, high values surrounding the reef).
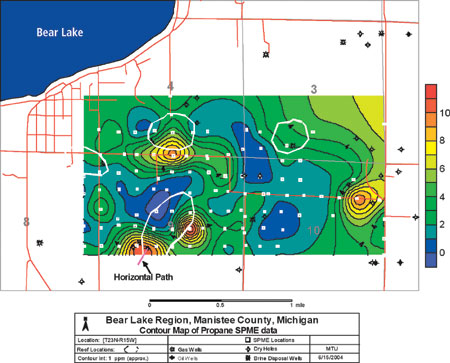 |
Fig. 2. Contour plot of Bear Lake SPME propane data. Blue areas denote lows, red areas are highs; the likely pinnacle reefs are outlined in gray.
|
|
In contrast, propane values are low in the vicinity of the likely reefs in Sections 3 and 8, and these reefs do not exhibit anomalies. The pentane data (Fig. 3) are interpreted to show a strong halo anomaly near the likely reef in Section 9, while the reef in Section 4 appears beneath a positive anomaly. The pentane plot is interpreted to show a halo or positive anomaly associated with the likely reef in Section 8, but no pentane anomaly is seen over the likely reef in Section 3. [Gridding and color filled contours were allowed to extend to the edges of the SPME data area for interpretation purposes.]
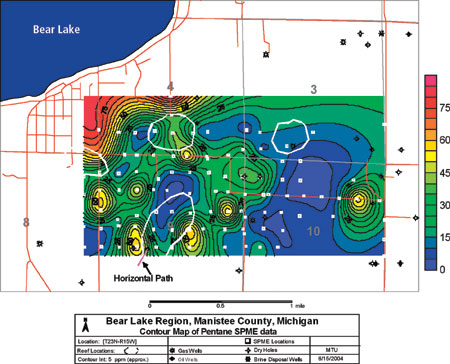 |
Fig. 3. Contour plot of Bear Lake SPME pentane data. Blue areas denote lows, yellow areas are highs; the likely pinnacle reefs are in gray outline.
|
|
Fig. 4 shows the result of the MOST geochemical survey that covered a larger area than the SPME survey, and varied in its sample spacing, due to collecting conditions and constraints. Anomalies (reds and greens) appear, in part, to be consistent with the SPME propane plot – positive halo-type anomalies in Sections 4 and 9, and no anomalies in Sections 3 and 8, in the vicinity of the likely reefs. In addition, the MOST survey shows a positive anomaly in the east-central portion of Section 9 that may be an undrilled reef.
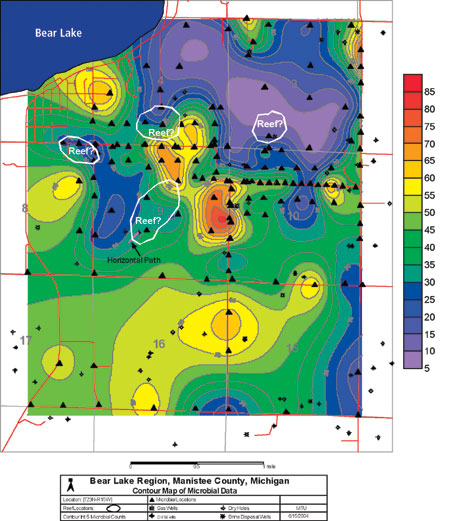 |
Fig. 4. Contour plot of Bear Lake MOST microbial data; blue areas denote lows, red areas are high. White outlines are likely reef locations based on subsurface and seismic data.
|
|
ASSESSING RESULTS
Overall, the SPME and MOST surface geochemical techniques at Bear Lake indicated hydrocarbon presence in the southwestern quarter of Section 9, and possibly in the vicinity of the likely reef in Section 4. The presence of hydrocarbons was confirmed by Federated's successful horizontal lateral. Re-analysis of the subsurface and seismic data available to the authors indicated that the interpreted outline of the likely reef in Section 9 could have been extended to the southwest, where the horizontal lateral was drilled, Fig. 4.
Considering this possibility, the high propane (red) and the high pentane (yellow) halo anomalies shown along the Charlich-Fauble horizontal well path (Figs. 2 and 3) could have been interpreted as the edge of a positive anomaly over the reef that was not fully imaged by the SPME survey. This reef was not fully imaged, because the survey did not extend far enough to the south. The MOST survey results are inconclusive in the well path area, due to the broad spacing of the survey.
LESSONS LEARNED
Several lessons were learned. For Niagaran reef work, the SPME and MOST geochemical sampling grid should be smaller, on the order of 100 ft by 100 ft, rather than the 200-m (600-ft) grid used in the original Bear Lake prospect area. However, this tends to be expensive. A better strategy, which the authors intend to employ in future studies, is to conduct surveys along the path of the proposed lateral . This strategy will greatly reduce sampling costs and should provide the information needed by the operator.
Sampling at the same interval spacing as seismic shot points also seems to make sense to allow improved, albeit qualitative comparisons between the two data types. In retrospect, the SPME geochemical survey should have been extended to the south and west by at least one-half mile. However it is difficult to know how far to extend surveys, in general, and the tendency is to center the survey over a prospect delineated by other means.
Previously, we believed, for comparative purposes, that a standardized, systematic sampling grid for the geochemical program would also provide improved interpretation of results (e.g., gridding and contouring constraints) between the different geochemical sampling techniques. However, we now believe this strategy should be amended to concentrate on tight sampling along the proposed lateral, and sparse sampling in the near vicinity, because most new Niagaran wells have a horizontal leg. If the intention is to reduce drilling risk in known reservoirs rather than locate new deposits, then this variable sampling strategy may provide better resolution where it is needed while reducing geochemical survey costs.
ADDITIONAL RESULTS, DUNDEE LIMESTONE
Several techniques – surface iodine, enzyme leach on samples from “B” soil horizons, headspace gas from samples collected at 36-in. depths, and microbial – were employed in Michigan's Vernon field, in pursuit of by-passed oil in the middle Devonian Dundee Limestone. At Vernon, the microbial survey produced the best results. Thus, it was decided to employ MOST techniques in all subsequent work. Surface geochemical results at Vernon indicated marginal potential, which was confirmed when two uneconomic wells were drilled. Geochemical sampling for Dundee and Traverse potential is continuing in the Michigan basin. 
ACKNOWLEDGEMENT
Work referenced in this case study was performed under a DOE-supported field demonstration project. Contact Gary Walker at DOE for the latest annual report: Gary.Walker@netl.doe.gov
LITERATURE CITED
1 Soli, G., “Microorganisms and geochemical methods of oil prospecting,” AAPG Bulletin, 1972, v. 41, pp. 134 – 140.
2 Horvitz, L., “Vegetation and geochemical prospecting for petroleum,” AAPG Bulletin, 1972, v. 56, no. 5, pp. 925 – 940.
3 Klusman, R. W., and M. A. Saeed, “Comparison of light hydrocarbon microseepage mechanisms,” in, D. Schumacher and M. A. Abrams, eds., “Hydrocarbon migration and its near-surface expression,” AAPG Memoir 66, 1996, pp. 157 – 168.
4 Davidson, M. J., 1994, “On the acceptance and rejection of surface geochemical exploration,” Oil and Gas Journal, 1994, v. 92, no. 23, pp. 70 – 76.
5 Wood, J. R., A. S. Wylie, Jr., and W. Quinlan, “Using recent advances in 2D seismic technology and surface geochemistry to economically redevelop a shallow shelf carbonate reservoir,” Vernon field, Isabella County, Michigan, Quarterly Report (October 2002 – December 2002), http://www.osti.gov/dublincore/gpo/servlets/purl/824802ux61fo/native/, accessed Oct. 20, 2004.
6 Wood, J. R., A. S. Wylie, Jr., and W. Quinlan, “Using recent advances in 2D seismic technology and surface geochemistry to economically redevelop a shallow shelf carbonate reservoir,” Vernon field, Isabella County, Michigan, Annual Report (April 2003 – March 2004), http://www.osti.gov/dublincore/gpo/servlets/purl/827044uNvgEU/native/, accessed Oct. 20, 2004.
7 Quinlan, W., Jordan Exploration Co., LLC, personal communication, 2002.
8 Zhang, Z. and J. Pawliszyn, 1993, “Headspace solid-phase microextraction,” Analytical Chemistry,1993, v. 65, pp. 1843 – 1852.
9 Boleneus, D., 1994, “Guidelines for surface geochemical surveying,” Oil and Gas Journal, 1994, v. 92, no. 23, pp. 59 – 64.
10 Seaman, C. C., “Application of solid-phase microextraction technology in surface geochemical exploration,” M.S. thesis, Michigan Technological University, 2002, p. 87
11 Michigan Department of Environmental Quality, Online oil and gas information system, 2004, http://www.deq.state.mi.us/mir/, accessed Oct. 19, 2004.
12 Federated Oil and Gas, personal communication, 2003.
THE AUTHORS
|
| |
James Wood is professor of geology at Michigan Technological University and director of the Subsurface Visualization Laboratory. He is responsible for surface geochemical studies. He received his PhD from Johns Hopkins University in 1972 and spent 11 years with Chevron Oil Field Research Co. in La Habra, California, from 1978 to 1990. jrw@mtu.edu
|
|
Albert Wylie is a research engineer at Michigan Technological University, responsible for geologic and seismic interpretations and studies. He received his PhD in geology from Michigan Tech in 2002. Mr. Wylie has 19 years of experience in petroleum exploration and reservoir characterization, working with companies that included Chevron, Santa Fe Energy and Mobil. aswylie@mtu.edu
|
| |
W. Quinlan is responsible for drilling operations and seismic interpretation at Jordan Exploration Co., LLC. He received his BS degree in geological engineering from Michigan Tech and has worked with Jordan Exploration for the past 15 years.
|
|

