 Technology from Europe: Technology from Europe:
United Kingdom
Assessing the real risk in well construction
Engineers want certainty in their jobs, and that certainly applies to drilling engineers. They create graphs of costs and times based on projected ROPs, mobilization and performance of equipment and manpower, as well as planning for known contingencies. To plan simply and rationally, they think in terms of known quantities, for example, a graph that represents cumulative costs or progress toward TD. Somewhere in the back of their minds, they are aware that each point on a predictive graph should carry an error bar, that is, some amount of uncertainty – a plus and minus about a point that, in effect, blurs the comforting feeling of a well-made plan.
There's a human need for certainty that causes a psychological phenomena. First, ask an engineer for a value, say, time to TD. Suppose he answers, “42 days.” Then ask him to add a range of uncertainty. Suppose he answers, “38 to 45 days.” Now let's change the ordering of the questions. First, ask him for a range, and then calculate the mean. The mean might stay the same, but it is likely that the range will be wider than when his thought processes began with a commitment to a particular number. Stripped to its essence, this, according to CEO Andrew Paterson, is the idea behind a new breed of software that is helping drilling and oil firms quantify and appreciate the full range of uncertainty that underlies their operations. This software, called P1 (and now, P1v2), is from Aberdeen-based The Peak Group.
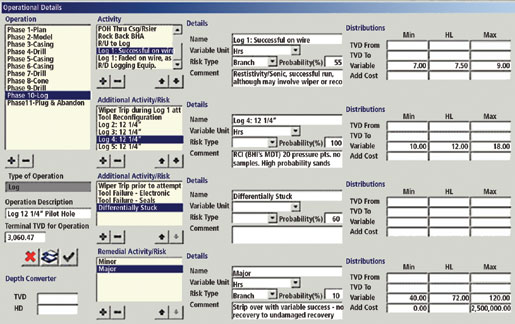
The software forces drilling engineers to assign probabilities to each type of well construction activity, and the freedom to create new types of activities (see screen shot). Contingencies and phases can be planned, with their individual impact and effect on the overall outcome quantified. Monte Carlo simulation then delivers a realistic representation of the spread of possible cost and time outcomes from constructing the well. As drilling progresses, a Best Practices analysis is made of actual performance versus the technical limit, to identify non-productive time and invisible lost time.
 |
The latest version allows creation of a central cost library that can be accessed by all projects. Even currency risk can be accounted for. The company also markets a C1 version that is used for modeling drilling campaigns. It incorporates probabilistic effects similar to P1, as well as a learning curve – one of the biggest factors for reducing costs. A significant number of oil and service companies are using the software. These include BP, Amerada Hess, Talisman, Shell, Petro-Canada, Kerr-McGee, BG, Petronas, Transocean and DNO Heather. 
|

