Exploration
Improvements in 4D seismic acquisition
Steerable streamers can improve repeatability for better reservoir monitoring, as well as offer better data coverage around obstacles
Ola Eiken, Statoil, Trondheim, Norway
Improving reservoir management is an ongoing challenge. 4D seismic is helping to meet this challenge in a growing number of cases. The technology has a multi-billion dollar potential value by increasing hydrocarbon recovery. However, to fulfill this potential, technical improvements are needed, as some recent failures have demonstrated. The technique is immature, and the industry’s appreciation and knowledge of the key issue of repeatability is limited, though rapidly evolving. Poor repeatability creates changes that are not related to the reservoir (i.e., artifacts) and are difficult to distinguish from true reservoir-induced changes in the seismic response. Repeatability – or lack thereof – will give a detection threshold on the minimum vertical fluid-front movements that can be monitored, on minimum saturation changes that can be observed and on how frequent repeat surveys can be made.
BACKGROUND
Some acquisition-related variations, such as navigation errors, source instability and varying tow depths can be better controlled now than some years ago, while more basic variations of spatial sampling, water-layer variations and background noise are still significant causes of non-repeatability in many cases.
Some of the more important factors causing variations in the acquired data are listed in Table 1. Those marked in yellow, such as tides and varying water velocity can, to a large degree, be corrected during data processing by proper time-shifts and attenuation of multiples and diffractions. Background noise and horizontal positioning, marked in red, are more basic limitations. Background noise has to be controlled by a proper acquisition specification. As for horizontal positioning, marine data are always spatially undersampled in the crossline direction, causing alias errors, and variable cable feather and source positions from pass to pass causes both midpoint and azimuth variations in streamer data. These variations are probably the most fundamental limitations to improved repeatability in state-of-the-art multi-streamer acquisition and processing technology.
| |
Table 1. Non-repeatable acquisition. |
|
| |
Cause |
Typical variation |
|
| |
|
|
| |
Background noise |
< 40 % |
|
| |
Horizontal positioning |
< 40 % |
|
| |
Water level & velocity |
< 1 % or 2.5 ms in time |
|
| |
Vertical positioning |
< 5 % |
|
| |
Sea state |
< 5 % |
|
| |
Source variations |
< 5 % |
|
|
The degree to which production effects in a 4D dataset are visible depends on the strength of the time-lapse signal. Preferably, the time-lapse signal-to-noise ratio should be greater than one, Fig 1. Unfortunately, many seismic monitor datasets do not achieve this, and are therefore not very repeatable. The degree of pure time-lapse signal is a function of the reservoir and cannot be influenced. However, the noise portion can be, and this is where improvements in repeatability would matter most. Even a small change in position causes a significant change in response, Fig. 2. It has been reported that, by towing many streamers at narrow separation and reconstructing a center line, repeatability as good as 5% difference amplitudes was obtained.1 However, this is far from today’s practice.
 |
Fig. 1. The blue line represents a signal to noise ratio of one. Ideally, S/N should be above the line to see the time-lapse signal. Vertical position in this crossplot is determined by reservoir properties, while improved repeatability would move the data horizontally and to the left of the line.
|
|
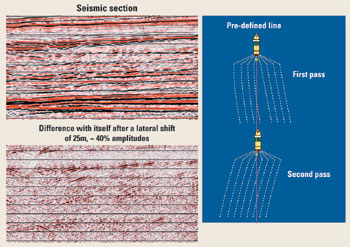 |
Fig. 2. Small positional differences (right) can create false time-lapse signals. Shown is a seismic section (top), laterally shifted 25 m and then subtract it from itself (bottom). Dipping events and diffractions leak through, here at an amplitude level of about 40 % of the image itself.
|
|
An improvement might be permanently installed seafloor sensors, which eliminate spatial variations on the receiver side. Front-end investments in hardware and deployment will be high for such systems, and little real-data experience exists. Coarser receiver sampling than along a towed streamer will give more aliased source-generated noise unless the shot sampling is very dense, and variable source positions will remain a cause of non-repeatability as it is for towed streamer data. Multiple attenuation could be improved by combining hydrophone and geophone data during processing, while coupling variations in time could be an additional source of non-repeatability. More experience on quality, cost and reliability of permanent seafloor receivers is needed to assess the value of such systems, and this is likely to take some years. Hence, the value of permanent systems compared to repeated streamer surveys (short term or long term) is not at all clear.
There has been a growing appreciation among operators that it may be beneficial and worth the extra expense to modify towed streamer acquisition for conventional 3D seismic mapping, as well as for 4D purposes. Fairly straightforward changes include denser cable separation and overlapping swaths, while infill-criteria based on previous vintages (baseline surveys) have been attempted. Denser spatial sampling reduced alias errors and unavoidable position errors within a bin-gather. Overlapping swaths, together with an increased number of streamers, give less variable coverage at swath boundaries, and makes a moderate degree of cross-currents and feathering acceptable. However, to completely eliminate the effect of variable cross-currents, the required close spacing between boat lines would increase the cost dramatically.
New streamer technology, called Q marine, provides horizontal streamer steering by use of novel steering devices. Digital recording of each hydrophone enables filtering of noise caused by cross-flow, which generates streamer vibrations. Acoustic navigation throughout the full streamer lengths provides improved navigation precision. The ability to steer horizontally improves predictability of receiver coverage and has the potential to improve repeatability from survey to survey. This could be used to improve the quality of 4D data. It may also improve data coverage as well as operational safety around obstructions.
Statoil and partners considered steerable cables as an interesting possibility to improve the quality of 4D data, and during the 2001 summer season, seismic monitoring data using this technology were acquired over two producing fields, Heidrun and Norne, in the Norwegian Sea,2 Fig. 3. When maximum lateral steering forces were applied, it was possible to force the streamers about 3° against the natural feather. No appreciable noise was added when the streamers were actively steered.
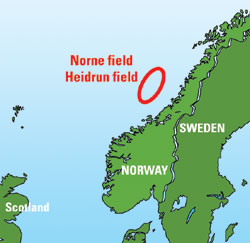 |
Fig. 3. Monitor surveys using new system with active streamer steering were acquired on Heidrun and Norne fields offshore mid-Norway in 2001.
|
|
HEIDRUN FIELD
Heidrun oil field is located 175 km west of mid-Norway. The drainage strategy is to maintain pressure with the use of water injectors down flanks and gas injectors up flanks. The ultimate aim of the time-lapse seismic was to find locations for possible infill wells.3 The base survey was acquired in 1986, well before production start-up, as a single-source/dual-streamer survey.
In 1998, a pilot time-lapse study was conducted at Heidrun, on data shot as an extension of an exploration survey. It was later discovered that one of the main problems of the 1998 survey was the shooting direction: it was at an about a 70°angle from the 1986 survey. Even after extensive time-lapse processing of both vintages, the non-repeatable noise was of the same order as the expected time-lapse signal. Thus, the data was too noisy to base a well decision on, Fig. 4 left side.
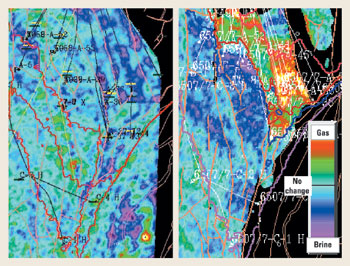 |
Fig. 4. Amplitude difference maps in a window around the top reservoir reflection on Heidrun field, after the 1998 repeat survey (left) and the 2001 survey (right). Impedance increases (water rise) are in blue, impedance decreases (gas cap expansion) in red and green. Signs of an oil-water contact rise (blue) were seen in 1998, but the data was too noisy to base a well decision on. The 2001 map is considerably clearer. Both gas-cap expansion (red and green) and water flooding of the reservoir (blue) are clearly seen.
|
|
The purpose of the 2001 repeated survey was to improve repeatability compared to the 1998 pilot and to find locations for infill wells. The survey was shot in the same direction as the base survey. Data were acquired using a single source and six cables towed with a front-end cross-line separation of 50 m and streamer lengths of 3,200 m. The goal was zero feather in this survey, which was obtained for most of the lines, but only after several time-consuming re-shoots.
Both vintages were processed simultaneously, with extensive testing to improve repeatability and remove multiples. Several matching filters were applied, including compensation for irregularly varying towing depths found in the baseline survey. Position errors found in the base survey were corrected by allowing lateral trace shifts. Inline shifts necessary to match the vintages were more than 50 m some places. The final maps are considerably clearer than in the 1998 pilot, Fig. 4, right side. It is now possible to use the 4D data in the planning of infill wells. Both expansion of the gas cap and water flooding of the reservoir are clearly seen. It should be noted that three more years of production probably increased the time-lapse signals.
Repeatability tests carried out with zero time-lag using steerable streamers gave significantly better repeatability than the time-lapse comparison with 1986,4 giving high expectations for the next repeat survey, planned in 2004.
NORNE FIELD
Norne oil field is located about 85 km north of Heidrun. The hydrocarbon resources comprise a gas cap (25 m), and an oil leg (110 m). To maintain pressure, gas and water are injected in the water zone and lower part of the oil zone.5 The base survey was acquired in 1992, prior to production start-up, and shot with dual source and three streamers.
Acquisition parameters of the repeat survey in 2001 were the same as for Heidrun, and the goal was again to achieve zero feather. Feather was less than 0.5° about 75% of the time. Weather noise and corresponding downtime seemed to be comparable to other streamer systems.
A surface obstacle such as the Norne FPSO would normally cause a hole 600 m – 1000 m wide by several km long in the good-quality data coverage, Fig. 5. This would hinder the monitoring of almost half of Norne field. The data hole was minimized by: 1) close-passes with an extra shooting boat; 2) streamer steering, allowing tow points as near as 40 – 50 m from the obstruction; 3) reduced streamer array width (50 m cable separation); and 4) a carefully planned and run operation. A small hole in the data is a requirement for successful monitoring of a narrow field such as Norne.
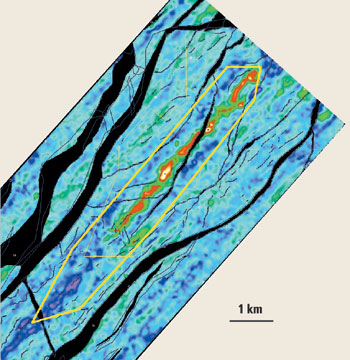 |
Fig. 5. Attribute map from Norne field overburden. Red and green colors show the size of poorer-quality data around the Norne FPSO. A much larger area of poor-quality data is usually the result of using conventional streamers and high-azimuth undershoot data, as indicated with a yellow polygon on the map.
|
|
The vintages have been processed twice – fast track and extensive. Optimal repeatability was obtained using shot/channel by shot/channel amplitude scaling, tidal static, global phase and amplitude matching, and inline-by-inline time-shift correction. The extensive processing included optimized global matching and time-shift analysis, and full pre-stack regularization and normalization, all before full Kirchhoff pre-stack 3D migration.
At Norne, difference data are required to observe the oil/water contact changes. The difference data were contaminated with dipping noise, probably caused by an irregular sea-bottom setting up side diffractions. The higher recording bandwidth in the 2001 data increased such noise. A harsh k-filter and a high-cut frequency filter were applied to remove steep-dipping noise, Fig. 6. After lowpass k-filtering, the rise in the oil/water contact is clearly seen, as well as increasing pressure around a water injector and gas injected into the water zone. The repeatability is obviously higher for low frequencies and wave numbers.
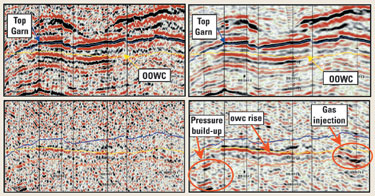 |
Fig. 6. Baseline image (above) and difference image 2001-1992 (below) from the Norne 4D study. Sections on the right side have a harsh, lowpass k-filter applied to remove dipping noise. After such filtering, a weak signal is observed that may be a rise in the oil/water contact.
|
|
The most important time-lapse effects are the rise of the oil/water contact and gas injection. In addition, expansion of the gas cap and pressure effects around some injectors can be interpreted. The water front inferred from the 4D data is in many areas different from the reservoir simulation model. This has further influenced the drilling program. A repeat survey of similar design was carried out June 2003.
STEERABLE STREAMERS
The monitor data are generally better quality compared to other time-lapse 3D (4D) surveys. In the signal and noise crossplot in Fig. 1, the latest Heidrun survey has now moved to the left and above the critical blue line, and the Norne data is farther to the left. The new monitoring data have resolved important monitoring issues, while smaller production effects (e.g., from thinner or tighter zones) may still be hidden in noise. How much of this improvement is due to the new streamer technology is difficult to assess, as the quality is limited by the older baseline surveys. The last good-quality vintage will be even more important in future monitoring, when differencing between two repeatable datasets can be made.
However, a major advantage of the system is its ability to get high-quality data coverage closer to surface obstructions. With steerable cables and an additional shooting vessel close-by on the other side of the obstruction, low-azimuth undershoot data were acquired.
This is an immediate benefit, as the base survey was made before the field installations were made. Our experience is that, on the operational side, streamer steering was stable, accurate and robust, and no appreciable noise was added by active steering.
The 3° steering limitation against natural feather is a severe limitation, since we are after repeated positions. In Norwegian waters, feather is typically less than 3° about 60% of the time, and less than 6° about 90% of the time. With another 2 – 3° of steering capability, zero feather could be achieved more than 90% of the time, and a full zero-feather survey could be feasible with some infill-shooting. We therefore believe an increase to about 5 – 6° of steering capability would be needed to practically acquire a zero-feather survey in conditions similar to Norwegian waters.
Thus far, single sensors give limited advantage, since levels of weather noise seemed to be only slightly improved compared to conventional cables, and the high frequencies and wavenumbers are poorly repeated anyway.
The improved navigational accuracy of the streamers due to the use of a denser acoustic positioning network was of limited geophysical advantage, although a necessity for the steering feedback system used at sea.
We believe the technology has a significant potential to improve the quality of marine 4D, particularly if greater steering force can be applied and the first survey is of sufficiently good quality.
It may offer a technically competitive and more economical alternative to permanently deployed seafloor cables, for high-precision monitoring of tight reservoirs and over short time-periods. And finally, cost/benefit ratios of the new streamer technology remain to be established. 
ACKNOWLEDGMENT
Statoil and partners Agip, ConocoPhillips, ENI, ExxonMobil, Hydro, Petoro, Shell and TotalFinaElf and are thanked for permission to show data and results. The crew onboard Geco Topaz skillfully acquired the repeat data. WesternGeco processed the Heidrun data and Geotrace Ensign processed the Norne data. In particular, the author acknowledges the work of Trine Alsos, Hans Aronsen, Anne-Kari Furre, Erik Håvarstein, Lars-Haakon Nordby, Bård Osdal, Johannes Hvidsten, Charles Jones, John Makin, Mindor Skaar and Patrick Smith.
LITERATURE CITED
1 Eiken, O., Ultveit-Haugen, G., Schonewille, M., and A. Duijndam, “A proven concept for acquiring highly repeatable towed streamer seismic data,” Geophysics, July – August 2003.
2 Eiken, O., Aronsen, H., Furre, A.-K., Klefstad, L., Nordby, L.-H., Osdal, B. and M. Skaar, “Seismic monitoring of the Heidrun, Norne and Midgard fields using steerable streamers,” Extended Abstract (A30), EAGE Annual Meeting 2003.
3 Furre, A-K., Munkvold, F. R. and L. H. Nordby, “Improving reservoir understanding using time-lapse seismic at the Heidrun field,” Extended Abstract (A20), EAGE Annual Meeting 2003.
4 Curtis, T., Smith, P., Combee, L. and W. Olafsen, “Acquisition of highly repeatable seismic data using active streamer steering,” Abstract from SEG Annual meeting 2002.
5 Osdal, B. and T. Alsos, “Seismic modelling of eclipse simulations and comparison with real 4D data at the Norne field,” Extended Abstract (A29), EAGE Annual Meeting 2002.
THE AUTHOR
|
 |
Ola Eiken is a geophysicist at the Statoil Research Centre in Trondheim, Norway. He has been working on geophysical reservoir monitoring issues for the last seven years, including various aspects of seismic monitoring (4D) and time-lapse gravimetry. The work has involved both methodology developments and asset support. He has five years of production and exploration experience from Statoil`s operational offices. Before that he carried out academic research in Arctic Norway (Svalbard). That work ranged from a snowstreamer development to regional interpretation of continental margins and deep-water sediments. He earned a Dr. Scient. degree in geophysics from University of Bergen.
|
| |
|
|

