Reservoir Characterization
Progressive seismic data mining for reservoir characterization
Cascading workflows that exploit certain characteristics of individual attributes help regulate the interpretation process and provide an avenue for the interpreter to progressively mine seismic data for information
Strecker, U., Taylor, G., Smith, M., Uden, R., Cooper, R., Rock Solid Images, Houston; Berge, T., Forest Oil, Denver, Colorado
Seismic interpreters are required to work with larger and larger seismic volumes as the amount of seismic data acquired and processed increases. Rapid advances in seismic-attribute methods further increase data-set sizes by providing many coincident seismic-attribute volumes for each data set. These exponential increases in available data represent huge data management and data interpretation challenges to our industry.
There are clear similarities between the seismic exploration industry and the Internet in terms of the volume of information that is available for analysis and, therefore, it makes sense to employ data mining tools and methods developed for other industries to address the needs of oil and gas exploration. In a case study from Ibhubesi field, Orange River basin, South Africa, data-mining workflows were used to enrich and discover knowledge about productive regions within 3D seismic data volumes. Seismic data mining was applied to multiple seismic-attribute volumes, calculated from a 3D dataset.
Large-amplitude anomalies are present on the full-stack data, also discernible when transitioning from near- to mid-angle sub-stacks. Most wells exhibiting a Class III AVO anomaly tested productive. However, the sand associated with the largest Class III AVO anomaly tested wet. Integration of well data, driven by synthetic seismic data, is critical to finding attributes to constrain the Class III AVO response.
Analysis of the well data indicated the importance of Poisson’s Ratio for discriminating pay from wet sands. Attributes derived from band-limited inversion of the seismic sub-stacks retained the discrimination observed in the well data. Additionally, other seismic attributes that discriminate facies and fluid types use neural networks to generate a single-attribute volume of the multi-attribute response. Results of this study demonstrate the value of applying data mining techniques to seismic volumes to rapidly seek prospective zones using some well calibration, thereby mitigating future drilling risk.
INTRODUCTION
Although an increase in lateral extent may yield more targets, larger seismic data volumes mean longer acquisition, processing and interpretation times. Additionally, incorporation of multiple seismic attributes into the interpretation process increases the number of data volumes that the interpreter is required to manage. Subsequently, this calls for meaningful data reduction. Cascading workflows that exploit certain characteristics of individual attributes can help regulate the interpretation process and provide an avenue for the interpreter to progressively mine the seismic data for information content.
Rapid reconnaissance of seismically defined leads and dynamic seismic reservoir characterization thus becomes possible. This case study combines solutions for seismic reservoir characterization with petrophysical well data. Multiple seismic-attribute analysis and seismic facies indicators can be of predictive value for seismic reservoir characterization that helps reduce future exploration risk.
GEOLOGIC OVERVIEW
Large natural gas reserves (>13 Tcf estimated) are present in the Orange River basin offshore western South Africa, Fig. 1. Ibhubesi field produces from Aptian (Lower Cretaceous) fluvial sandstones that formed during a sea-level fall that exposed the entire West African shelf. Ibhubesi field hosts the well with the largest IPGas (71 MMcfd) ever recorded offshore West Africa. The field lies along trend with Kudu gas field, located about 300 km to the NNW. Ibhubesi field is believed to be sourced from Barremian shales (Lower Cretaceous). Toward the west, down-slope, the hydrocarbon maturity level is interpreted to progressively decrease from dry gas over wet gas to oil. The equivalent deepwater portion of this play is still unexplored.
 |
Fig. 1. Location map, Ibhubesi field.
|
|
PROJECT WORKFLOW
The 3D seismic survey encompasses a 312-km2 area with a 12.5-m bin size. Water depth is about 250 m. Workflow is as follows:
- Precondition amplitude volume for attribute analysis via spectral extension and edge-preserving smoothing.
- “Mine” the 3D offset volumes for multiple seismic attributes.
- Determine which attributes are the best discriminators of lithology, fluid and geometry.
- Combine this attribute suite in a seismic facies indicator volume (an artificial neural network called a “Kohonen self-organizing map”).
- Produce a volume that is calibrated to rock properties.
Data conditioning. This process involves spectral extension of the 3D seismic data and edge-preserving smoothing (EPS). Spectral extension is a data-conditioning process that boosts inherent data frequency. EPS is applied using an adaptive, time-variant operator. Spectral extension increases spatial and temporal resolution of seismic data, whereas EPS facilitates recognition of abrupt terminations in the data. Akin to similarity, this process helps highlight structural and stratigraphic edges.
3D seismic interpretation and data mining: Exercises for seismic reservoir characterization. Multiple seismic attributes can be used to determine structural and stratigraphic reservoir geometries, lithology and fluid fill from seismic. Most wells exhibiting a Class III AVO anomaly tested productive. However, the sand associated with the largest Class III AVO anomaly tested wet. Additional issues that might further affect the successful use of AVO for fluid detection are:
- What other seismic attribute(s) can be found that respond to changes in fluid type?
- Assuming no wells were drilled, can the data be mined to discriminate volumes of potential pay from seismic attribute data alone for future drilling endeavors?
- Do seismic attributes reduce drilling risk?
The following section introduces a series of seismic attributes and their subsequent mining for information content.
Data mining – Step 1: Structural framework delineation. The cornerstone of applied subsurface mapping is to place established hydrocarbon production in the context of the surrounding structural framework. Here, two seismic attributes are used, similarity and spectrally decomposed amplitude data, centered at low frequency to aid the process. Similarity is a geometric, seismic multi-trace attribute that measures coherency in the seismic data. Hence, similarity is a detection tool that enhances structural and stratigraphic edges in the seismic data. The results of the similarity computation are shown in Fig. 2, where the trace of a regional fault is visible in time slice view.
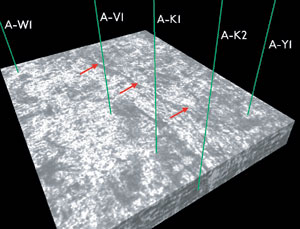 |
Fig. 2. Similarity. Trace of normal fault is visible on time slice separating the four upthrown wells in the foreground (A-W1, A-V1, A-K1, A-K2) from the downthrown well on the right (A-Y1). Red arrows demarcate normal fault trace on time slice.
|
|
Another effective way to demarcate fault traces seismically is to spectrally decompose the amplitude data. In this case, a 6-Hz-wide frequency sub-band was centered at 8 Hz. The result is the emergence of the trace of a regional fault, including resolution of subtle cusps and undulations in the fault plane geometry, Fig. 3.
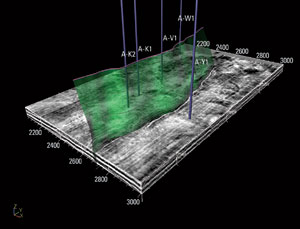 |
Fig. 3. Interpreted spectrally decomposed volume centered at 8 Hz. Regional fault (at 50% transparency) is shaded in green. AY-1 well in foreground.
|
|
However, placing the wells in the context of the structural interpretation obtained from using these attributes, it can be seen that none of the amplitude anomalies conform to structural grain, i.e., “hot” amplitudes do not fill the entire area defined by a possible three-way structural closure, Fig. 4. Instead, amplitudes are isolated, hinting at the importance of stratigraphic detail.
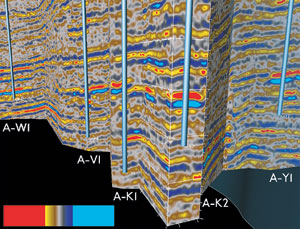 |
Fig. 4. Ribbon section through full-stack amplitude data. Note spatially isolated trough-peak amplitude couplets resonating higher than background.
|
|
Step 2: AVO. Large amplitude anomalies (e.g., a trough-peak couplet resonating higher than background) are present on the full-stack data and an AVO effect is discernible transitioning from near- to mid-angle stacks, Fig. 5. Negative amplitude anomalies become more pronounced at larger offsets, suggesting a Class III AVO anomaly, where brightening occurs over offset.
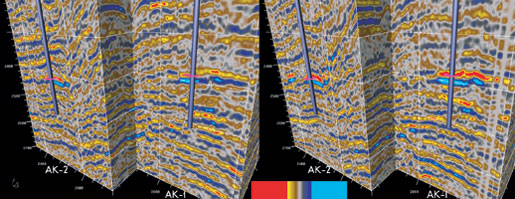 |
Fig. 5. Amplitude versus offset. Amplitude brightening occurs over offset transitioning from near- to mid-angle stacks. This behavior is representative of a class III AVO type anomaly. View is toward the north.
|
|
Step 3: Geometry of Class III anomalies. An important assessment is the potential reservoir geometry of Class III anomalies. Returning to similarity, we employ this geometric attribute as a tool to aid in the detection of seismic stratigraphic detail. The time slice view in Fig. 6 reveals a meandering channel interpreted as a fluvial meander belt
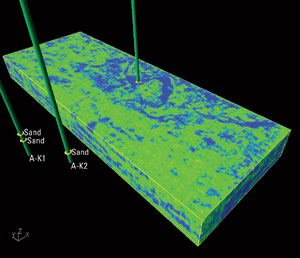 |
Fig. 6. Similarity volume. Note the prominent meander cut-off toward back of the probe. This anomaly was successfully penetrated by the AY-1 well for an initial gas production rate exceeding 70 MMcfd.
|
|
Step 4: Reservoir volume delineation. The presence of Class III AVO anomalies supports the notion that sand reservoirs exhibit lower velocities than encasing shales. A seismic attribute exploiting this behavior is relative acoustic impedance. This attribute is computed by integrating the real part of the complex trace. By selecting the low-end of relative acoustic impedance values, the interpreter can isolate reservoir volumes by voxel-based seed connectivity analysis.
In Fig. 7, low, relative acoustic impedance values have been seed-picked using voxel-based connectivity analysis. Selected seed-picks have been converted to surfaces with amplitude mapped atop as an attribute. Note how all sands are associated with large negative amplitudes values (red). However, the largest anomaly at the A-W1 well in the background tested wet. Thus, amplitude and relative acoustic impedance are good fluid indicators, but they alone do not carry sufficient information about fluid content. Although relative acoustic impedance serves as a powerful lithology and porosity indicator in this case study, neither impedance nor amplitude are good fluid discriminators.
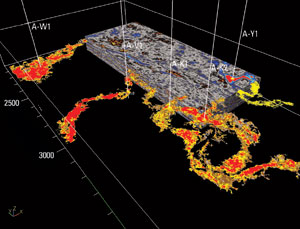 |
Fig. 7. Low, relative acoustic impedance values have been seed-picked using voxel-based connectivity analysis. Selected seed-picks have been converted to surfaces with amplitude mapped atop as an attribute. Large negative amplitudes are in red.
|
|
Step 5: Fluid discrimination (lambda-rho, fluid factor). Inspection of well data reveals Poisson’s ratio to average 0.2 over the producing interval, whereas the wet well is characterized by a Poisson’s ratio of about 0.25, Fig. 8. This observation lends support to the notion that some measure of Vp/Vs may help discriminate fluids from seismic. The bulk modulus K is believed to be sensitive to fluid change and relates Lamé’s coefficients l (lambda) and r (rho) to one another. Lambda-rho is sensitive to fluid change: the presence of gas in reservoir-type rock will decrease P-wave impedance, resulting in lower lambda-rho values, Fig. 9.
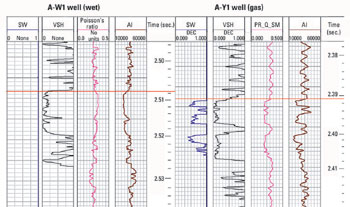 |
| Fig. 8. Log plot over reservoir sand interval in AW-1 well and AY-1 well with VShale (black), Poisson’s ratio (magenta), and Acoustic Impedance (brown) curves. |
|
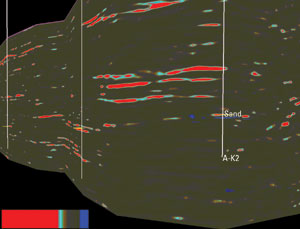 |
Fig. 9. Lower values of lambda-rho are interpreted as gas-charged reservoir.
|
|
Another way to test for fluids is by using the fluid factor as shown by Smith and Gidlow (1987). Here, as shown in Fig. 10, the fractional difference between the estimated and observed Vp is compared. If the difference is zero, no gas is present in the section.
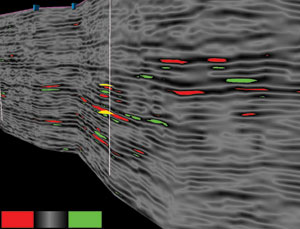 |
Fig. 10. Red-green doublet at A-K1 well is interpreted as gas response at reservoir top.
|
|
Combining in an ANN: Kohonen’s self-organizing map. Seismic-attribute analysis reveals that multiple attributes can be combined in a non-linear fashion via an artificial neural network (ANN), featuring unsupervised learning – Kohonen’s Self-Organizing Map – to effectively discriminate between lithologies and fluids. Eventually, those seismic attributes that prove to diagnose pay or wet reservoir conditions can be combined into such an ANN. In this case, relative acoustic impedance (lithology indicator), similarity (geometric attribute), and the two fluid discriminators discussed above were combined in an unsupervised neural network classification process.
The resulting three classes were subsequently calibrated to rock properties: gas sand, wet sand and shale. Results from the calibration successfully predicted reservoir conditions at all other well locations – which were held blind – and underscore the predictive value of rock-properties calibrated neural network technology, Figs. 11 and 12. From this exercise, it appears that rock-physics driven seismic data mining should help reduce exploration risk in the future. 
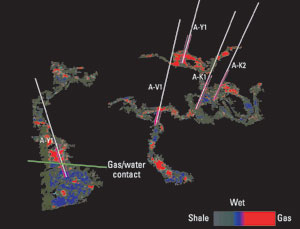 |
Fig. 11. Calibrated neural network. Results of rock- properties calibration have been mapped atop surfaces associated with subsurface sand bodies.
|
|
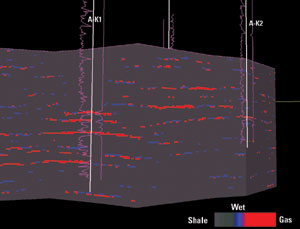 |
Fig. 12. Cross-section calibrated neural network. Magenta curve left of wellbore is an inverted VShale curve (i.e., high sand content kicks right). Magenta curve right of wellbore depicts water saturation.
|
|
ACKNOWLEDGMENT
3D seismic data and attributes are displayed using Magic Earth’s GeoProbe visualization technology. Graphics coordinated by Jason Tinder. The authors thank Forest Oil for permission to publish this data.
THE AUTHORS
|
| |
Dr. Uwe Strecker is geologist and manager of training for Rock Solid Images, Houston. Dr. Strecker previously worked for Belco Energy Corp. and UPR. He earned a PhD in geology from the University of Wyoming. His research includes His research interests include fission-track thermochronology and unconventional gas. He has developed two short courses for the interpretive use of seismic attributes.
|
|
Gareth Taylor is senior vice president of sales and marketing for Rock Solid Images, Houston. Mr. Taylor graduated from the University of Keele in 1978 with an honors degree in geology and geomorphology. He was employed by Digicon Geophysical Corp., CogniSeis Development and The Discovery Bay Co. before joining Rock Solid Images at its formation in 1998.
|
|
Maggie Smith is Manager of Seismic Data Products for Rock Solid Images, Houston. Ms. Smith has an honors degree in geology at the University of Glasgow, and has worked with Seismograph Service Ltd., Digicon Geophysical Corp., Neidell and Associates, Zydeco Energy. She joined Rock Solid Images in 1999.
|
|
Richard Uden is vice president of Research and Development and Technical Services for Rock Solid Images, based in Houston, Texas. Mr. Uden graduated from Southampton University UK in 1969 with an honors degree in mathematics. He has been employed by GSI, Continuum Resources and joined Rock Solid Images in October 2001 as a senior geoscientist.
|
|
Richard Cooper is president of Rock Solid Images, Houston. Before founding Rock Solid Images, he worked for Digicon (now Veritas DGC) and CogniSeis Development. Mr. Cooper earned a BS in geophysics from Liverpool University.
|
|
Tim Berge is chief geophysicist for Forest Oil International, based in Denver, Colorado. He obtained a BS in geology and geophysics in 1976 from the University of Wisconsin, Madison, and an MA in geology and geophysics in 1981 from the University of Texas at Austin. Mr. Berge has worked for Exxon and Apache. He joined Forest Oil Corp. in 1998.
|
| |
|
|

