Reservoir Characterization
Analyzing fractures from seismic for improved drilling success
Characterizing reservoirs on the Pinedale anticline: Finding the sweet spot can make the difference between success and failure
David Gray, Sean Boerner, Dragana Todorovic-Marinic and Ye Zheng, Veritas DGC, Calgary, Canada
The Pinedale Anticline in Wyoming, USA, has become an area of significant interest since the recent success of several gas wells completed in its tight sandstone reservoirs. Production from these reservoirs is now possible using new stimulation techniques that were developed in neighboring Jonah field. The best production rates appear to come from reservoirs enhanced by natural fractures. Therefore, a new technique that detects open natural fractures in the reservoir could help the success of future wells.
This new technique, AVAZ, uses azimuthal variations in the amplitudes of seismic data, at long shot/receiver offsets, to identify fractures. A modification of this technique has been used on a portion of Veritas’ multi-client 3D survey over the Pinedale anticline to identify the presence of these fractures in the interwell region. Results of this analysis were compared to what is already known about fractures in the reservoirs of the Pinedale anticline.
INTRODUCTION
Pinedale anticline (Fig. 1) contains an estimated 159 Tcf of sweet gas in-place,1 of which less than 1% has been produced. Pinedale and the adjacent Jonah field are the fastest growing producing fields in the American Rocky Mountains. Reservoirs of interest in the Pinedale anticline are the tight sands of the Lance, and the Rock Springs and Ericson formations that comprise the upper Mesaverde, Fig. 2. These units were deposited during a period of rapid sedimentation in the late Cretaceous. Sediments were eroded off the western upland and carried by fluvial systems flowing to the east.
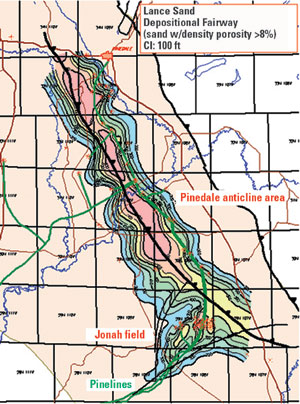 |
Fig. 1. Map of the Lance Sand depositional fairway over the Pinedale anticline (from Ultra Petroleum).
|
|
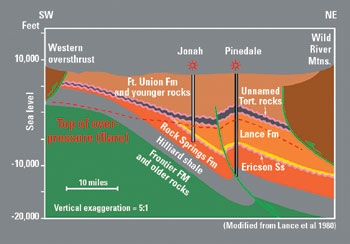 |
Fig. 2. Geologic formations in the Pinedale anticline (from Ultra Petroleum).
|
|
Lithologically, the Lance and upper Mesaverde consist of fluvial channel sandstones and siltstones, floodplain shales and minor coals. The Lance and Mesaverde were buried by up to 8,000 ft of Tertiary section, which compressed these into low-permeability sandstones. Source rocks include discontinuous coals and carbonaceous material in shales interbedded with the sandstones.
Single sandstone units average 25 ft thick.2, 3 As a result, these reservoirs tend to be small, and individual reservoirs might not be commercial. However, when several of these sand bodies are stacked vertically, an amalgamated package can be as thick as 100 ft, and viable commercial wells may be drilled into these stacked sands.4 Through the entire sequence of more than 3,000 ft, a vertical well may encounter up to 100 individual sandstone units.
The reservoir rocks have moderate porosity ranging from 8 – 12% and usually have low permeability unless enhanced by natural fractures. Evidence of natural fractures comes from higher production rates seen in some of the wells in Pinedale and Jonah, for example, the Antelope 15-4.5 These production rates would not be possible without some kind of permeability-enhancing mechanism such as natural fractures. Therefore, the key to success in Pinedale anticline is to find areas where open natural fractures enhance the low permeability of the reservoir rocks.
If a well is drilled near a large swarm of natural fractures, then a hydraulic fracture treatment can connect the wellbore to a larger area of the reservoir. Pinedale anticline is the largest commercial gas accumulation in the Northwestern Green River basin.6 Oil and gas exploration on the anticline has a long and, until recently, relatively unsuccessful history. Current interest is due to recent successful wells drilled by Ultra Petroleum, Western Gas Resources and McMurry Oil.
The first well drilled on the anticline was by the California Co. in 1939. Local papers reported the 10,000 ft Government-1 exploratory well as a gas discovery. Little additional exploration occurred until El Paso Natural Gas entered the area, drilling nine exploratory wells between 1954 and 1971. The wells encountered significant gas shows in the Fort Union and Lance formations, but production rates were disappointing.
In 1969, a well was drilled on the anticline as the proposed site of an experiment comprising five separate nuclear explosions in a single wellbore, each about 100 kilotons, deployed from 9,000 to 11,650 ft, to be fired sequentially for the purpose of stimulating production. El Paso drilled the Wagon Wheel-1 well for this purpose to a depth of 19,000 ft into the Hilliard shale. However, the proposed nuclear explosions never occurred due to environmental concerns, and the well was reported as completed for 200 Mcfd. The important U.S.G.S. Bulletin 1886 was published using the results from extensive cores and tests at the proposed nuclear stimulation site.1
Through the 1970s, ’80s and early ’90s, there was a limited amount of activity on the anticline. There were no commercial successes until 1997 – ’98, when new stimulation techniques developed at nearby Jonah field were successfully used in the Pinedale anticline. Now there is considerable interest in the gas potential in the area.
AVAZ METHOD
It has been shown that open, liquid-or gas-filled fractures can be identified through the use of Amplitude vs. Angle and Azimuth (AVAZ) analysis on seismic data.7 – 12 This technique uses amplitude variations in the long shot/receiver offsets of P-wave seismic data to determine the intensity and orientation of fractures. It assumes that fracturing generates a rock medium that is Horizontally Transverse Isotropic (HTI) – meaning one open set of near-vertical, fluid-filled fractures in a homogeneous background material. The technique is described by Jenner13 and is based on the Azimuthal Amplitude vs. Incident Angle and Azimuth equation of Rüger,14 which predicts that an HTI medium will produce a variation in the AVO gradient with azimuth, Fig. 3.
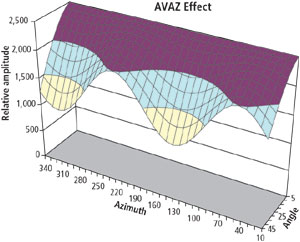 |
Fig. 3. Rüger’s model of the anisotropic effect caused by a single set of fractures in a homogeneous background fitted to the real seismic response shown in Fig. 4. The effect becomes greater with increasing angle of incidence and can be captured using AVO gradient variations with azimuth.
|
|
Analysis of seismic data for fractures uses a multi-linear regression to fit the pre-stack amplitudes of the seismic data to Rüger’s equation using an estimate of the reflecting angle and an estimate of the azimuth of the incident seismic ray at the reflection point as predictor variables.13 An example of one such fit is shown in Fig. 4. The parameters of Rüger’s equation can be modified to produce attributes that may be useful in the identification of fractures between wells. The multi-linear regression analysis is done at every seismic sample to estimate these parameters. Thus, the output of the process is four seismic attribute cubes corresponding to the parameters of the modified Rüger equation.
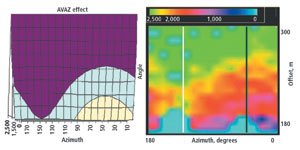 |
Fig. 4. Top view of Rüger’s model (left – using the same amplitude scale as Fig. 3) compared to the amplitudes of a real seismic gather sorted into offset and azimuth (right – amplitude scale displayed above). Note the excellent amplitude correlation in the model to those in the real data (blues are dead traces), suggesting the model is sufficient to explain these amplitude variations.
|
|
The attributes chosen to output are:
- Estimated anisotropic gradient
- Estimated azimuth of anisotropic gradient minimum
- Estimated P-wave reflectivity
- Estimated S-wave reflectivity
These attributes are useful because they each contain different information that may be relevant to identification of fracturing if the reflection comes from an HTI layer overlain by a layer that is horizontally isotropic. If so, the anisotropic gradient is closely related to seismic crack density in the underlying layer.15 The azimuth of the anisotropic gradient is the strike of the fractures in an HTI medium. P-wave reflectivity is the response of the rock to compression by the seismic wave and includes information on the rock’s lithology and fluid content. S-wave reflectivity is the response of the rock to shearing by the seismic wave and primarily holds information about lithology.
RESULTS/DISCUSSION
Fig. 5 shows some AVAZ results. Fractures correspond to increased stress near the top of the anticline. The highly fractured zones are cut at the fault, west of the crest. Note that areas of high AVAZ crack-density values can be seen extending east down the flank of the anticline in the northern part of the study area. These high values may indicate another area of more intense fracturing on the flank of the anticline, where further investigation may prove fruitful.
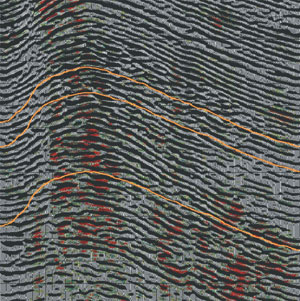 |
Fig. 5. Estimated crack density overlaid by the migrated stack. More intense fracturing occurs in zones of high stress, e.g., around the fault on the west side of the anticline, on the crest and down the right flank of the anticline near the inflection point.
|
|
Fig. 6 shows a visualization of the results of geobody detection that has been used on zones of high seismic anisotropy that intersect a wellbore. These zones probably indicate swarms of intense fracturing. This visualization technique also provides a good estimate of the drainage area of these reservoirs. The drainage area appears to be quite anisotropic and varies for each geobody.
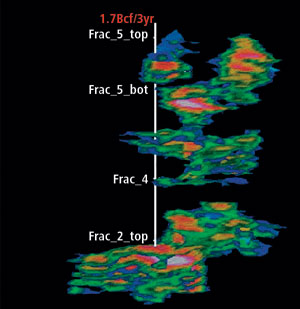 |
Fig. 6. Visualization of fracture swarms around the well track of a good gas well in Pinedale field. Text indicates tops and bottoms of hydraulic fracture treatments.
|
|
Extending this analysis throughout the 50 sq mi analyzed for AVAZ in the Pinedale 3D survey, Fig. 7 shows that most wells have been drilled along the top of the anticline, while many of these fractured sandstones exist in the western half of the anticline, where few wells have been drilled. This region sits between the reservoir top and a fault to the west, a likely area of high stress. Note that only a few wells have intersected areas of high seismic anisotropy and even then, only at the edge of the AVAZ crack-density anomaly.
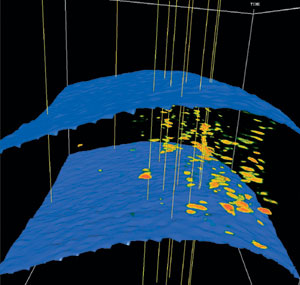 |
Fig. 7. View from north end of the Pinedale anticline showing well traces and geobodies of high crack density between the top of the Upper Lance and the top of the Mesaverde formation.
|
|
Strong estimated shear-wave amplitudes in the same region correspond to the locations of high values of crack density. Shear-wave amplitudes should also show areas of more sand, since they react primarily to rocks and not fluids, and sands typically have higher shear rigidity than shales. Therefore, shear-wave amplitudes tend to affirm preferential sand deposition in this area.
A remarkable feature of this result is that the vertical extents of the geobodies correspond very closely with the tops and bottoms of hydraulic fracture treatments. If the drillbit encounters permeable fractures and if the drilling mud has a pressure greater than the reservoir pressure, the mud spurts into the fractures, causing a spike in the mud log. Thus, mud losses indicated on the mud log can be a good indicator of fractures. Fracture treatments have been performed in zones in this well where fractures are identified by the mud log and sandstone is indicated by the gamma ray log.
Fracture treatments themselves typically do not have significant effects more than a short distance from the well, so AVAZ analysis will usually not see their effects on seismic data, due to its limited spatial resolution. What this suggests is that these AVAZ results, which are supposed to indicate the presence of fractures, are actually indicating the presence of fractured sandstones reservoirs. If the anticline’s tight sands are more brittle than the more ductile, surrounding shales, this observation makes sense. In that case, the crack density measurement – approximately Rüger’s anisotropic gradient – can be used to distinguish between fractured sandstone and shale lithologies in this field. This effect has been observed in other reservoirs.10, 18
Since gas charge is not a problem in this field, the most important factor is lithology. Zones of high crack density, estimated using AVAZ, may indicate zones of thicker sandstone deposition and, therefore, preferred drilling locations. These zones correlate with production from wells and the shear reflectivity derived as part of the AVAZ analysis. This indicates that the crack-density attribute shows the presence of gas-charged fractured sand bodies in this field. Visualization of stacked zones of higher crack density suggest that most wells should be drilled vertically, or nearly so.
FRACTURED RESERVOIR CHARACTERIZATION
Historically, fractured reservoir characterization has been done with well information and indirect measures of fracturing between wells, such as curvature, distance from faults and lithology. It has recently become possible to incorporate AVAZ attributes into reservoir characterization,16 allowing better determination of fractures between wells and, thus, a better understanding of reservoir fluid flow. However, in the past, these results have been difficult to tie to well control due to the paucity of direct fracture indications at the wells. This causes difficulty in relating seismic anisotropy measurements to fractures.
SUREFrac is a neural network reservoir characterization tool used to predict fracturing in the Pinedale anticline, incorporating AVAZ attributes with those mentioned above.16, 17 This tool:
- Uses a nonlinear neural network especially designed for fractured reservoirs
- Allows for calibration of various input attributes to the fracture output
- Allows for the use of seismic attributes
- Ranks various inputs on their relative ability to predict fractures, in order to determine which attributes are most important in predicting fractures in a given reservoir
- Has suitable output for incorporation into common, commercial reservoir simulators.
The way this software is used is by first identifying a fracture indicator (FI), and then ranking the various inputs that geoscientists and engineers familiar with the field suggest may have influence on it. For this field, four-month cumulative production is chosen as the fracture indicator. This is the best indicator of fractures in this field due to the scarcity of good well information on fractures and limited production from the recent, better wells. The field has very few long-term producers since the aforementioned new completion techniques began. The clearance of some environmental issues has recently revitalized it.
The FI correlates well to Expected Ultimate Recoverable (EUR,) a measure often used as a fracture indicator, Fig. 8 (11). AVAZ and other seismic attributes were used as inputs to the software’s ranking process, along with geologic models of porosity, net-to-gross, coal and the structural interpretation. Geologic information was derived from analyses and interpretation of wells available in the public domain and from the Pinedale 3D seismic survey. Rankings of the most important inputs to the software in predicting the FI are shown in Fig. 9. Crack density (AVAZ amplitude) and its envelope are the most important attributes in these rankings – more important than the next attributes, the semblances, which are commonly used for fracture detection. Based on the best ranked of these attributes, multiple realizations of reservoir simulations were generated by the neural network. Realizations were created both with and without the AVAZ attributes.
 |
Fig. 8. Correlation between four-month cumulative production and EUR.
|
|
 |
Fig. 9. Rankings of the relative ability of various attributes to predict the fracture indicator in Pinedale field. LL = the interpreted depth of top of Lower Lance; ML = top of Mid-Lance; UL top of Upper Lance; K = top of the Cretaceous.
|
|
Based on this fractured reservoir characterization, we predicted in July 2002 that Ultra Petroleum’s Riverside 4-10 well, then being drilled, would be among the best producers from this field. Riverside 4-10 had initial production of 13.6 MMcfd, produced 461 MMcf in its first four months (our FI) and produced 756 MMcf of gas in the initial seven months. (The best well in the field to date is the Riverside 1-4 well that produced 699 MMcf in its first four months of production.) Thus, production from Riverside 4-10 confirms our prediction. Furthermore, the reservoir characterization using AVAZ (Fig. 10, right) suggests that the high FI indicated at the Riverside 4-10 well may continue to the excellent wells, including Riverside 1-4, just outside our study area to the North.
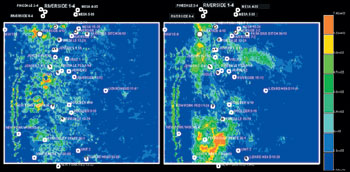 |
Fig. 10. Left – output of program using all attributes except those from AVAZ (new well, Riverside 4-10, is white dot at top). Right – output using all attributes including AVAZ attributes.
|
|
Attributes traditionally used to identify fractures in this reservoir indicate that Riverside 4-10 should produce only 2 MMcf in four months. Since this well had an initial production of 13.6 MMcfd, this result is clearly incorrect. The reason is because this is a relatively new field, and it is under-sampled by the wells. Most of the wells have been drilled on the top of the anticline, while those previously drilled on the anticline’s flanks have been relatively unsuccessful. Therefore, in any statistical analysis, there is a bias toward wells at the structural crest. Riverside 4-10 is located down-flank between the top of the structure and the fault to the west, in an area that AVAZ analysis identified as more highly fractured, Fig. 11. Through the incorporation of the AVAZ crack-density attribute, the neural network has been able to extrapolate the successes on the top of the structure down-flank to where this well has been drilled.
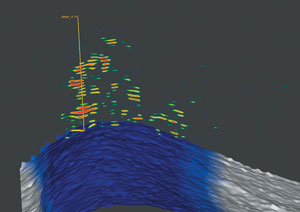 |
Fig. 11. AVAZ crack density results along a dip line intersecting the Riverside 4-10 well location. Note the stacked AVAZ crack density anomalies (red) at the location of this successful well.
|
|
FURTHER WORK
The next step is to incorporate recent well information – as it becomes available – to refine the FI estimates and to extend this analysis to the rest of the Pinedale anticline field and neighboring Jonah field. This involves AVAZ analysis over the remainder of suitably acquired, wide-azimuth, seismic surveys. Petrophysical analysis will follow, using the public-domain well data outside the study area, as well as new wells drilled since completion of this study. Confirming the well-derived attribute rankings over the larger survey area and including new wells and seismic attributes over the entire volume would make the field characterization more robust, allowing multiple neural network realizations over the entire field area. Collaboration by everyone with interests in this field(s), including the authors, and geoscientists/engineers of oil and gas companies, would benefit all through refinement of the geologic model. 
ACKNOWLEDGMENTS
The authors thank the following people and organizations whose assistance made this work possible: Abdel Zellou, Ana Abad, John Robinson, Brad Bankhead, Rick Trevino, Ahmed Ouenes, Patrick Wong, Leonhard Ganzer, Jeff Harwell, Dave Purcell, Scott Cheadle, Ken Tubman, Sue Bigham, Sue Rezai, Jamie Gray, Placer Deguzman, and Veritas Land Surveys. Portions of this article are from a paper of similar name published in the CSEG RECORDER in June 2003.
LITERATURE CITED
1 Law, B. E. and C. W. Spencer, “Geology of tight gas reservoirs in the Pinedale anticline area, Wyoming, and the Multiwell Experiment site, Colorado,” U.S. Geological Survey Bulletin 1886, 1989.
2 Bowker, K. A. and J. W. Robinson, “Jonah field: A shallow sweetspot in the basin-centered gas accumulation of the northern Green River basin, Wyoming,” American Association of Petroleum Geologists Bulletin, Vol. 81, p. 1219, 1997.
3 Montgomery, S. L. and J. W. Robinson, “Jonah field, Sublette Co., Wyoming: Gas production from overpressured Upper Cretaceous Lance Sandstones of the Green River basin,” American Association of Petroleum Geologists Bulletin, Vol. 81, pp. 1049 – 1062, 1997.
4 Gibson, R. I., “Greater Green River basin,” Rocky Mountain Oil Journal, http://www.gravmag.com/grnriv.htm
5 Shaul, R., “Jonah field could hold $15 billion in natural gas,” Sublette County Journal, Vol. 5, No. 6, 2000.
6 Freeman, D., “3-D helps cut costs at Jonah field,” AAPG Explorer, May, 1999.
7 Gray, F. D., Head, K. J., Chamberlain, C. K., Olson, G., Sinclair, J. and C. Besler, “Strike analysis: A core matter,” AAPG Explorer, No. 9, 1999.
8 Gray, F. D., Head, K. J., Chamberlain, C. K., Olson, G., Sinclair, J. and C. Besler, “Using 3D seismic to identify spatially variant fracture orientation in the Manderson field,” SPE Paper 55636, 1999.
9 Gray, F. D. and K. J. Head, “Fracture detection in the Manderson field: A 3D AVAZ case history,” The Leading Edge, Vol. 19, No. 11, pp. 1214-1221, 2000.
10 Gray, F. D., Roberts, G. and K. J. Head, “Recent advances in determination of fracture strike and crack density from p-wave seismic data,” The Leading Edge, Vol. 21, No. 3, pp. 280-285, 2002.
11 Hall, S., Kendall, J. M., Barkved, O. and Mueller, M., “Fracture characterization using P-wave AVOA in 3-D OBS data,” 70th Ann. Internat. Mtg: Soc. of Expl. Geophys., pp. 1409 – 1412, 2000.
12 Roberts, G., et al, “Estimation of fracture orientation, offshore Abu Dhabi,” 71st Annual Internat. Mtg., Soc. Expl. Geophys., Expanded Abstracts, 2001.
13 Jenner, E., “Azimuthal anisotropy of compressional wave seismic data, Weyburn field, Saskatchewan, Canada,” PhD Thesis, Colorado School of Mines, 2001.
14 Rüger, A., “Reflection coefficients and azimuthal AVO analysis in anisotropic media,” Doctoral thesis, Center for Wave Phenomena, Colorado School of Mines, 1996.
15 Lynn, H. B., Simon, K. M. and C. R. Bates, “Correlation between P-wave AVOA and S-wave traveltime anisotropy in a naturally fractured gas reservoir,” The Leading Edge, Vol.15, No. 8, pp. 931 – 935, 1996.
16 Boerner, S., Gray, F. D., Zellou, A., Todorovic-Marinic, D. and G. Schnerk, “Employing neural networks to integrate seismic and other data for the prediction of fractures intensity,” submitted for 2003 Society of Petroleum Engineers Annual Meeting.
17 Ouenes, A. and L. A. Hartley, “Integrated fractured reservoir modeling using both discrete and continuum approaches,” SPE Paper 62939, 2000 SPE Annual Technical Conference and Exhibition.
18 Bunge, R. J., “Midale reservoir fracture characterization using integrated well and seismic data, Weyburn field, Saskatchewan,” Masters thesis, Colorado School of Mines, 2001.
THE AUTHORS
|
 |
David Gray is a research geophysicist and AVO specialist for Veritas in Calgary, Canada. He earned a BSc degree in honours geophysics from the University of Western Ontario in 1984 and a masters of mathematics in statistics from the University of Waterloo in 1989. He joined Veritas in 1988, where he has held positions as Processor, AVO Specialist and Research Programmer. He has authored or coauthored more than 50 papers on AVO techniques and methodology. He is a professional geophysicist certified by APEGGA and a member of the CSEG, SEG, EAGE and SPE.
|
 |
Sean Boerner is a principal geophysicist for Veritas Exploration Services. He received his BS and MA degrees in geophysics from the University of Texas at Austin. He has over 12 years of experience in geostatistical modeling, including depth conversion, 3D property modeling, and framework construction. In addition, he has written neural networks and investigated global optimization methods. As a geophysicist for Mobil Exploration and Producing Technical Center, he worked on projects worldwide.
|
 |
Dragana Todorovic-Marinic is a senior geoscientist with Veritas GeoServices’ Reservoir Studies Group where she leads Veritas’ FractAL AVAZ team. She has over eight years of industry experience in research in material science. She joined Veritas as a geophysical analyst, analyzing seismic data using AVO attributes, AVAZ and inversion for the last five years in a multitude of geologic settings throughout the world. Dragana earned her BSc in Physics from the University of Sarajevo in 1988, and received an MSc in Physics from the University of Calgary in 1996. She is a member of the CSEG, SEG and SPE.
|
 |
Ye Zheng is a research programmer with Veritas GeoServices. He has worked on a wide range of projects, including velocity analysis, statics, migration, AVO analysis and fracture detection. His current research interest is in seismic azimuthal anisotropy and integrating migration and fracture analysis. He earned his BSc from the University of Science and Technology of China and MSc from the University of Calgary. He currently is a PhD candidate and working on his dissertation in his spare time. He is a member of CSEG, SEG and EAGE.
|
| |
|
|

