|
| |
|

By Petroleum Technology Transfer Council |
Electromagnetic survey defines reservoir, prevents drilling poor prospect
A drilling prospect, thought to have about three sq mi of structural closure, actually had only 400 acres of closure, making it too small to warrant drilling
Terry Donze, Consulting Geophysicist/Geologist, Denver, Colorado
A new electromagnetic (EM) survey technique developed by Montason Exploration, Inc., has been used to define areal extent of a Niobrara prospect in eastern Colorado’s Denver-Julesberg basin. The prospect, thought to have about three sq mi of structural closure, actually had only 400 acres of closure according to the EM survey. Considering remote pipeline access, the potential reserves were too small to warrant drilling. The EM survey and interpretation helped the operator avoid large land, exploration and development costs for the project.
EM surveys. When water saturation changes in a reservoir, the range of resistivity variation is much greater than the range of seismic velocity variation, Fig. 1. EM surveys use resistivity changes to determine fluid content. Montason’s EM system for oil and gas prospecting measures layer conductivity and derives a virtual resistivity log that is practical for geological mapping and hydrocarbon delineation, thereby reducing exploration risk. Some of the scientific theory behind this system has been published in both the US and Russia. Lab tests on a variety of reservoir characteristics were verified prior to independent field testing, after which practical application of the system was tested and proven several times in the field.
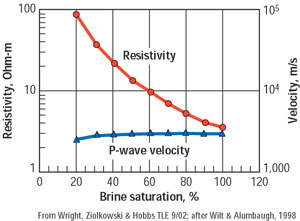 |
Fig. 1. When reservoir water saturation changes, the range of resistivity variation is much greater than the range of seismic velocity variation. EM surveys use resistivity change to determine fluid content.
|
|
The system records the magnetic induction caused by electrical signal pulses put through a transmitter wire on the ground. Typically, four magnetometer receivers can be placed at distances up to about 1.5 mi away, which sample the subsurface in between transmitter and receiver. Permitting costs are low and there is negligible surface disturbance. Transmitter design depends on the depth to target and any topographic limitations. Both the input electrical signal and the earth’s magnetic response are sampled and records are synchronized between the two using GPS-timing techniques.
Cultural infrastructure such as electric transmission lines, electrified pumps, pipelines with cathodic protection and heavy vehicular traffic areas affect magnetometer response. As with other exploration tools, calibration to local subsurface conditions improves the accuracy of data analysis. It is preferable to sample data at a well, but other calibration methods can be used.
Computer routines process the field data and derive a conductivity log that can be used for mapping purposes, or inverted for use as a resistivity log. These surveys are highly efficient, with data analysis completed in days, rather than weeks or months, allowing for versatility in field operations. Because of short acquisition and processing time, if an anomaly is found, the field crew can be redirected to survey it on a tighter grid before moving to another project.
The depth of investigation with current operating routines averages about 2,500 ft, but useful data has been collected below 3,000 ft, showing that signal penetration is somewhat area dependent due to subsurface resistivity changes. System designs for signal penetration well below 5000 ft are now being incorporated and will be available for production work about mid-year.
Potential application areas. EM targets a change in electrical properties to determine boundaries. Mineralized zones generally have significantly high electrical contrasts with their host rocks, offering easy identification. The productive Niobrara generally has a 2:1, or greater, conductivity contrast with surrounding layers, a 100% change, but this EM system can define much lower changes. There necessarily must be a conductivity/resistivity difference for EM to delineate a favorable zone’s boundaries. The system can be used in reconnaissance work to high-grade areas as well as for individual prospect evaluations.
It has potential for use in delineating stratigraphic traps, since facies boundaries generally result in resistivity changes. Reservoir monitoring over time could be done using EM logging techniques to map the edges of gas storage projects, waterfloods and other secondary recovery projects. Other oil and gas exploration targets besides the Niobrara are candidate applications, including shallow gas prospects in California; shallow formations in the eastern and central US, such as the Ordovician Trenton; and shallow Tertiary and Cretaceous sands as well as Paleozoic carbonates in the Rocky Mountain provinces and elsewhere. Coal beds have generally strong resistivity contrasts with surrounding rocks, but even local conductivity variations in coals can be mapped using electromagnetics, promising identification of better zones for CBM production. Non-oil and gas uses include mineral and groundwater exploration, environmental work and archeological investigations.
Field verification. Before using this system for exploration work, it was tested under actual field conditions in eastern Colorado in the shallow portion of the Denver-Julesburg basin. There, the low-resistivity Pierre shale overlies the gas-bearing Smokey Hill chalk, the upper member of the Cretaceous Niobrara formation. Niobrara pay thickness varies from 25 ft to 70 ft; porosity range is 30 – 40%; permeability is generally less than one mD, and the reservoir needs stimulation. The formation’s high organic content sources itself, but the reservoir has subnormal pressure. Ideal depths for commercial gas are between 1,200 ft and 4,000 ft. Structurally trapped wells typically produce 20 to 500 Mcfgd, with recoverable reserves generally 100 to 700 MMcf, ranging up to 2 Bcf. Niobrara resistivity is generally 1 to 2 Ohm-m in wet, off-structure wells and 4 to 25 Ohm-m in productive wells, providing a good contrast for EM measurements.
Beecher Island field is a faulted Niobrara anticline covering 27 sq mi and containing over 200 wells. Production is at about 1,400 ft, with about 200 ft of structural closure. The EM system was tested on its crest. The results (Fig. 2 and Table 1) compare the survey versus actual field logs and values, showing that when the Niobrara is gas saturated, it is possible to accurately measure the depth and resistivity in the pay zone. In the non-productive Niobrara, however, there is little resistivity change, and EM logging does not show a contrast.
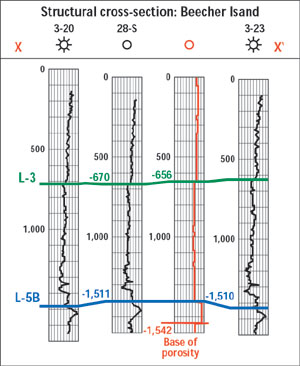 |
Fig. 2. Results of an EM survey of Beecher Island field show that when the Niobrara is gas saturated, it is possible to accurately measure depth and resistivity of the pay zone. There is little resistivity change in the non-productive Niobrara.
|
|
| |
Table 1. Beecher Island EM survey results |
|
| |
Subsurface Layer |
Field actual |
MEI survey |
|
| |
Layer 2-B |
3.5 Ohm-m |
3.5 Ohm-m |
|
| |
Layers 3 and 4 |
2.7 Ohm-m |
2.7 Ohm-m |
|
| |
Beecher zone |
10 Ohm-m |
10 Ohm-m |
|
| |
Top Layer 3 |
670 ft |
656 ft |
|
| |
Top Beecher (L–5B) |
1,511 ft |
1,510 ft |
|
|
EM survey of specific prospect. An exploration survey was done over a Niobrara subsurface geological lead at a depth of about 1,800 ft. The prospect offered good production economics due to its size, estimated at roughly three sq mi of structural closure. The survey design resulted in a grid of 29 points with conductivity logs that were added to the existing subsurface data to produce the EM-derived structure, Fig. 3. The red oval shows the approximate location of the original subsurface lead.
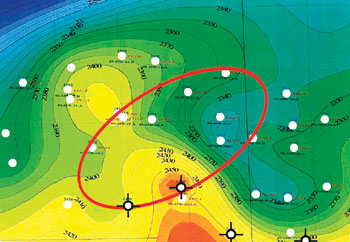 |
Fig. 3. A survey with conductivity logs added to the existing subsurface data produced this EM-derived structure. Red oval shows location of original subsurface interpretation. The structure was found to the northwest of its postulated location, and was substantially smaller.
|
|
The structure was found to exist, albeit to the northwest of its postulated location. However, it was substantially smaller than anticipated, covering only about 400 acres. Because of remote pipeline access, potential reserves were too small to warrant drilling. The exploration costs, including acreage, drilling, completion, etc., that would have been spent on this uneconomic venture were saved by use of EM logging.
Economic benefits. Everybody wants more reliable data, faster and cheaper, to reduce risk and increase drilling success, thus improving their bottom line. Seismic acquisition costs are increasing, and 3D surveys don’t measure fluid content well. This EM survey technique, and other techniques that prove/disprove hydrocarbon presence, make good economic sense for reducing exploration cost and reducing risk. 
ACKNOWLEDGMENT
The author thanks John P. Lockridge, president of Mountain Petroleum, for allowing use of the Beecher Island test site. An expanded article appeared in AAPG’s Explorer magazine in March 2003.
THE AUTHOR
|
| |
Terry Donze is an independent geophysicist/ geologist with more than 30 years experience working from Denver, Colorado. Previous employers include Amoco, Tenneco and Northern Natural Gas. Mr. Donze holds a geological engineering degree from University of Missouri-Rolla. tdonze@aol.com
|
| |
|
|

