Natural Gas:
North American Outlook
Natural gas in North America – No one said it would be easy
Prices have moved onto a new plateau that will restructure the order of competing supply sources
Leonard Parent, Contributing Editor
The outlook in 2003 is moderately optimistic. Wellhead prices should average close to $4.00/MMBtu, while the gas well rig count should get back to around the 800 level. A recovery in gas demand back to the 2001 level is the most likely outcome for 2003. With only a modest increase in demand – related to cold weather – and some new storage projects coming on, storage should be adequate to meet next winter’s requirements. Pipeline construction has tapered off. Meanwhile, companies try hard to get a collective grip on how to minimize security risk without substantial investment.
WELLHEAD PRICES
Wellhead prices peaked well above $4.00 in 2002, lifting the 2002 average to something in the neighborhood of $3.00/MMBtu. Not as good as 2001, but then, there wasn’t a wintertime spike that drove the early numbers into double-digit territory.
The price outlook for 2003 is substantially higher, averaging about $4.00/MMBtu. The impact of 1,000-plus rigs drilling for gas back in 2001 has been absorbed into the system by now, and the industry will probably have to face the possibility of a deliverability shortfall in 2003. That shortfall has yet to occur. This is likely due, at least in part, to gas-fired electric generation demand not measuring up to expectations.
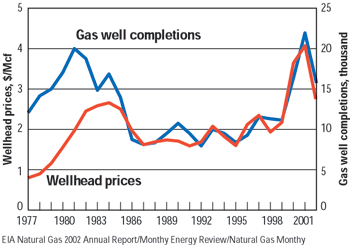
As of January 2003, wellhead prices are in the $5/MMBtu vicinity. As wintertime demand winds down, conventional wisdom holds that prices will soften, but higher prices are expected to follow when supply gets tight, sometime after mid year. The most recent pricing cycle, from high to low, lasted 14 months. A repeat performance would result in a peak about year-end 2003, Fig. 1.
 |
Fig. 1. Wellhead prices vs. gas well completions.
|
|
EXPLORATION RIG COUNT
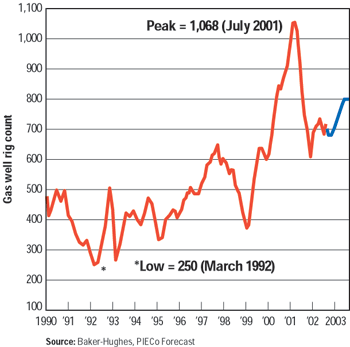
The free fall in the gas-well rig count finally hit bottom last spring and was able to cobble together a modest recovery, to above the 700 level by year end. Some experts say that demand build will require a 700-plus rig count to generate break-even reserve replacement. Now that prices have been on an upward trend for a while, it seems likely that gas producers will modestly increase drilling activity in 2003, to a number closer to 800, Fig. 2. Leading-edge operators are well tuned to the nuances of gas supply and can be expected to initiate more extensive drilling programs early on to take advantage of higher prices.
 |
Fig. 2. Gas well rig count.
|
|
DRILLING
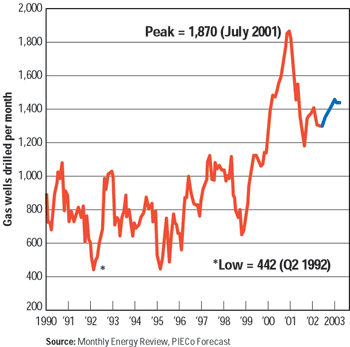
About 16,000 gas wells were drilled in 2002, down from the 2001 record of 22,000 wells drilled. The 2003 outlook for gas drilling is a replay of 2002, ending the year on the rise as supply gets tight and prices stay up, Fig. 3. Overall, 2000 – 2002 gas well drilling has been well ahead of anything since 1985. To achieve the growth in energy demand that is projected – 30 Tcf by 2015 – that growth needs to start soon.
 |
Fig. 3. Gas wells drilled.
|
|
PRODUCTION
Gas production in 2002 was essentially flat, inasmuch as demand did not live up to expectations. Production in 2003 will be driven by demand, which is projected to increase by as much as 4.7%. If coalbed methane (CBM) production continues to grow as it has over the past few years, most of the increase in the US will come from Rocky Mountain coal beds.
The depletion rate of high-production-volume fields is an issue with regard to the potential for a supply shortfall. Low-deliverability, tight-gas reserves do not bring as much to the table as the high-deliverability reserves in the Gulf of Mexico. (GOM) According to the Natural Gas Supply Association, GOM reserves are being depleted at rates approaching 50% during the first year onstream. That puts pipeline operators in a difficult position due to the cost of building short-lived pipelines and expensive deepwater-gathering facilities.
The GOM is the most prolific US gas-supply source. However, at year-end 2002, only 130-plus rigs were working in the Gulf, down from the 150 – 190 level that characterized much of 2000 – 2001. The overall GOM rig utilization rate is about 70%.
The good news is that rig activity is up from the lows of early 2002. Should higher prices become the norm, the GOM rig count could easily pass the 150 mark.
NORTH SLOPE
North Slope reserves, about 16 Tcf, dropped off the radar screen years ago due to the belief that projected pipeline-construction costs from the North Slope to the Lower-48 were prohibitive. Interest in developing Alaskan gas has revived, but the economics still haven’t improved enough to clear the competitive hurdle from alternative gas projects such as LNG and CBM. The current thinking is that North Slope and McKenzie Delta projects have been pushed back into the 2010 – 2020 time frame. Eventually, about 2 – 3 Bcfd of gas could come to the Lower – 48 from the North Slope and McKenzie Delta.
COALBED METHANE
One bright spot is the buildup in coalbed methane reserves and production, Table 1. CBM production increased at a phenomenal rate early in the 1990s, generally 50 – 100% per year. While the rate of increase has moderated, production growth continues in the 5 – 10% per year range. At year-end 2002, CBM reserves were estimated near 20 Tcf. In Wyoming’s Powder River basin alone, the US Geologic Survey has increased its estimate of technically recoverable CBM resources to 14 Tcf, up from just 1 Tcf in 1995.
| |
Table 1. Coalbed methane reserves and production |
|
| |
|
Reserves Bcf |
Production Bcf |
|
|
|
|
| |
1990 |
5,087 |
196 |
|
| |
1995 |
10,499 |
956 |
|
| |
2000 |
15,708 |
1,379 |
|
| |
2001 |
17,531 |
1,562 |
|
| |
2002E |
19,500 |
1,750 |
|
| |
Source: EIA |
|
|
Powder River coal beds are shallow and up to 300-ft thick, all of which tend to make the wells inexpensive to drill and operate. The number of producing wells increased from 515 in July 1998 to 6,469 in July 2001. As of January 2003, the basin had only 20% of the 50,000 wells that are believed necessary to fully tap the resource. Based on well productivity to date, this would mean that the basin could produce over 5 Bcfd. The dark cloud here is completion of the Powder River Basin Environmental Impact Statement.
IMPORTS
Imports reached an estimated 4.2 Tcf in 2002, up about 2%, mostly from Canada. Look for more gas to come across the border as pipelines achieve higher load factors with gas from the Western Canada Sedimentary basin and Nova Scotia. LNG is cast to take on a larger role in supplementing domestic production, but it will take a while for the projects to be implemented. Over the next five to six years, some 20 or so LNG projects have been announced which, if all are built, would add about 9 Bcfd to the gas-supply mix. At an assumed 85% load factor, that could amount to about 2.8 Tcf/yr.
DEMAND
The big lift from a recovering economy didn’t happen in 2002. Total consumption is down by nearly 6% year over year, to about 20,300 Bcf. The biggest hit was by electric utilities, down nearly 20% to roughly 2,300 Bcf. Industrial use was down by over 5% while commercial use probably broke about even. Residential use was down nearly 6%.
The outlook is for consumption to pick up in 2003, but a lot of the gain is dependent on economic recovery, which for the moment is up for grabs. At best would be something like the 2001 level of around 21,300 Bcf.
A long-term reality check is in order. The conventional wisdom holds that gas demand will pass the 30 Tcf mark by 2015. With a downturn in the economy, power plant operators will continue to back away from huge capital outlays in generation projects. One fallback position is to rethink the option of refurbishing old plants. Another is to step up the construction of distributed-generation projects requiring smaller capital outlays. Consequently, there could well be fewer of the relatively high-efficiency combined-cycle gas-turbine generating stations coming online over the next few years than previously expected.
The issue cuts both ways in terms of gas consumption, because refurbishing old gas-using facilities is less efficient, i.e., more gas is used. Conversely, refurbishing old coal-fired steam plants or extending the life of nuclear plants means a loss of market for gas. Players caught in a capital squeeze will do what they must. And as it now stands, environmental regulations are being relaxed, encouraging operators to hold off new gas-fired capacity, which in turn could lead to a shrinking of the near-term prospects for electric generation gas consumption.
STORAGE
At year-end 2002, the EIA reported that there was 2,417 Bcf of working gas in storage – a little below the average but not anything to be concerned about. Absent severe weather in January and February, storage will be sufficient to meet the call for withdrawals.
Storage fill during 2003 is expected to proceed as in past years to about 3,500 Bcf of working storage. Several new storage projects will be coming on line, and if they fill as expected, concerns about withdrawal capacity should be minimized.
PIPELINES
Pipeline construction has tapered off, but is waiting for the next big project to come along. Many miles of pipe still have to be laid to match market development. Also, there are not many major projects that must be done immediately. Under such circumstances, it is likely that major projects will be deferred as long as possible.
SECURITY
Additions and revisions to gas – industry infrastructure impact the industry’s risk profile. In these days and times, there are a lot of people getting into the act. Most are well intentioned, but many are not well-enough informed to be making decisions that have a lasting effect on how the industry enhances its security and minimizes its risks. That is, security is a work in progress and, given the opportunity, companies will avoid investing in what is needed to minimize risk. Solutions can turn on capacity additions and innovative repair and recovery systems. Many years ago, during the cold war, a lot of effort went into developing pipeline interconnects all over the country to cope with the possibility of disruption. For the most part, these interconnects are alive and well and may well serve as a starting point for more far-reaching security systems.
CANADA
Annual gas production was slightly more than 6 Tcf in 2002 which is down slightly from 2001. Exports from Canada to the US accounted for about two-thirds of annual 2002, with further increases to come, but will likely net out at something less than that against nominal US exports of 200 Bcf, mostly at St. Clair, Michigan. This represents the capacity of US pipelines to deliver gas into Eastern Canada markets, to a point where gas from offshore eastern Canada is competitive. Sable Island gas is delivered to Northeastern US markets in New England. All told, exports to the US account for about two-thirds of annual production.
Drilling has increased substantially, mostly in the Western Canada Sedimentary Basin (WCSB), but overall deliverability is up only marginally. To sustain deliverability, production from new wells must equal 20% of current production, a tall order. Look for Canadian operators to develop CBM projects, but it will be a while before production becomes significant.
According to the Canadian Gas Potential Committee, the WCSB continues to be where the majority of conventional gas is located, with estimated possible reserves of about 142 Tcf. Including Nova Scotia and the Northwest Territory, Canada’s possible gas reserves equal about 190 Tcf. Going a step further to include “reserves” in remote frontier areas, the total rises to about 233 Tcf. Further still, there exist substantial unconventional gas deposits, but such development would require considerable capital expenditures.
MEXICO
Mexico is estimated to have imported more than 200 Bcf in 2002 through 11 import points, a year-to-year increase of nearly 100%. Electric generation in northern Mexico is the primary contributor to the increase. Exports to the US have dwindled to zero and will likely stay that way for the near term.
Mexico is relatively rich in gas reserves. Most are located in the Burgos basin in northeast Mexico. Major political issues must be dealt with before much can be done to achieve a much-needed acceleration of gas production.
THE LONG OUTLOOK
There’s a lot of gas in the US and elsewhere. Most of the incremental US demand will be met by producing domestic reserves. But it’s going to take more than domestic production to satisfy expected demand over the years to come. The author estimates production to grow at 1.4% per year on average.
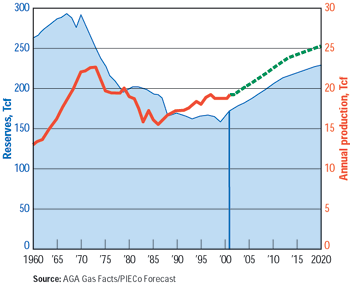
Imports from Canada will increase at a greater rate as frontier gas comes online. As LNG projects are completed, they will supplement US gas supply, which is likely close to the deliverability shortfall margin. to sustain the current R/P ratio it will be necessary to add on the average, 26 Tcf/year of new reserves out to 2020, Fig 4.
 |
Fig. 4. US dry gas reserves vs. production.
|
|
The implication is that current prices (in constant dollars with only a modest build) are enough to drive utilization-efficiency improvements and alternative-energy production technology in the years to come, which will keep gas prices from skyrocketing. Natural gas is a likeable fuel, but if the price gets out of hand, it is certain that users are an innovative bunch and will find ways to get along without using natural gas. Accordingly, this projection is constructed on the premise of only a modest increase in prices down the road. No one said it would be easy.
SUMMARY
How we got to this point. In the 1980s, the US experimented with deregulation. By the early ’90s, the US embraced deregulation and thus began a new chapter in the gas business. What happened is that in making the switch, it was hard to get everything aligned simultaneously. Deregulation is also a work in progress – witness the fiasco in California. US players have come to rely on the NYMEX screen for our price information, as have a new brand of marketers.
Where To From Here. It would be easy to say “more of the same.” But it is not that easy. Prices have moved onto a new plateau which will restructure the order of competing supply sources – be they CBM, LNG, gas from Alaska or from the ultra-deep offshore – as well as the timing of pipeline-capacity additions. Exploration on all frontiers will increase and likely be more costly as operators venture farther from existing infrastructure. Reserve additions will have to exceed production, however modestly, to preserve the R/P ratio. Otherwise, local or national deliverability shortfalls will occur.
At the front edge of the gas business, more wells can be drilled and more production delivered than ever before. The gas resource base that North America has access to will adequately fuel future needs. But, remember, no one said it would be easy. 
THE AUTHOR
|
 |
Leonard V. Parent, a World Oil contributing editor, holds a BS in chemical engineering from Purdue University, and has been active in the gas business since 1950, beginning with Natural Gas Pipeline Co. of America. He later joined Trunkline Gas Co. in Houston and, in 1968, was appointed to corporate planning for Panhandle Eastern. Mr. Parent took early retirement after 26 years with Panhandle and Trunkline, and embarked on a second career as a consultant and publisher of The Gas Price Report and The Gas Price Index.
|
| |
|
|


