Picking prospects in tight gas sands using multiple azimuth attributes
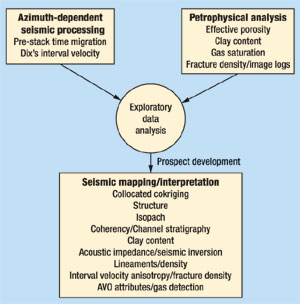
ExplorationPicking prospects in tight gas sands using multiple azimuth attributesIn the San Juan basin, reservoir qualities are highly variable. Finding the right drill site involves identification of fracture-induced anisotropy in tight gas sands. Multiple-azimuth 3D seismic attributes and petrophysical data help find the sweet spotsDr. James J. Reeves, Principal Investigator, and W. Hoxie Smith, Project Manager, GeoSpectrum, Inc. The first phase of a U.S. Department of Energy (DOE) funded project has been successfully completed. A drill site has been recommended and both the operator and DOE agree that it should be drilled. This article details the justification and methodology employed to spot this well, an Encinal Sand fractured-reservoir prospect. It was spotted by applying modern seismic-processing techniques followed by rigorous analysis of azimuth-dependent seismic attributes, and well-log data to qualify areas of high natural-fracture density, Fig. 1.
The contractor, GeoSpectrum, Inc., reprocessed a 9 mi2 3D seismic data set acquired with an omni-directional receiver array to provide broad-offset azimuth statistics. The processing was focused on stack analysis of anisotropy in multiple azimuths followed by pre-stack analysis of amplitude variation with offset (AVO). The processed data and subsequent statistical analysis of seismic attributes were interpreted for identification of fractures prospective for commercial gas production. Relationships between seismic attributes and measured reservoir properties, such as clay content, as well as Dakota fracture density interpreted from borehole-image logs, were investigated. Play Geology The following discussion on play geology was abstracted from the operator’s well files. The gas-producing unit characterized in this study is located in Rio Arriba County, New Mexico. Gas production is mainly from the Cretaceous Dakota and Gallup Sandstones. The most significant Dakota production occurs in the Lower Dakota, mainly from the Encinal and Burro Canyon Sands. Prospective Dakota horizons include both tight (conventional) and permeable (lower) sandstones. Reservoir stratigraphy of the Dakota producing interval is complex, with production potential in five individual sandstones. Dakota Sandstone depositional environments range from near marine (fluvial-deltaic) to marine. A summary of the Upper and Lower Dakota producing zones follows. Upper Dakota. The Upper Dakota comprises both near-shore marine ( e.g., Two Wells and Paguate ) and fluvial-deltaic (e.g. Cubero) members. Two Wells and Lower Paguate Sandstones are northwest-trending marine shorefaces exhibiting classic coarsening-upward sequences. Porosity of 8 – 13% characterizes both sandstones with matrix permeability between 0.2 md and 0.5 md. These sandstones require stimulation to achieve commercial rates. Cubero Sandstone. The upward fining, fluvial-deltaic Cubero, which is oriented essentially perpendicular to the Lower Paguate and Two Wells marine sandstone members, exhibits log porosity up to 10% and is typically a lower-permeability reservoir than the marine Dakota units. It was deposited in a delta where combined fluvial and wave processes were dominant. The Upper and Lower Cubero Sandstones have the best reservoir potential of the several Upper Dakota Sandstones that are typically completed. However, only the middle Cubero Sandstone has significant potential in the northwest portion of the unit. The deepest prospective, conventional Upper Dakota reservoir is the Lower Cubero Sandstone. The reservoir was deposited as a northeast-trending lobe of a fluvial-deltaic system and is characterized by average porosity of 9.5% and average matrix permeability of about 0.10 md. This "clean," brittle sandstone is prone to natural fracturing; however, hydraulic fracturing is required to achieve commercial production. Lower Dakota. These reservoirs comprise the fluvial Burro Canyon and Encinal Canyon sands that are typically thick and relatively permeable, but lithologically and petrophysically complex. Encinal Canyon Sandstone is at the base of the Dakota and was deposited by braided streams in topographic valleys. In 1993, commercial Lower Dakota gas production was established at the unit, with an Encinal Canyon sand pay-add in Well 55, essentially a new-field discovery. A three-well priority program followed this initial success in 1994 to define reservoir limits and upside potential. Of those three wells, Well 31 was a commercial success; Well 15 was wet and unsuccessful; and Well 25, a reservoir-boundary (edge) well, was marginal. As part of the 1994 priority program, data was collected to characterize the Encinal Canyon reservoir. Core taken from Well 15 indicates that this sandstone has exceptional reservoir quality compared to the tight Dakota reservoirs. Key differences include greater permeability (up to 200 md at reservoir stress), lower shale volumes and 8 – 18% greater porosity. In 1995, four additional wells were recommended. Wells 30 and 28 were developmental extensions, and 27 and 47 were exploratory extensions. In addition to the basal Dakota Encinal Canyon Sandstone, tight Dakota Sandstones were secondary targets in all four proposed wells. This stacked pay-zone potential reduced the dry-hole risk and increased the economic upside. The four additional Lower Dakota wells were drilled to further define the productive limits and extent of the new field, and to test a geological valley-fill reservoir model. The recent Well 28 was one of the most significant San Juan basin Dakota gas wells drilled in a decade, with an ultimate recovery of 9.7 Bcfg. Wells 47, 30 and 27 had various degrees of calculated Lower Dakota pay, but each of these wells proved unsuccessful. The Encinal Canyon has exceptional reservoir qualities when compared to the overlying conventional tight Upper Dakota. Encinal Canyon porosity and permeability in excess of 18% and 200 md (in situ), respectively, have been recorded in proximal cores. Unlike the Burro Canyon, the Encinal Canyon sand is more typically hydrocarbon bearing. A significant risk in Encinal completions is water invasion from sandstones above or below the gas reservoir. Water can encroach vertically through natural or hydraulic fractures. Also, within an Encinal structure / stratigraphic trap, there is increased risk of water down-dip. The Burro Canyon Sandstone is legally defined as part of the Dakota producing interval, but is stratigraphically distinct from the overlying Dakota. The Cretaceous Burro Canyon was deposited by fluvial systems atop an irregular surface formed by erosion of the Jurassic Morrison Formation. The unconformity separating these two formations represents a hiatus of about 23 – 37 million years. A thicker Burro Canyon interval was deposited in Morrison valleys and thinner Burro Canyon deposited on topographic highs. The Burro Canyon represents the base of the Cretaceous in the San Juan basin. Burro Canyon Sandstones were deposited in braided streams, far from marine influences; whereas Dakota Sandstone depositional environments range from near-marine (fluvial-deltaic) to marine. This difference in depositional environments explains why hydrocarbon source shales are present in the Dakota, but not in the Burro Canyon. Burro Canyon Sandstones generally have larger grain size, higher porosity and higher matrix permeability than typical Dakota Sandstones. Burro Canyon Sandstone is separated from the overlying Dakota by an erosional unconformity, representing 3 – 6 million years. Erosional down-cutting ultimately resulted in hydrocarbon traps, including:
Burro Canyon Sandstone is a fine-to-coarse grained, upward fining deposit that is frequently characterized by wet porosity, often in excess of 15%. Within the Burro Canyon, there are many individual sandstone units, each with its own reservoir boundaries. These are too irregular to be individually mapped. They pinch out laterally, coalesce with other sandstones and/or down-cut into underlying sandstones. Although the Burro Canyon is called sandstone, interbedded shales and siltstones are common. This bewildering stratigraphic complexity has formed permeability barriers that, in conjunction with erosional truncation and structure, created reservoirs. Prospect Development Phase I analysis resulted in a new Lower Dakota prospect / exploratory extension in the gas unit. The prospect is based on the workflow shown in Fig. 1, and is a direct work product from the tasks outlined in the DOE contract. The prospect well should extend production of the unit to the northeast about 3/4 mi from Well 28. Fig. 2 is a bubble map showing cumulative Dakota production for the study area. Ten wells comprise the field, seven of which are marginal producers, while three have each cumulatively produced more than 700 MMcfg. The close proximity of poor producers, Wells 55E and 27, to the three outstanding wells indicates Dakota reservoir complexity within the boundaries of the unit.
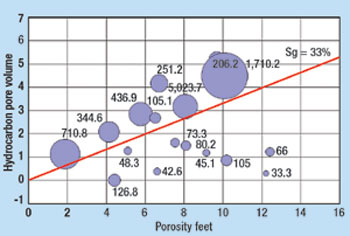
In Fig. 3, Dakota hydrocarbon pore volume vs. porosity-thickness and the average of the best 12-months of production for each well are shown. Significant wells in the unit are distinguished by a gas-saturation cut off of about 33%. Notice the apparent poor correlation between the best 12-month production for the good wells and reservoir volume (porosity-feet), which suggests a fracture-controlled reservoir.
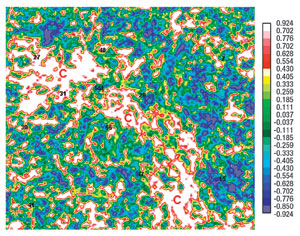
Dakota fracture counts interpreted from borehole image logs vs. the best 12-month production shows that most fractures occur in the best producing well at the unit, Well 28. Fig. 4 is a seismic-coherency horizon slice displaying characteristic Encinal fluvial-channel stratigraphy. It is observed that the best wells are found on the channel edges. Fig. 5 shows a Lower Dakota seismic isopach map. Note the agreement between Lower Dakota thickness and Encinal seismic coherency defining the fluvial channel.
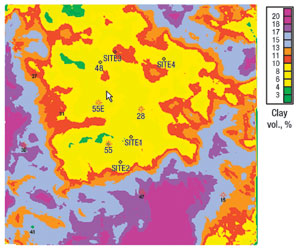
In Fig. 6, a seismic-guided Lower Dakota clay volume map is shown. It is based on petrophysical analysis of log data from nine wells. Seismic-guided mapping was done using collocated cokriging with near-trace instantaneous seismic amplitude (measured cross correlation = 0.81). The best gas-producing wells and most prospective areas are associated with wells having the least clay. Reservoir rocks having low clay content should be more brittle and more likely to fracture. Furthermore, clays typically have high water content, increasing the likelihood of a clay-rich reservoir being water-wet.
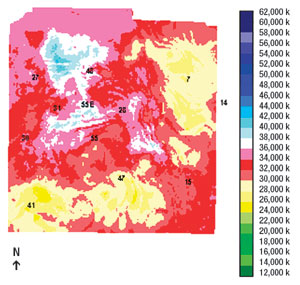
A similar result is seen by the seismic inversion. Fig. 7 shows a Lower Dakota acoustic-impedance horizon slice computed from a constrained inversion from about five wells. Petrophysical analysis shows that prospective sandstone fluvial-channel pay (effective porosity between 8% and 14%) is defined by an impedance range of about 31,000 to 36,000 g/cc-ft/ms. A plot of water saturation vs. effective porosity reveals that sands with more than about 15% porosity tend to be water-wet. Brittle- and fracture-prone lithologies should also be associated with high-impedance values.
In Fig. 8, Lower Dakota lineaments are mapped as interpreted from azimuth-dependent / all-azimuth seismic-attribute volumes. Seismic attributes analyzed in the study include azimuth-dependent / all-azimuth Dix interval velocity, instantaneous amplitude, frequency, phase, coherency, and difference attributes. Seismic imaging was improved significantly by GeoSpectrum’s reprocessing, using azimuth dependent pre-stack time migration. Migration will increase lateral spatial resolution, signal-to-noise ratio, and aid in analysis of pre-stack seismic attributes. Lineaments seen in these enhanced seismic volumes are interpreted to infer fracture zones. Note the concentrated number of lineaments found at Well 28 on the map. A similar method to interpret fracture zones using seismic lineaments was done for Arco Permian in a reservoir study of the South Justis Unit, Lea County, New Mexico.1
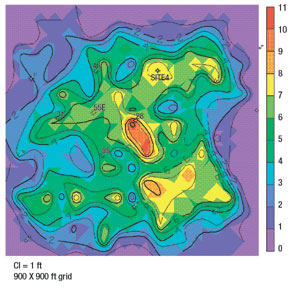
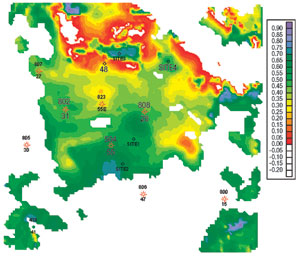
Lower Dakota lineament density (Fig. 9) is computed from the lineaments in Fig. 8. It assumes a well-drainage area of about 900 ft x 900 ft. The hotter colors are interpreted to indicate fracture-developed reservoirs showing several prospective locations.
Fig. 10 shows a preliminary seismic-guided Dakota fracture-density map modeled from Dakota fracture counts, as interpreted from borehole image logs for five wells. Fracture-density mapping was done using collocated cokriging, with Dix’s interval velocity, for an interval near the Lower Dakota, computed for 145° ±22.5° azimuth data minus 55° ±22.5° azimuth data (measured cross-correlation = – 0.61.) Note the trend of positive high fracture density associated with Well 28 on the map. A positive density indicates that fractures in the northeast direction will tend to be open in the interval. Other prospective regions of high positive fracture density are also seen to the northeast of Well 28 at the proposed Site 4 location.
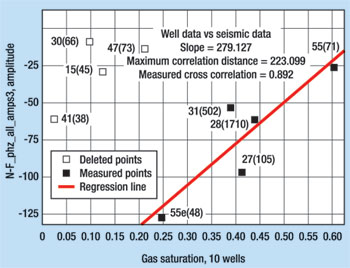
A Class 2 AVO anomaly typically exhibits a low-amplitude, near-offset response and a phase reversal with increased amplitude at far offsets.2 This was confirmed in the Dakota by comparing synthetic modeling with real gathers from dipole sonic and density logs from a nearby well, where gas saturation averages about 23%. A 25-fold supergather was computed and extracted at the Well 28 location, after normal moveout and pre-stack time migration. This revealed an apparent Lower Dakota Class 2 AVO anomaly that is visible through most of the 3D seismic volume. The crossplot in Fig. 11 shows Lower Dakota near-trace phase minus far-trace phase vs. gas saturation. The outlying wells with gas saturations below 24% have Lower Dakota clay content greater than 13%. The red trend-line is based on the remaining five wells that have clay content less than 13% and gas saturations greater than 24%. Note that three of these five wells (28, 55 and 31) are the most productive wells in the unit, and are associated with a phase difference ranging between – 15° and – 85°. The red trend-line has a measured cross-correlation coefficient of 0.89. The analysis of a phase dependent AVO attribute decreases the concern with amplitude scaling issues in the seismic data.
Mapping seismic phase difference values between – 15° and – 85° reveals two prospective trends that correspond to regional Dakota production. If this map is further constrained by showing only areas with estimated clay less than about 12 – 13% (i.e., Fig. 6), the results show areas of brittle, fracture-prone rocks having a favorable AVO attribute. Fig. 12 shows seismic-guided Lower Dakota gas saturation modeled from the phase difference attribute with estimated clay content less than about 12 – 13%. Seismic-guided mapping was done using collocated cokriging and the empirical trend-line (phase difference vs. gas saturation) in Fig. 11. Gas saturations between about 40% and 60% define prospective trends for Lower Dakota fracture-controlled gas production at the unit. The gas saturation mapped in Fig. 12 should only be used to define prospective trends for gas production, not for actual gas saturation values.
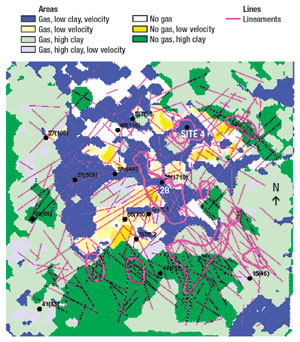
Efforts to model the phase vs. gas saturation characteristic on Fig.11 using Gassman modeling methods have been unsuccessful. The authors are hopeful to obtain additional funding from the DOE for AVO modeling. Conclusions In Fig. 13, a composite-attribute map comprising seismic lineaments (pink lines), high lineament density (red outlines), favorable AVO attributes and low clay (dark blue) is shown. Dark blue regions inside the red outlines therefore indicate the most prospective drill locations. The new drill location is indicated by Site 4 on the map. The three Lower Dakota productive wells (28, 55 and 31) appear to be predicted with nearly 100% success. The following methodology was used:
Validation. The results of new Well 48 (a blind test), drilled last year about 1 mi northwest of Well 28, were held confidential from GeoSpectrum (the contractor) during the study. The results from this marginally producing well were not integrated into the work. The summary of contractor’s methodology (Fig. 13) would not have supported drilling this well. The well was spotted in a region of low seismic lineament density and poor AVO attribute. Fig. 14 shows the depth-converted Lower Dakota seismic structure map. Note that the contractor-proposed well (Site 4) is favorably located nearly on strike with the prolific Well 28. Also, the Lower Dakota seismic isopach map (Fig. 5) shows more favorable, thicker reservoir section at the proposed Site 4 location than it does for Well 28.
The contractor recommends that the proposed well (Site 4) be drilled and that the DOE contract continue on to Phase II. Drilling the new prospect is critical to further validate the results of the Phase I effort. Additionally, drilling the proposed well will determine the value of the applied methodology in detecting commercial and prospective gas targets in tight gas sands. Interactive website / application services. An interactive website utilizing a generic project database is being developed to illustrate best practice methodologies applicable for fractured-reservoir exploration. The website will allow the user to interact with the latest application software and the opportunity to apply the developed technology through the contractor’s Internet-based application services. Acknowledgment Most of the funding for the study came from the DOE and the operator. The project benefited greatly from data and interpretations provided by the operator, their employees and associates. The section on Play Geology in the paper was abstracted from the operator’s well files by W. Roger Smith, seismic data processing was done by Don Zimbeck, Jim Oden did the seismic interpretation, Jeff Kane did the petrophysical analysis, Sylvia Chamberlain was responsible for exploratory data analysis and AVO analysis / modeling, and Mark Semmelbeck did the production data analysis. The timeliness and assistance of the DOE technical contract managers is greatly appreciated. Literature Cited 1 Reeves, J. J. and W. H. Smith, "An integrated reservoir characterization study of the Upper Blinebry interval, South Justis Unit, Lea County, New Mexico (Abs.)," West Texas Geological Society Fall Symposium, Midland, Texas, Oct. 28 – 29, 1999, p. 31. 2 Castagna, J. P., C. Peddy, C. D. Lausten and E. Mueller, "Evaluation of seismic amplitude versus offset techniques for the direct detection of gas reservoirs: Phase II – Increasing the use of amplitude versus offset techniques in the continental United States," Gas Research Institute Final Report, no. GRI-98/0120, 1998, p. 5 and 108 (Fig. 1 and 73, respectively).
|
|||||||||||||||||||||||||||||||||||||||||||||||||

- Applying ultra-deep LWD resistivity technology successfully in a SAGD operation (May 2019)
- Adoption of wireless intelligent completions advances (May 2019)
- Majors double down as takeaway crunch eases (April 2019)
- What’s new in well logging and formation evaluation (April 2019)
- Qualification of a 20,000-psi subsea BOP: A collaborative approach (February 2019)
- ConocoPhillips’ Greg Leveille sees rapid trajectory of technical advancement continuing (February 2019)

