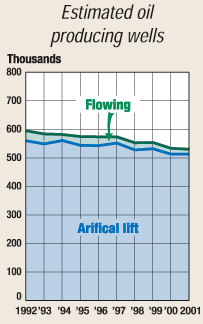
United States: Producing oil wells
PRODUCING OIL WELLSPrice cut slows comeback
While positive numbers from a few areas kept the decline to a minimal 0.6%, or 3,058 wells last year, from 2000, producing U.S. oil wells did not fully recover from the 12,000-well loss in 2000. The category that fluctuates the most with price is stripper wells. Those states with large numbers of low-volume wells have seen many shut-ins. Notable losses are recorded in Illinois, Northeast Texas and West Virginia. In the latter case, the state agency reported a record low number of 8,450 wells, down 7,450 from typical numbers. Areas that have active extra recovery projects underway, such as CO2 flooding, held up relatively well. Examples are Southeast New Mexico and, particularly, Texas District 8, in which the Railroad Commission reported a near-6,000-well increase. A strong early-year drilling program in District 1 also boosted well numbers by over 1,300 wells. Elsewhere, there were gains and losses, depending on how long the drilling surge lasted. Example states with large numbers of oil wells include: California, a 1.1% jump to 43,078; Kansas, down 2.6% to 42,350; Kentucky, about level at 29,557; Louisiana (North) down 1.9% to 21,225; Ohio, steady at 29,087; Oklahoma, down slightly to 84,252; Pennsylvania, up 11.3% to 16,750; Wyoming, up 5.3% to 10,160; and Texas, an overall 3.3% rise to 159,240. It’s easy to turn off a 5 to 10-bopd stripper when $18 oil is not paying maintenance costs. Adding new wells by drilling / development is not as easy. Increasing oil demand later this year should reverse some of these limiting factors.
|
|||||||||||||||||||||||||||||||||||||||||||||||||||||||||||||||||||||||||||||||||||||||||||||||||||||||||||||||||||||||||||||||||||||||||||||||||||||||||||||||||||||||||||||||||||||||||||||||||||||||||||||||||||||||||||||||||||||||||||||||||||||||||||||||||||||||||||||||||||||||||||||||||||||||||||||||||||||||||||||||||||||||||||||||||||||||||||||||||||||||||||||||||||||||||||||||||||||||||||||||||||||||||||||||||||||||||||||||||||||||||||||||||||||||||||||||||||||||||||||||||||||||||||||||||||||||||||||||||||||||||||||||||||||
- Prices and governmental policies combine to stymie Canadian upstream growth (February 2024)
- U.S. producing gas wells increase despite low prices (February 2024)
- U.S. drilling: More of the same expected (February 2024)
- U.S. oil and natural gas production hits record highs (February 2024)
- U.S. upstream muddles along, with an eye toward 2024 (September 2023)
- Canada's upstream soldiers on despite governmental interference (September 2023)
- Applying ultra-deep LWD resistivity technology successfully in a SAGD operation (May 2019)
- Adoption of wireless intelligent completions advances (May 2019)
- Majors double down as takeaway crunch eases (April 2019)
- What’s new in well logging and formation evaluation (April 2019)
- Qualification of a 20,000-psi subsea BOP: A collaborative approach (February 2019)
- ConocoPhillips’ Greg Leveille sees rapid trajectory of technical advancement continuing (February 2019)


