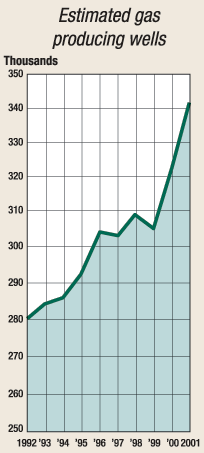
United States: Producing gas wells
PRODUCING GAS WELLSHigh prices, record well levels
Record-setting natural gas prices in late 2000 and early 2001 produced by tight supplies and a cold winter focused operators’ attention on gas production increases and gas drilling. That activity surge carried on until mid-year 2001, when the rig count began its free-fall. The demand for gas and a period of $10/Mcf prices was enough to cause an 8,154-well increase in 2000, and an even larger 17,186-well increase to 341,762 in 2001. States with significant gas-well numbers were all up, with the exception of West Virginia, which reported anomalously high well levels in 2001. Texas increased by 5,184 wells, with every district reporting increases, particularly District 4 in the far South; District 5, NE; District 7C, West Central; and District 10 in the Panhandle. Colorado increased its wells by 2,468 to 13,283. Kentucky’s gas wells jumped by 4,387 to 19,387. Oklahoma was up 1,393 wells to 32,949; and Pennsylvania boosted its already-high count 850 wells to 34,864. Other states with large numbers of wells include: Kansas, up 4.8% to 16,250; Louisiana (North), up 2.9% to 13,407; and Ohio, level at 33,945. Coalbed methane wells included in the state totals significantly affect Rocky Mountain-state gas-well counts. Colorado’s total, for example, includes 2,387 CBM wells; and New Mexico’s Northwest region has a significant percent of its 21,650 wells producing CBM. Wyoming’s CBM wells have rapidly expanded conventional gas-well levels of around 3,000 to over 8,000 total wells; and the state reports handling CBM drilling permits numbering in the several thousands. Shallow CBM wells can be drilled in less than two days in some areas. For 2002, full storage and a mild winter have dropped gas prices to $2.00 levels for most of the first half. Leonard Parent’s North American gas outlook in this issue analyzes the supply / demand factors, including Canadian / Mexican imports and the critical reserve life index. The conclusion, shared by many, is that an economic / industrial turnaround from the late-2001 recession could spur gas demand; and significant reserves will be needed to meet the U.S. growth from 2001’s 19.5 Tcf/yr production, to 26 Tcf/yr by 2015. It’s not a situation wherein many producible gas wells will be taken offstream for long.
|
||||||||||||||||||||||||||||||||||||||||||||||||||||||||||||||||||||||||||||||||||||||||||||||||||||||||||||||||||||||||||||||||||||||||||||||||||||||||||||||||||||||||||||||||||||||||||||||||||||||||||||||||||||||||||||||||||||||||||||||||||||||||||||||||||||||||||||||||||||||||||||||||||||||||||||||||||||||||||||||||||||||||||||||||||||||||||||||||||||||||||||||||||||||||||||||||||||||||||||||||||||||||||||||||||||||||||||||||||||
- Prices and governmental policies combine to stymie Canadian upstream growth (February 2024)
- U.S. producing gas wells increase despite low prices (February 2024)
- U.S. drilling: More of the same expected (February 2024)
- U.S. oil and natural gas production hits record highs (February 2024)
- U.S. upstream muddles along, with an eye toward 2024 (September 2023)
- Canada's upstream soldiers on despite governmental interference (September 2023)


