Technology at Work: Mapping fractures in real time
Feb. 2002 Vol. 223 No. 2 Feature Article TECHNOLOGY AT WORK Mapping fractures in real time New fracture-mapping technologies allow direct measurement of fr
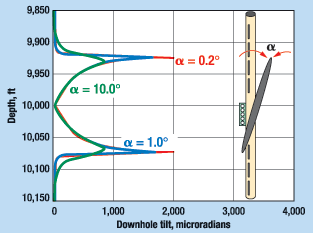
TECHNOLOGY AT WORKMapping fractures in real timeNew fracture-mapping technologies allow direct measurement of fracture parameters that were previously only modeled or assumed. Every diagnostic technology has its limitations, and the most notable has been the need for a nearby offset monitoring well – until now. Although offset well tilt-mapping is well understood and has been used by Pinnacle Technologies on more than 600 frac treatments in the past three years, tilt-mapping from within the treatment well brings a new set of challenges. Minute wellbore movements are measured in the midst of a high-velocity flowstream. Fortunately, fracture-induced tilt signals are much higher than noise induced from fluid motion in the treatment well. Fracture height and width are measured in real time during treatment; those dimensions and tilt-mapping procedures are then used in conjunction with proprietary FracproPT software to estimate fracture length based on these measurements, as well as matching modeled to actual net-pressure data. Fig. 1 shows how fracture-induced tilt of the treatment wellbore vs. depth varies with changes in dip-angle deviations (0.2° to 10°) between the wellbore and fracture. Tilt data vs. depth is shown averaged over a sliding 8-ft window, since 8 ft is the rough length of the downhole tiltmeters used to measure the wellbore tilt.
Case study. New Dominion LLC is developing the Hunton play in Little field in Central Oklahoma. These wells are acid-fractured without proppant, and acid frac geometry is not well understood. Formation mechanical properties, acid reactivity and other parameters have made it difficult to model induced-fracture geometry. Due to lack of nearby offset well locations, Pinnacle’s new Treatment Well Tiltmeters were employed to measure fracture geometry during a live acid-fracture treatment. A treatment-well array was installed to map real-time fracture growth on the acid-fracture treatment in a perforated interval 4,320 – 4,400 ft. Eight tiltmeters spanned the interval from 25 ft below the bottom perforation to 115 ft above the top perforation. Fig. 2 illustrates the events. The pumping rate was held constant at 20 bpm during the first 10 min. of treatment, during which time the fracture height was measured to be contained mostly within the perforated interval, with at most 30 ft of height growth above the perforations.
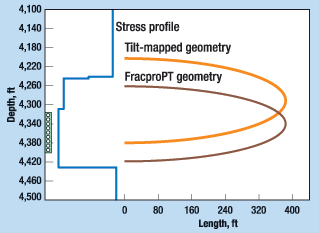
After the first 10 min., the pumping rate was increased to 50 bpm and held at that rate through the end of the 90,000-gal treatment. After the rate increase, fracture height was seen to grow rapidly, reaching more than 100 ft above the top perforated zone within a few minutes. As shown, fracture-induced tilt is relatively unchanged until the rate increase, then rapidly increases as the fracture top approaches the tiltmeter tool. Reversal in tilt response seen at 13:44 is due to the fracture diverting elsewhere (decreasing tilt) and then approaching this depth again. Results. From treatment-well tiltmeter data, it is clear that the treatment stayed reasonably centered on the target interval during the lower-rate pumping stages, but later fracture growth is primarily out-of-zone during the higher-rate pumping stages, Fig. 3. Treatment-well tiltmeters are useful for measuring rate-dependent fracture geometry and making changes to a treatment "on the fly." Such changes help contain the treatment to the pay interval or avoid undesirable fluid contacts (water zones, gas caps, etc.) In this case, a maximum critical pumping rate was identified, and its impact upon fracture geometry can be seen for future design and optimization considerations. More details are available from paper SPE 71648, from which this article was derived.
|
- Shale technology: Bayesian variable pressure decline-curve analysis for shale gas wells (March 2024)
- Prices and governmental policies combine to stymie Canadian upstream growth (February 2024)
- U.S. producing gas wells increase despite low prices (February 2024)
- U.S. drilling: More of the same expected (February 2024)
- U.S. oil and natural gas production hits record highs (February 2024)
- Quantum computing and subsurface prediction (January 2024)


